Skip Navigation LinksSkip Navigation Links
Centers for Disease Control and Prevention
Safer Healthier People
Blue White
Blue White
bottom curve
CDC Home Search Health Topics A-Z spacer spacer
spacer
Blue curve MMWR spacer
spacer
spacer

Notifiable Diseases/Deaths in Selected Cities Weekly Information

Figure_I Selected notifiable disease reports, comparison of 4-week totals ending May 4, 1996, with historical data -- United States

Table_I Summary -- cases of selected notifiable diseases, United States, cumulative, week ending May 4, 1996 (18th Week)

Table_II Cases of selected notifiable diseases, United States, weeks ending May 4, 1996 and May 6, 1995 (18th Week)

Table_III Cases of selected notifiable diseases preventable by vaccination, United States, weeks ending May 4, 1996 and May 6, 1995 (18th Week)

Table_IV Deaths in 121 U.S. cities, week ending May 4, 1996 (18th Week)

+------------------------------------------------------------------- -------+

|             |

| Erratum: Vol. 45, No. 18 |

|             |

| SOURCE: MMWR 45(21);447 DATE: May 31, 1996 |

|             |

| On page 381, Figure_Ie, Selected notifiable disease reports, |

| comparison of 4-week totals ending May 4, 1996, with historical data -- |

| United States, was incorrect. The graph below is correct for the week |

| ending May 4, 1996. |

|             | +------------------------------------------------------------------- -------+


Figure_I

Figure_I
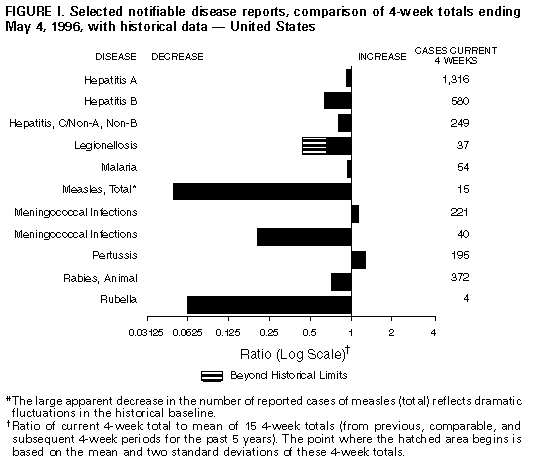
Return to top.

Table_I
Note: To print large tables and graphs users may have to change their printer settings to landscape and use a small font size.

TABLE I. Summary -- cases of specified notifiable diseases, United States,
cumulative, week ending May 4, 1996 (18th Week)
============================================================================
                                             Cum. 1996
------------------------------------------------------
Anthrax                                              -
Brucellosis                                         24
Cholera                                              1
Congenital rubella syndrome                          2
Cryptosporidiosis*                                 485
Diphtheria                                           1
Encephalitis:  California*                           -
               eastern equine*                       1
               St. Louis*                            -
               western equine*                       -
Hansen Disease                                      30
Hantavirus pulmonary syndrome*+                      4
HIV infection, pediatric*&                          92
Plague                                               -
Poliomyelitis, paralytic@                            -
Psittacosis                                          8
Rabies, human                                        -
Rocky Mountain spotted fever (RMSF)                 41
Streptococcal toxic-shock syndrome*                  9
Syphilis, congenital**                               -
Tetanus                                              4
Toxic-shock syndrome                                47
Trichinosis                                         10
Typhoid fever                                       92
------------------------------------------------------
 * Not notifiable in all states
 + Updated weekly from reports to the Division of Viral and Rickettsial
   Diseases, National Center for Infectious Diseases (NCID).
 & Updated monthly to the Division of HIV/AIDS Prevention, National
   Center for HIV, STD, and TB Prevention (NCHSTP) (proposed), last update
   April 30, 1996.
 @ No suspected cases of polio reported for 1996.
** Updated quarterly from reports to the Division of STD Prevention,
   NCPS. First quarter 1996 is not yet available.
-: no reported cases
============================================================================

Return to top.

Table_II
Note: To print large tables and graphs users may have to change their printer settings to landscape and use a small font size.

TABLE II. (page 1) Cases of selected notifiable diseases, United States, weeks ending
May 4, 1996, and May 6, 1995 (18th Week)

                                                       Escherichia
                                                      coli O157:H7
                                                   -------------------                                Hepatitis
                          AIDS*        Chlamydia    NETSS**   PHLIS***         Gonorrhea               C\NA,NB             Legionellosis
                   -----------------   ---------   --------   --------    -------------------      ----------------      -----------------
Reporting Area       Cum.       Cum.        Cum.       Cum.       Cum.       Cum.        Cum.       Cum.       Cum.       Cum.        Cum.
                     1996       1995        1996       1996       1996       1996        1995       1996       1995       1996        1995
------------------------------------------------------------------------------------------------------------------------------------------
UNITED STATES      21,920     24,547      79,002        267        113     92,811     129,892      1,147      1,389        230         403

NEW ENGLAND           878      1,308       3,263         27         16      2,585       1,843         42         36         12           4
Maine                  15         23           -          3          -         15          23          -          -          1           -
N.H.                   25         43         224          1          1         41          34          1          5          -           -
Vt.                     8         12           -          5          5         22          17         18          4          1           -
Mass.                 490        634       2,297         11         10        761       1,027         20         26          5           3
R.I.                   61         87         742          2          -        192         189          3          1          5           1
Conn.                 279        509           -          5          -      1,554         553          -          -          N           N

MID. ATLANTIC       5,707      6,096      12,505         40         20      9,861      14,943        112        127         50          53
Upstate N.Y.          568        685           N         21         10      1,963       3,423         99         62         10          12
N.Y. City           3,281      3,063       4,121          -          -      2,608       5,501          1          1          -           1
N.J.                1,143      1,460       1,893         12          5      1,827       1,185          -         54          7          11
Pa.                   715        888       6,491          N          5      3,463       4,834         12         10         33          29

E.N. CENTRAL        1,874      2,066      12,844         45         23     14,246      27,219        147        114         72         133
Ohio                  438        473       3,237         21          8      1,833       8,430          4          4         34          54
Ind.                  309        164       3,358         12          6      2,495       2,847          6          -         17          34
Ill.                  758        887           -          2          2      5,922       7,148         10         40          2          15
Mich.                 257        420       4,101         10          7      2,911       6,532        127         70         16          14
Wis.                  112        122       2,148          N          -      1,085       2,262          -          -          3          16

W.N. CENTRAL          548        545       8,433         40         19      5,122       7,211         90         24         14          26
Minn.                 109        119           -          6         12          U       1,040          -          1          -           -
Iowa                   44         32       1,261          7          4        372         532         71          3          3           8
Mo.                   237        214       4,745          6          -      2,784       4,188         14         10          1           8
N. Dak.                 4          1           2          1          1          1          11          -          -          -           2
S. Dak.                 7          7         476          1          -         74          69          -          1          2           -
Nebr.                  40         51         388          4          -         57         351          1          6          6           6
Kans.                 107        121       1,561         15          2        835       1,020          4          3          2           2

S. ATLANTIC         5,803      6,684      18,365         17          3     35,007      37,750         58         91         31          65
Del.                  114        131           -          -          -        499         703          1          -          -           -
Md.                   658        994       1,935          N          1      4,407       4,516          -          2          6          14
D.C.                  373        438           N          -          -      1,515       1,703          -          -          1           3
Va.                   317        520       4,136          N          1      3,314       3,778          5          2          9           4
W. Va.                 31         30           -          N          -        160         223          4         20          1           3
N.C.                  266        310           -          5          1      6,765       8,642         18         23          3          11
S.C.                  283        322           -          1          -      3,961       4,016         13          4          3          13
Ga.                   871        869       4,178          3          -      7,932       6,848          -         11          -           8
Fla.                2,890      3,070       8,116          5          -      6,454       7,321         17         29          8           9

E.S. CENTRAL          776        815       9,518          9          4     10,192      15,247        227        488         20          12
Ky.                   120         81       2,235          -          -      1,378       1,589         10         11          2           3
Tenn.                 283        347       4,096          N          4      3,548       4,661        192        475          9           5
Ala.                  244        230       2,989          2          -      4,655       5,964          1          2          -           3
Miss.                 129        157         198          3          -        611       3,033         24          -          9           1

W.S. CENTRAL        2,096      2,220       4,448         11          4      6,775      11,413        126         76          2           6
Ark.                   97         86           -          5          2        916       1,707          1          1          -           1
La.                   559        360       2,388          N          2      2,732       4,197         58         43          -           2
Okla.                  55        100       2,060          1          -      1,299          10         38         20          2           3
Tex.                1,385      1,674           -          1          -      1,828       5,499         29         12          -           -

MOUNTAIN              648        818       5,480         31         15      2,400       3,248        211        160         10          48
Mont.                   8          8           -          -          -         10          30          8          7          1           2
Idaho                  10         22         571         11          4         32          46         62         22          -           1
Wyo.                    2          4         246          -          -         10          17         72         62          2           2
Colo.                 181        268           -         11          5        591       1,036          4         30          4          22
N. Mex.                43         71           -          2          -        313         375         29         22          -           4
Ariz.                 197        201       3,737          N          6      1,210       1,170         25          7          2           5
Utah                   79         52         254          5          -         49          82          7          5          -           3
Nev.                  128        192         672          2          -        185         492          4          5          1           9

PACIFIC             3,590      3,995       4,146         47          9      6,623      11,018        134        273         19          56
Wash.                 313        416       3,427         10          5        815         883         26         66          1           4
Oreg.                 189        158           -         12          -        143         165          3         18          -           -
Calif.              3,025      3,280           -         21          -      5,351       9,432         44        179         18          47
Alaska                 10         39           N          -          -        192         299          2          1          -           -
Hawaii                 53        102         430          N          4        122         239         59          9          -           5

Guam                    3          -          90          N          -         22          32          -          -          -           -
P.R.                  423        952           N          N          U         98         199         16         52          -           -
V.I.                    6         19           N          N          U          -          14          -          -          -           -
Amer. Samoa             -          -           -          N          U          -           8          -          -          -           -
C.N.M.I.                -          -           N          N          U         11          10          -          -          -           -
------------------------------------------------------------------------------------------------------------------------------------------
N: Not notifiable    U: Unavailable    -: no reported cases    C.N.M.I.: Commonwealth of North Mariana Islands

  * Updated monthly to the Division of HIV/AIDS Prevention, National Center for HIV, STD, and TB Prevention (proposed), last update
    April 30, 1996.
 ** National Electronic Telecommunications System for Surveillance.
*** Public Health Laboratory Information System.

=======================================================================================================================================================

TABLE II. (page 2) Cases of selected notifiable diseases, United States, weeks ending
May 4, 1996, and May 6, 1995 (18th Week)

                                                                  Meningococcal             Syphilis
                          Lyme                 Malaria               Disease         (Primary & Secondary)     Tuberculosis           Rabies, Animal
                    ----------------       ----------------      ----------------    ---------------------   -----------------       ----------------
Reporting Area       Cum.       Cum.        Cum.       Cum.       Cum.       Cum.        Cum.       Cum.       Cum.       Cum.        Cum.       Cum.
                     1996       1995        1996       1995       1996       1995        1996       1995       1996       1995        1996       1995
-----------------------------------------------------------------------------------------------------------------------------------------------------
UNITED STATES       1,134      1,555         313        328      1,322      1,248       3,777      5,823      5,150      5,546       1,647      2,316

NEW ENGLAND            47        115           9         14         47         59          59         75        132        122         189        621
Maine                   -          1           3          1          7          3           -          2          4          -           -          -
N.H.                    1         10           1          1          1         12           1          1          3          4          23         75
Vt.                     -          1           1          -          2          6           -          -          -          1          56         84
Mass.                  20         15           3          3         18         18          27         26         54         62          33        240
R.I.                   21         10           1          2          -          -           -          1         18         15          20         86
Conn.                   5         78           -          7         19         20          31         45         53         40          57        136

MID. ATLANTIC         946      1,176          79         74        105        136         152        343        897      1,174         250        518
Upstate N.Y.          464        642          19         12         31         43          14         34        107        111         135        199
N.Y. City             154         34          35         35         16         13          54        181        457        672           -          -
N.J.                   72        141          22         18         31         32          48         67        218        213          51        116
Pa.                   256        359           3          9         27         48          36         61        115        178          64        203

E.N. CENTRAL           15         16          29         47        183        187         585        968        605        486          11          2
Ohio                   13          5           6          2         67         51         222        337         87         91           2          1
Ind.                    2          7           4          3         27         31          86         94         58         45           1          -
Ill.                    -          3           7         33         46         48         178        354        400        332           -          1
Mich.                   -          1           8          4         25         32          41        113         39          -           4          -
Wis.                    U          U           4          5         18         25          58         70         21         18           4          -

W.N. CENTRAL           38         26           5          8        115         71         157        293        135        198         164        107
Minn.                   1          -           1          3         10         14          27         17         24         37           9          6
Iowa                   16          1           1          -         24         14           7         24         17         28          84         34
Mo.                     2         11           2          4         53         25         116        236         55         78          10         12
N. Dak.                 -          -           -          -          2          -           -          -          2          1          14         10
S. Dak.                 -          -           -          -          3          3           -          -         11          8          37         24
Nebr.                   -          1           -          1         10          6           3          7          7          8           2          -
Kans.                  19         13           1          -         13          9           4          9         19         38           8         21

S. ATLANTIC            46        161          60         69        249        207       1,229      1,498        846        875         818        757
Del.                    1         17           2          1          2          2          13          7          -         18          18         39
Md.                    24        110          19         19         24         13         197        134         92        150         193        153
D.C.                    -          1           3          7          4          2          58         46         44         37           2          5
Va.                     -          8           7         13         22         26         177        250         43         62         192        129
W. Va.                  3          7           1          -          6          3           1          1         20         35          33         35
N.C.                   10          8           7          6         33         37         382        400        122         89         203        150
S.C.                    2          5           3          -         28         29         159        248         40        102          20         47
Ga.                     -          4           7          9         74         50         109        265        213          7         106        105
Fla.                    6          1          11         14         56         45         133        147        272        375          51         94

E.S. CENTRAL           15          9           7          7         88         74         970      1,516        401        473          59         98
Ky.                     2          1           -          -         14         21          53         81         86         97          17          8
Tenn.                   5          5           5          2          7         22         366        290         74        154          19         40
Ala.                    1          1           1          5         35         16         198        217        155        146          23         49
Miss.                   7          2           1          -         32         15         353        928         86         76           -          1

W.S. CENTRAL            5         25          10          5        156        144         440        777        492        677          21         44
Ark.                    3          2           -          1         22         17         106        162         20         74           3         22
La.                     -          -           -          1         31         20         201        397          -          -          10          9
Okla.                   2         13           -          -         14         15          59          -         30          -           8         13
Tex.                    -         10          10          3         89         92          74        218        442        603           -          -

MOUNTAIN                -          1          22         23         84        101          39         99        182        135          23         34
Mont.                   -          -           1          2          1          2           -          3          7          3           -         15
Idaho                   -          -           -          1         10          4           1          -          3          6           -          -
Wyo.                    -          -           2          -          3          5           1          -          1          1          10          9
Colo.                   -          -          12         12         12         21          14         59         25          5           1          -
N. Mex.                 -          -           1          3         18         21           -          1         28         22           1          -
Ariz.                   -          -           3          2         26         36          20         16         77         87           9          9
Utah                    -          -           2          2          8          5           -          3         10         10           -          -
Nev.                    -          1           1          1          6          7           3         17         31          1           2          1

PACIFIC                22         26          92         81        295        269         146        254      1,460      1,406         112        135
Wash.                   -          -           5          8         39         38           2          6         83         89           -          -
Oreg.                   6          1           8          6         57         51           3          6         35         21           -          -
Calif.                 15         25          75         59        193        174         141        241      1,265      1,209         104        129
Alaska                  -          -           1          1          4          4           -          1         19         29           8          6
Hawaii                  1          -           3          7          2          2           -          -         58         58           -          -

Guam                    -          -           -          -          1          2           2          1         28          4           -          -
P.R.                    -          -           -          -          3         12          57        114         20         53           9         26
V.I.                    -          -           -          -          -          -           -          1          -          -           -          -
Amer. Samoa             -          -           -          -          -          -           -          -          -          2           -          -
C.N.M.I.                -          -           -          -          -          -           1          -          -         11           -          -

-----------------------------------------------------------------------------------------------------------------------------------------------------
N: Not notifiable    U: Unavailable    -: no reported cases

=======================================================================================================================================================

Return to top.

Table_III
Note: To print large tables and graphs users may have to change their printer settings to landscape and use a small font size.

TABLE III. (page 1) Cases of selected notifiable diseases preventable by vaccination, United
States, weeks ending May 4, 1996, and May 6, 1995 (18th Week)

                                                Hepatitis (Viral), by type                         Measles (Rubeola)
                     H. influenzae,       ---------------------------------------        -------------------------------------
                        invasive                  A                     B                  Indigenous            Imported**
                    ----------------      -----------------     -----------------        ---------------       ---------------
Reporting Area       Cum.       Cum.        Cum.       Cum.       Cum.       Cum.                   Cum.                  Cum.
                     1996*      1995        1996       1995       1996       1995        1996       1996       1996       1996
------------------------------------------------------------------------------------------------------------------------------
UNITED STATES         471        490       8,474      8,728      2,821      3,232           5         89          1          9

NEW ENGLAND            12         26         103         64         53         73           -          5          -          1
Maine                   2          1          10         13          2          2           -          -          -          -
N.H.                    7          6           3          4          2          8           U          -          U          -
Vt.                     -          1           2          3          2          1           -          1          -          -
Mass.                   3          7          53         19         16         22           -          3          -          1
R.I.                    -          -           3          9          4          7           -          -          -          -
Conn.                   -         11          32         16         27         33           -          1          -          -

MID. ATLANTIC          69         48         566        494        444        383           -          2          -          2
Upstate N.Y.           21         14         139        107        115        111           -          -          -          -
N.Y. City               7          8         244        219        203         87           -          2          -          1
N.J.                   25          8         123         76         88        118           -          -          -          -
Pa.                    16         18          60         92         38         67           -          -          -          1

E.N. CENTRAL           69         90         723      1,222        298        399           -          3          -          2
Ohio                   45         47         348        698         45         35           -          2          -          -
Ind.                    2         14         121         56         45         90           -          -          -          -
Ill.                   14         22          99        240         42        109           -          -          -          -
Mich.                   3          7         116        138        144        138           -          -          -          2
Wis.                    5          -          39         90         22         27           -          1          -          -

W.N. CENTRAL           20         30         665        488        176        224           -          4          -          1
Minn.                   7         12          27         51          6         16           -          4          -          1
Iowa                    6          2         168         24         68         15           -          -          -          -
Mo.                     5         13         301        345         78        160           -          -          -          -
N. Dak.                 -          -          17         10          -          2           -          -          -          -
S. Dak.                 1          -          29         11          -          1           -          -          -          -
Nebr.                   1          1          76         12          6         14           -          -          -          -
Kans.                   -          2          47         35         18         16           -          -          -          -

S. ATLANTIC           113        133         290        367        393        449           -          2          -          -
Del.                    1          -           5          6          1          3           -          1          -          -
Md.                    27         37          73         71        103         93           -          1          -          -
D.C.                    1          -          12          3         14          9           -          -          -          -
Va.                     3         12          52         69         52         34           -          -          -          -
W. Va.                  4          6           8         10         10         21           -          -          -          -
N.C.                   13         18          42         42        129        116           -          -          -          -
S.C.                    3          -          29         13         35         19           -          -          -          -
Ga.                    57         28           7         39          5         47           -          -          -          -
Fla.                    4         32          62        114         44        107           -          -          -          -

E.S. CENTRAL            8          4         716        484        291        365           -          -          -          -
Ky.                     2          1           8         23         21         38           -          -          -          -
Tenn.                   -          -         513        391        189        285           -          -          -          -
Ala.                    5          3          81         40         20         42           -          -          -          -
Miss.                   1          -         114         30         61          -           -          -          -          -

W.S. CENTRAL           14         20       1,464        873        269        334           -          -          -          1
Ark.                    -          4         206         60         30         12           -          -          -          -
La.                     -          1          47         32         39         64           -          -          -          -
Okla.                  14         13         643        191         33         42           -          -          -          -
Tex.                    -          2         568        590        167        216           -          -          -          1

MOUNTAIN               56         42       1,089      1,488        326        244           1          6          1          1
Mont.                   -          -          50         24          4          8           -          -          -          -
Idaho                   1          2         116        160         48         34           -          -          -          -
Wyo.                   29          2          13         54         12          6           -          -          -          -
Colo.                   5          7          22        187          8         45           -          1          1          1
N. Mex.                 7          6         183        284        138         90           -          -          -          -
Ariz.                   7         12         350        421         59         32           1          2          -          -
Utah                    5          4         296        310         43         19           -          -          -          -
Nev.                    2          9          59         48         14         10           -          3          -          -

PACIFIC               110         97       2,858      3,248        571        761           4         67          -          1
Wash.                   1          4         200        193         40         57           -          4          -          -
Oreg.                  15         12         422        654         27         41           -          -          -          -
Calif.                 92         79       2,179      2,329        500        652           -          1          -          -
Alaska                  -          -          26         15          2          5           4         62          -          -
Hawaii                  2          2          31         57          2          6           -          -          -          1

Guam                    -          -           2          2          -          -           U          -          U          -
P.R.                    -          3          31         14        118        106           -          1          -          -
V.I.                    -          -           -          -          -          1           U          -          U          -
Amer. Samoa             -          -           -          5          -          -           U          -          U          -
C.N.M.I.               10          -           1         12          5          5           U          -          U          -
------------------------------------------------------------------------------------------------------------------------------

 * Of 99 cases reported among children aged <5 years, serotype was reported for 23 and of those, 4 were type B.
** For imported measles, cases include only those resulting from importation from other countries.
N: Not notifiable    U: Unavailable     -: no reported cases
============================================================================================================================================

TABLE III. (page 2) Cases of selected notifiable diseases preventable by vaccination, United
States, weeks ending May 4, 1996, and May 6, 1995 (18th Week)

               Measles (Rubeola), cont'd.
               --------------------------
                           Total                      Mumps                           Pertussis                          Rubella
               --------------------------   --------------------------       ---------------------------       ---------------------------
Reporting Area       Cum.       Cum.                   Cum.       Cum.                   Cum.       Cum.                  Cum.        Cum.
                     1996       1995        1996       1996       1995       1996        1996       1995       1996       1996        1995
------------------------------------------------------------------------------------------------------------------------------------------
UNITED STATES          98        189          16        211        310         44         870        937          2         63          29

NEW ENGLAND             6          4           -          -          4          7         159        148          -          8           3
Maine                   -          -           -          -          2          -           8         17          -          -           -
N.H.                    -          -           U          -          -          U          17          8          U          -           1
Vt.                     1          -           -          -          -          -           6          3          -          1           -
Mass.                   4          2           -          -          1          7         125        114          -          5           2
R.I.                    -          2           -          -          -          -           -          -          -          -           -
Conn.                   1          -           -          -          1          -           3          6          -          2           -

MID. ATLANTIC           4          3           1         26         43          4          82         82          -          4           3
Upstate N.Y.            -          -           -          7         12          -          44         46          -          3           -
N.Y. City               3          -           -          4          6          -          13         14          -          1           2
N.J.                    -          3           -          -          7          -           -          6          -          -           1
Pa.                     1          -           1         15         18          4          25         16          -          -           -

E.N. CENTRAL            5          6           4         55         55          1         127        103          -          3           -
Ohio                    2          -           2         23         18          1          54         36          -          -           -
Ind.                    -          -           -          5          5          -          10          8          -          -           -
Ill.                    -          -           1         11         15          -          46         20          -          1           -
Mich.                   2          4           1         16         17          -          12         27          -          2           -
Wis.                    1          2           -          -          -          -           5         12          -          -           -

W.N. CENTRAL            5          1           -          2         20          3          37         59          -          1           -
Minn.                   5          -           -          -          2          3          30         22          -          -           -
Iowa                    -          -           -          -          3          -           2          1          -          1           -
Mo.                     -          1           -          -         12          -           1         12          -          -           -
N. Dak.                 -          -           -          2          -          -           -          5          -          -           -
S. Dak.                 -          -           -          -          -          -           1          6          -          -           -
Nebr.                   -          -           -          -          3          -           -          3          -          -           -
Kans.                   -          -           -          -          -          -           3         10          -          -           -

S. ATLANTIC             2          1           2         21         52         22          99         95          1         11           5
Del.                    1          -           -          -          -          -           7          5          -          -           -
Md.                     1          -           1          9         12          2          37          9          -          -           -
D.C.                    -          -           -          -          -          -           -          2          -          -           -
Va.                     -          -           -          3         12          2           5          7          -          -           -
W. Va.                  -          -           -          -          -          -           2          -          -          -           -
N.C.                    -          -           -          -         16         16          25         49          -          -           -
S.C.                    -          -           -          3          5          1           5         10          1          1           -
Ga.                     -          -           -          1          -          -           2          -          -          -           -
Fla.                    -          1           1          5          7          1          16         13          -         10           5

E.S. CENTRAL            -          -           -         10          9          -          17         24          -          2           -
Ky.                     -          -           -          -          -          -           5          1          -          -           -
Tenn.                   -          -           -          1          -          -           7          4          -          -           -
Ala.                    -          -           -          4          3          -           1         19          -          -           -
Miss.                   -          -           -          5          6          -           4          -          N          N           N

W.S. CENTRAL            1          2           1          9         20          1          18         47          -          1           2
Ark.                    -          2           -          -          5          -           2          6          -          -           -
La.                     -          -           1          8          6          1           3          1          -          1           -
Okla.                   -          -           -          -          -          -           4          7          -          -           -
Tex.                    1          -           -          1          9          -           9         33          -          -           2

MOUNTAIN                7         57           1         18         11          3         113        224          -          1           3
Mont.                   -          -           -          -          -          -           3          3          -          -           -
Idaho                   -          -           -          -          2          3          44         70          -          -           -
Wyo.                    -          -           -          -          -          -           -          -          -          -           -
Colo.                   2         17           1          1          -          -          17         32          -          -           -
N. Mex.                 -         29           N          N          N          -          25         20          -          -           -
Ariz.                   2         10           -          1          1          -           4         93          -          1           3
Utah                    -          -           -          1          1          -           3          5          -          -           -
Nev.                    3          1           -         15          7          -          17          1          -          -           -

PACIFIC                68        115           7         70         96          3         218        155          1         32          13
Wash.                   4         16           1          8          5          3          72         27          -          1           -
Oreg.                   -          1           N          N          N          -          23         11          -          -           1
Calif.                  1         97           3         47         78          -         115        109          1         29          11
Alaska                 62          -           -          2         12          -           -          -          -          -           -
Hawaii                  1          1           3         13          1          -           8          8          -          2           1

Guam                    -          -           U          2          3          U           -          -          U          -           -
P.R.                    1          3           -          1          1          -           -          5          -          -           -
V.I.                    -          -           U          -          1          U           -          -          U          -           -
Amer. Samoa             -          -           U          -          -          U           -          -          U          -           -
C.N.M.I.                -          -           U          -          -          U           -          -          U          -           -

------------------------------------------------------------------------------------------------------------------------------------------
N: Not notifiable    U: Unavailable     -: no reported cases

============================================================================================================================================

Return to top.

Table_IV
Note: To print large tables and graphs users may have to change their printer settings to landscape and use a small font size.

TABLE IV. Deaths in 121 U.S. cities* week ending
May 4, 1996 (18th Week)
===================================================================================================================================
                                                 All Causes, By Age (Years)
                          ------------------------------------------------------------------------        P&I**
Reporting Area            All Ages         >=65        45-64       25-44         1-24           <1        Total
---------------------------------------------------------------------------------------------------------------
NEW ENGLAND                    527          369           89          44           13           10           26
Boston, Mass.                  118           62           29          20            3            2            9
Bridgeport, Conn.               37           28            3           3            -            3            3
Cambridge, Mass.                21           18            3           -            -            -            1
Fall River, Mass.               29           24            5           -            -            -            -
Hartford, Conn.                 59           35           16           3            3            2            3
Lowell, Mass.                   24           15            7           -            2            -            -
Lynn, Mass.                     11            8            1           2            -            -            -
New Bedford, Mass.              19           15            3           1            -            -            1
New Haven, Conn.                34           26            1           4            -            3            -
Providence, R.I.                42           31            4           6            1            -            1
Somerville, Mass.                5            5            -           -            -            -            -
Springfield, Mass.              50           36           10           1            3            -            2
Waterbury, Conn.                18           14            3           -            1            -            1
Worcester, Mass.                60           52            4           4            -            -            5

MID. ATLANTIC                2,243        1,517          459         193           37           35          102
Albany, N.Y.                    52           39            6           4            -            3            1
Allentown, Pa.                  21           16            5           -            -            -            -
Buffalo, N.Y.                   84           67           10           5            2            -            3
Camden, N.J.                    35           21            8           4            1            1            2
Elizabeth, N.J.                 32           23            5           3            -            1            -
Erie, Pa.***                    52           42            4           1            3            2            5
Jersey City, N.J.               48           26           15           5            -            2            1
New York City, N.Y.          1,177          748          273         118           22           16           46
Newark, N.J.                    59           27           13          13            4            1            3
Paterson, N.J.                  19           16            1           2            -            -            2
Philadelphia, Pa.              300          222           54          19            1            4           14
Pittsburgh, Pa.***              50           33           13           2            -            2            8
Reading, Pa.                    23           17            6           -            -            -            1
Rochester, N.Y.                121           91           19           8            1            2            6
Schenectady, N.Y.               27           22            2           3            -            -            2
Scranton, Pa.***                29           24            2           2            1            -            -
Syracuse, N.Y.                  77           54           16           4            2            -            4
Trenton, N.J.                   17           12            4           -            -            1            4
Utica, N.Y.                     20           17            3           -            -            -            -
Yonkers, N.Y.                    U            U            U           U            U            U            U

E.N. CENTRAL                 2,093        1,360          425         188           56           63          133
Akron, Ohio                     55           41            7           3            2            2            -
Canton, Ohio                    28           23            2           2            -            1            5
Chicago, Ill.                  434          241          102          63           17           10           31
Cincinnati, Ohio               107           73           15          11            3            5            9
Cleveland, Ohio                177           92           47          23            5           10            1
Columbus, Ohio                 160          107           31          13            2            7           10
Dayton, Ohio                   124           98           18           5            2            1           12
Detroit, Mich.                 230          125           62          30            7            6           16
Evansville, Ind.                35           25            7           1            1            1            2
Fort Wayne, Ind.                72           50           19           3            -            -            7
Gary, Ind.                      20            7            4           5            3            1            -
Grand Rapids, Mich.             66           50           11           1            -            4            4
Indianapolis, Ind.             156          109           25          14            3            5           11
Madison, Wis.                   10            9            -           -            1            -            1
Milwaukee, Wis.                129           90           26           5            5            3            1
Peoria, Ill.                    41           29           10           -            -            2            5
Rockford, Ill.                  50           42            4           1            -            3            9
South Bend, Ind.                45           34            9           1            1            -            1
Toledo, Ohio                    90           74            8           4            3            1            7
Youngstown, Ohio                64           41           18           3            1            1            1

W.N. CENTRAL                   761          560          101          58           11           22           43
Des Moines, Iowa                 U            U            U           U            U            U            U
Duluth, Minn.                   20           16            4           -            -            -            -
Kansas City, Kans.              52           30           14           5            1            2            -
Kansas City, Mo.               126           88           15           7            1            6            4
Lincoln, Nebr.                  44           33            4           5            2            -            3
Minneapolis, Minn.             170          126           21          17            2            4           15
Omaha, Nebr.                    77           58           10           7            -            2            4
St. Louis, Mo.                 113           90            9           7            4            3            6
St. Paul, Minn.                 68           58            6           4            -            -            8
Wichita, Kans.                  91           61           18           6            1            5            3

S. ATLANTIC                  1,312          814          283         156           35           22           80
Atlanta, Ga.                   165           94           39          27            2            3            7
Baltimore, Md.                 255          141           59          39            8            8           28
Charlotte, N.C.                123           81           29          13            -            -           12
Jacksonville, Fla.             122           84           24          11            3            -            2
Miami, Fla.                    100           63           20          14            3            -            -
Norfolk, Va.                    65           38           13           8            2            4            3
Richmond, Va.                   76           51           16           5            3            1            4
Savannah, Ga.                   47           29           10           6            1            1            3
St. Petersburg, Fla.            71           58            7           3            2            1            3
Tampa, Fla.                    185          123           38          16            4            2           16
Washington, D.C.                88           42           25          14            5            2            2
Wilmington, Del.                15           10            3           -            2            -            -

E.S. CENTRAL                   819          558          167          62           19           13           68
Birmingham, Ala.               132           86           25          10            7            4            1
Chattanooga, Tenn.              74           50           14           7            -            3            7
Knoxville, Tenn.                85           54           25           6            -            -           12
Lexington, Ky.                  64           44           11           7            2            -            7
Memphis, Tenn.                 182          134           33          13            2            -           19
Mobile, Ala.                    88           58           23           4            3            -            7
Montgomery, Ala.                62           42           10           6            -            4            4
Nashville, Tenn.               132           90           26           9            5            2           11

W.S. CENTRAL                 1,508          980          293         135           50           50           98
Austin, Tex.                    70           40           18           8            -            4            7
Baton Rouge, La.                49           38            8           2            1            -            2
Corpus Christi, Tex.            52           37           11           3            -            1            4
Dallas, Tex.                   246          164           38          26            8           10            9
El Paso, Tex.                   97           67           20           6            3            1           10
Ft. Worth, Tex.                 95           60           20          13            1            1            1
Houston, Tex.                  326          201           73          37           10            5           32
Little Rock, Ark.               91           55           11           4            5           16            6
New Orleans, La.               121           74           31           9            5            2            -
San Antonio, Tex.              205          138           32          19           10            6           15
Shreveport, La.                 44           29            8           4            2            1            2
Tulsa, Okla.                   112           77           23           4            5            3           10

MOUNTAIN                       924          630          170          77           25           21           70
Albuquerque, N.M.               98           68           18           7            5            -           10
Colo. Springs, Colo.            55           43            7           5            -            -            3
Denver, Colo.                  114           73           20          14            2            5           12
Las Vegas, Nev.                188          125           46          10            3            4           12
Ogden, Utah                     27           20            6           -            1            -            2
Phoenix, Ariz.                 176          109           31          20            9            6            4
Pueblo, Colo.                   25           21            2           -            1            1            5
Salt Lake City, Utah            95           64           21           7            -            3            9
Tucson, Ariz.                  146          107           19          14            4            2           13

PACIFIC                      1,890        1,325          326         169           38           31          148
Berkeley, Calif.                19           17            1           1            -            -            3
Fresno, Calif.                  79           61            8           7            1            2            7
Glendale, Calif.                37           29            6           1            1            -            2
Honolulu, Hawaii                90           65           16           5            2            1           11
Long Beach, Calif.              93           66           18           5            4            -           10
Los Angeles, Calif.            629          440          113          56            9           11           25
Pasadena, Calif.                47           32            6           7            -            2            1
Portland, Oreg.                102           77           10          12            2            1            8
Sacramento, Calif.               U            U            U           U            U            U            U
San Diego, Calif.              159          104           29          18            5            3           24
San Francisco, Calif.          158          104           30          21            2            1           12
San Jose, Calif.               173          123           28          14            4            4           22
Santa Cruz, Calif.              30           23            6           -            -            1            4
Seattle, Wash.                 140           93           27          11            5            4            3
Spokane, Wash.                  54           37           11           4            1            1            7
Tacoma, Wash.                   80           54           17           7            2            -            9

TOTAL                   12,077****        8,113        2,313       1,082          284          267          768

---------------------------------------------------------------------------------------------------------------
   * Mortality data in this table are voluntarily reported from 121 cities in the United States, most of which have populations
     of 100,000 or more. A death is reported by the place of its occurrence and by the week that the death certificate was
     filed. Fetal deaths are not included.
  ** Pneumonia and influenza.
 *** Because of changes in reporting methods in these 3 Pennsylvania cities, these numbers are partial counts for the current
     week. Complete counts will be available in 4 to 6 weeks.
**** Total includes unknown ages.

U: Unavailable    -: no reported cases
===================================================================================================================================

Return to top.

Figure_Ie

Figure_Ie
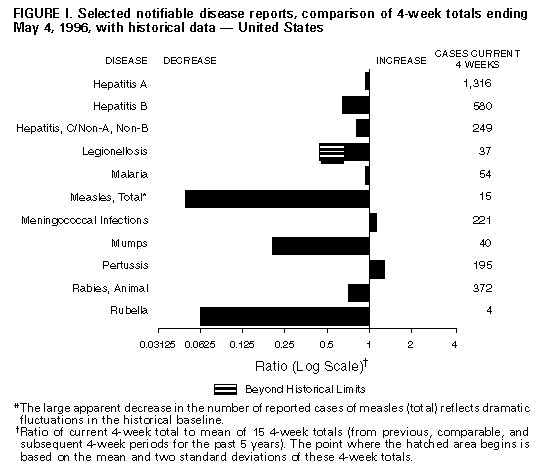
Return to top.

Disclaimer   All MMWR HTML versions of articles are electronic conversions from ASCII text into HTML. This conversion may have resulted in character translation or format errors in the HTML version. Users should not rely on this HTML document, but are referred to the electronic PDF version and/or the original MMWR paper copy for the official text, figures, and tables. An original paper copy of this issue can be obtained from the Superintendent of Documents, U.S. Government Printing Office (GPO), Washington, DC 20402-9371; telephone: (202) 512-1800. Contact GPO for current prices.

**Questions or messages regarding errors in formatting should be addressed to mmwrq@cdc.gov.

Page converted: 09/19/98

HOME  |  ABOUT MMWR  |  MMWR SEARCH  |  DOWNLOADS  |  RSSCONTACT
POLICY  |  DISCLAIMER  |  ACCESSIBILITY

Safer, Healthier People

Morbidity and Mortality Weekly Report
Centers for Disease Control and Prevention
1600 Clifton Rd, MailStop E-90, Atlanta, GA 30333, U.S.A

USA.GovDHHS

Department of Health
and Human Services

This page last reviewed 5/2/01