 |
|
|
|
|
|
|
| ||||||||||
|
|
|
|
|
|
|
||||
| ||||||||||
|
|
|
|
|
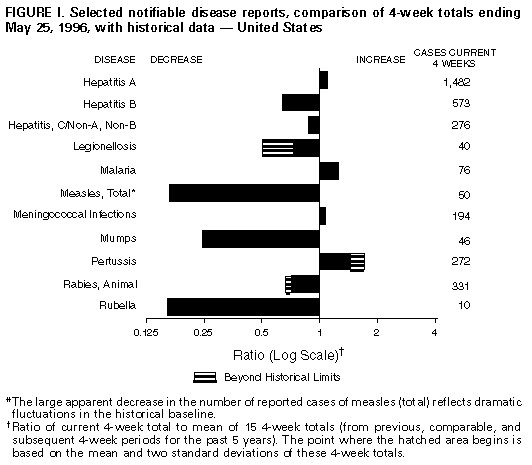
Persons using assistive technology might not be able to fully access information in this file. For assistance, please send e-mail to: mmwrq@cdc.gov. Type 508 Accommodation and the title of the report in the subject line of e-mail. Notifiable Diseases/Deaths in Selected Cities Weekly InformationFigure_I Selected notifiable disease reports, comparison of 4-week totals ending May 25, 1996, with historical data -- United States Table_I Summary -- cases of selected notifiable diseases, United States, cumulative, week ending May 25, 1996 (21st Week) Table_II Cases of selected notifiable diseases, United States, weeks ending May 25, 1996 and May 27, 1995 (21st Week) Table_III Cases of selected notifiable diseases preventable by vaccination, United States, weeks ending May 25, 1996 and May 27, 1995 (21st Week) Table_IV Deaths in 121 U.S. cities, week ending
May 25, 1996 (21st Week)
TABLE I. Summary -- cases of specified notifiable diseases, United States,
cumulative, week ending May 25, 1996 (21st Week)
============================================================================
                                             Cum. 1996
------------------------------------------------------
Anthrax                                              -
Brucellosis                                         31
Cholera                                              1
Congenital rubella syndrome                          1
Cryptosporidiosis*                                 591
Diphtheria                                           1
Encephalitis:  California*                           -
               eastern equine*                       1
               St. Louis*                            -
               western equine*                       -
Hansen Disease                                      36
Hantavirus pulmonary syndrome*+                      5
HIV infection, pediatric*&                          92
Plague                                               -
Poliomyelitis, paralytic@                            -
Psittacosis                                         10
Rabies, human                                        -
Rocky Mountain spotted fever (RMSF)                 72
Streptococcal toxic-shock syndrome*                 10
Syphilis, congenital**                               -
Tetanus                                              5
Toxic-shock syndrome                                57
Trichinosis                                         11
Typhoid fever                                      126
------------------------------------------------------
 * Not notifiable in all states
 + Updated weekly from reports to the Division of Viral and Rickettsial
   Diseases, National Center for Infectious Diseases (NCID).
 & Updated monthly to the Division of HIV/AIDS Prevention, National
   Center for HIV, STD, and TB Prevention (NCHSTP) (proposed), last update
   April 30, 1996.
 @ One suspected case of polio with onset in 1996 has been reported to date.
** Updated quarterly from reports to the Division of STD Prevention,
   NCHSTP. First quarter 1996 is not yet available.
-: no reported cases
============================================================================
Return to top. Table_II Note: To print large tables and graphs users may have to change their printer settings to landscape and use a small font size.
TABLE II. (page 1) Cases of selected notifiable diseases, United States, weeks ending
May 25, 1996, and May 27, 1995 (21st Week)
Escherichia
coli O157:H7
------------------- Hepatitis
AIDS* Chlamydia NETSS** PHLIS*** Gonorrhea C\NA,NB Legionellosis
----------------- --------- -------- -------- ------------------- ---------------- -----------------
Reporting Area Cum. Cum. Cum. Cum. Cum. Cum. Cum. Cum. Cum. Cum. Cum.
1996 1995 1996 1996 1996 1996 1995 1996 1995 1996 1995
------------------------------------------------------------------------------------------------------------------------------------------
UNITED STATES 21,920 29,206 102,017 339 155 104,407 153,956 1,447 1,617 282 489
NEW ENGLAND 878 1,443 3,846 31 17 3,001 2,054 50 54 15 6
Maine 15 23 - 3 - 18 30 - - 1 1
N.H. 25 47 299 1 2 60 43 3 7 - -
Vt. 8 13 - 5 5 25 17 20 5 2 -
Mass. 490 638 2,700 12 10 884 1,186 24 41 6 4
R.I. 61 120 847 3 - 214 210 3 1 6 1
Conn. 279 602 - 7 - 1,800 568 - - N N
MID. ATLANTIC 5,707 7,415 15,375 34 23 12,205 16,914 143 145 60 62
Upstate N.Y. 568 828 N 23 12 2,415 3,547 122 68 14 17
N.Y. City 3,281 3,945 5,969 - - 3,467 6,532 1 1 - 1
N.J. 1,143 1,661 1,892 11 5 2,192 1,310 - 66 7 14
Pa. 715 981 7,514 N 6 4,131 5,525 20 10 39 30
E.N. CENTRAL 1,874 2,464 14,891 82 40 16,063 31,753 175 136 85 164
Ohio 438 536 3,636 32 8 2,094 10,285 4 5 39 76
Ind. 309 197 4,116 15 6 2,878 3,243 6 - 21 38
Ill. 758 1,102 - 19 12 6,760 8,202 22 45 2 17
Mich. 257 493 4,101 16 14 2,911 7,372 143 86 19 15
Wis. 112 136 3,038 N - 1,420 2,651 - - 4 18
W.N. CENTRAL 548 675 10,086 62 27 4,824 8,193 94 29 20 32
Minn. 109 149 - 17 13 U 1,198 - 2 1 -
Iowa 44 40 1,609 10 6 444 581 73 3 4 11
Mo. 237 277 5,324 10 - 3,201 4,761 14 10 4 8
N. Dak. 4 1 2 1 1 1 11 - 3 - 2
S. Dak. 7 7 575 2 - 81 84 - 1 2 -
Nebr. 40 52 762 6 2 153 402 2 7 7 9
Kans. 107 149 1,814 16 5 944 1,156 5 3 2 2
S. ATLANTIC 5,803 7,481 20,435 21 4 39,351 44,067 101 111 42 77
Del. 114 153 - - - 588 809 1 - - -
Md. 658 1,119 2,519 N 1 5,176 5,187 - 3 6 14
D.C. 373 461 N - - 1,737 1,913 - - 1 3
Va. 317 547 4,790 N 1 3,892 4,411 7 4 10 5
W. Va. 31 35 - N - 181 223 6 21 1 3
N.C. 266 404 - 6 2 7,785 9,973 19 26 3 14
S.C. 283 400 - 1 - 4,578 4,748 14 8 3 14
Ga. 871 936 4,632 4 - 8,722 8,374 - 11 - 9
Fla. 2,890 3,426 8,494 10 - 6,692 8,429 54 38 18 15
E.S. CENTRAL 776 958 11,448 10 5 11,490 17,011 292 536 22 14
Ky. 120 118 2,755 - 1 1,685 1,844 11 15 3 4
Tenn. 283 379 5,158 5 4 4,415 5,339 248 519 10 6
Ala. 244 261 3,535 2 - 5,390 6,652 1 2 - 3
Miss. 129 200 U 3 - U 3,176 32 - 9 1
W.S. CENTRAL 2,096 2,490 4,963 12 4 7,460 18,322 167 89 2 10
Ark. 97 108 - 6 2 1,205 1,916 1 2 - 4
La. 559 360 2,574 4 2 2,926 4,776 69 54 - 2
Okla. 55 130 2,389 1 - 1,501 10 59 21 2 3
Tex. 1,385 1,892 - 1 - 1,828 11,620 38 12 - 1
MOUNTAIN 648 975 3,421 37 16 2,755 3,629 262 197 14 56
Mont. 8 8 - 4 - 13 35 9 8 1 2
Idaho 10 24 642 11 4 36 53 67 25 - 1
Wyo. 2 5 289 - - 12 20 87 79 2 4
Colo. 181 340 - 13 5 698 1,193 23 30 6 24
N. Mex. 43 81 - 2 - 358 420 33 28 - 4
Ariz. 197 267 1,420 N 7 1,366 1,343 27 13 3 5
Utah 79 58 254 5 - 49 - 11 7 1 3
Nev. 128 192 816 2 - 223 565 5 7 1 13
PACIFIC 3,590 5,305 17,552 50 19 7,258 12,013 163 320 22 68
Wash. 313 457 4,095 11 5 941 992 26 80 1 5
Oreg. 189 173 - 12 10 201 202 3 24 - -
Calif. 3,025 4,509 12,664 26 - 5,794 10,242 57 206 21 58
Alaska 10 45 363 1 - 200 313 2 1 - -
Hawaii 53 121 430 N 4 122 264 75 9 - 5
Guam 3 - 102 N - 24 44 1 - - 1
P.R. 423 1,084 N 5 U 121 235 17 61 - -
V.I. 6 19 N - U - 16 - - - -
Amer. Samoa - - - - U - 8 - - - -
C.N.M.I. - - N - U 11 12 - - - -
------------------------------------------------------------------------------------------------------------------------------------------
N: Not notifiable U: Unavailable -: no reported cases C.N.M.I.: Commonwealth of North Mariana Islands
* Updated monthly to the Division of HIV/AIDS Prevention, National Center for HIV, STD, and TB Prevention (proposed), last update
April 30, 1996.
** National Electronic Telecommunications System for Surveillance.
*** Public Health Laboratory Information System.
=======================================================================================================================================================
TABLE II. (page 2) Cases of selected notifiable diseases, United States, weeks ending
May 25, 1996, and May 27, 1995 (21st Week)
Meningococcal Syphilis
Lyme Malaria Disease (Primary & Secondary) Tuberculosis Rabies, Animal
---------------- ---------------- ---------------- --------------------- ----------------- ----------------
Reporting Area Cum. Cum. Cum. Cum. Cum. Cum. Cum. Cum. Cum. Cum. Cum. Cum.
1996 1995 1996 1995 1996 1995 1996 1995 1996 1995 1996 1995
-----------------------------------------------------------------------------------------------------------------------------------------------------
UNITED STATES 1,334 1,955 406 402 1,547 1,497 3,893 6,869 6,162 6,801 2,023 2,678
NEW ENGLAND 58 179 13 16 53 69 65 89 144 160 240 704
Maine 2 2 3 1 9 5 - 2 4 - - -
N.H. 2 11 1 1 1 14 1 1 4 5 33 83
Vt. - 2 1 - 3 6 - - - 1 66 98
Mass. 28 16 5 4 20 22 31 35 59 89 42 258
R.I. 21 36 3 2 - - - 1 20 17 21 107
Conn. 5 112 - 8 20 22 33 50 57 48 78 158
MID. ATLANTIC 1,106 1,440 96 101 121 181 177 385 1,093 1,438 294 605
Upstate N.Y. 593 767 27 21 38 53 25 34 123 159 156 232
N.Y. City 157 140 42 48 21 23 61 206 579 789 - -
N.J. 77 157 22 22 30 48 46 73 255 265 58 150
Pa. 279 376 5 10 32 57 45 72 136 225 80 223
E.N. CENTRAL 19 68 35 53 204 225 645 1,115 695 586 16 6
Ohio 15 5 6 2 78 59 228 396 110 105 3 1
Ind. 4 7 5 4 33 33 98 104 77 48 1 -
Ill. - 3 7 36 46 62 212 415 434 411 1 2
Mich. - 1 11 6 26 42 41 120 39 - 6 2
Wis. U 52 6 5 21 29 66 80 35 22 5 1
W.N. CENTRAL 43 31 11 10 126 87 172 337 175 238 191 136
Minn. 1 - 3 3 15 16 27 18 35 53 12 8
Iowa 16 1 1 1 27 16 10 25 23 33 99 43
Mo. 7 14 5 4 56 33 126 278 76 90 12 14
N. Dak. - - - - 2 - - - 2 1 19 15
S. Dak. - - - - 3 4 - - 13 10 37 32
Nebr. - 1 - 2 10 7 5 7 7 10 3 -
Kans. 19 15 2 - 13 11 4 9 19 41 9 24
S. ATLANTIC 52 158 96 83 330 238 1,421 1,745 1,031 1,105 1,015 872
Del. 1 19 2 1 2 2 16 7 20 20 26 44
Md. 25 94 21 21 29 17 252 167 110 174 246 171
D.C. 1 1 3 8 5 2 68 51 54 42 2 7
Va. - 11 8 16 27 28 199 281 82 105 229 159
W. Va. 3 12 1 1 8 4 1 1 23 42 38 41
N.C. 12 11 8 6 36 41 440 486 158 117 268 167
S.C. 2 5 3 - 34 31 186 276 40 123 22 53
Ga. - 4 8 10 81 52 117 306 240 10 118 127
Fla. 8 1 42 20 108 61 142 170 304 472 66 103
E.S. CENTRAL 20 12 11 9 96 90 734 1,629 452 541 71 112
Ky. 4 2 1 - 17 22 60 89 102 122 17 8
Tenn. 6 7 5 4 9 28 439 335 74 183 28 46
Ala. 1 1 2 5 36 23 235 249 181 160 26 56
Miss. 9 2 3 - 34 17 U 956 95 76 - 2
W.S. CENTRAL 7 33 11 5 181 183 486 1,208 682 794 25 48
Ark. 4 2 - 1 25 21 134 188 30 90 3 22
La. - - 1 1 36 25 215 440 - 12 12 9
Okla. 2 14 - - 14 19 63 - 30 - 10 17
Tex. 1 17 10 3 106 118 74 580 622 692 - -
MOUNTAIN - 2 25 26 93 116 46 106 210 265 37 48
Mont. - - 2 2 3 2 - 3 7 3 5 17
Idaho - - - 1 11 5 1 - 4 6 - -
Wyo. - 1 2 - 3 5 1 - 3 1 13 17
Colo. - - 13 15 15 27 16 63 32 5 2 -
N. Mex. - - 1 3 18 24 - 4 35 40 1 2
Ariz. - - 3 2 26 41 25 17 87 115 14 10
Utah - - 3 2 9 5 - - 10 10 - 1
Nev. - 1 1 1 8 7 3 19 32 85 2 1
PACIFIC 29 32 108 99 343 308 147 255 1,680 1,674 134 147
Wash. 1 1 7 8 48 49 2 7 95 104 - -
Oreg. 7 1 8 6 65 55 4 6 43 23 - -
Calif. 20 30 88 77 224 197 141 241 1,454 1,444 126 141
Alaska - - 1 1 4 5 - 1 24 31 8 6
Hawaii 1 - 4 7 2 2 - - 64 72 - -
Guam - - - - 1 3 2 2 35 33 - -
P.R. - - - - 3 13 58 133 58 86 18 28
V.I. - - - - - - - 1 - - - -
Amer. Samoa - - - - - - - - - 2 - -
C.N.M.I. - - - - - - 1 3 - 13 - -
-----------------------------------------------------------------------------------------------------------------------------------------------------
N: Not notifiable U: Unavailable -: no reported cases
=======================================================================================================================================================
Return to top. Table_III Note: To print large tables and graphs users may have to change their printer settings to landscape and use a small font size.
TABLE III. (page 1) Cases of selected notifiable diseases preventable by vaccination, United
States, weeks ending May 25, 1996, and May 27, 1995 (21st Week)
Hepatitis (Viral), by type Measles (Rubeola)
H. influenzae, --------------------------------------- -------------------------------------
invasive A B Indigenous Imported**
---------------- ----------------- ----------------- --------------- ---------------
Reporting Area Cum. Cum. Cum. Cum. Cum. Cum. Cum. Cum.
1996* 1995 1996 1995 1996 1995 1996 1996 1996 1996
------------------------------------------------------------------------------------------------------------------------------
UNITED STATES 533 564 10228 10,384 3,531 3,940 25 136 1 15
NEW ENGLAND 12 29 127 85 59 89 - 5 - 1
Maine 2 1 10 13 2 2 - - - -
N.H. 7 7 4 5 4 12 - - - -
Vt. - 1 3 3 2 1 - 1 - -
Mass. 3 7 64 33 19 30 - 3 - 1
R.I. - - 4 11 5 8 - - - -
Conn. - 13 42 20 27 36 - 1 - -
MID. ATLANTIC 77 64 636 646 522 526 - 4 - 4
Upstate N.Y. 24 19 163 146 136 135 - - - -
N.Y. City 10 14 278 306 249 179 - 4 - 3
N.J. 26 9 121 92 88 134 U - U -
Pa. 17 22 74 102 49 78 - - - 1
E.N. CENTRAL 74 101 879 1,426 376 471 - 4 - 3
Ohio 49 50 408 825 51 48 - 2 - -
Ind. 3 14 138 61 66 99 - - - -
Ill. 14 25 134 276 61 127 - 1 - 1
Mich. 3 11 142 159 174 166 - - - 2
Wis. 5 1 57 105 24 31 - 1 - -
W.N. CENTRAL 23 32 793 626 214 258 9 15 - 1
Minn. 10 14 37 64 13 20 9 13 - 1
Iowa 6 2 184 35 69 18 - - - -
Mo. 5 13 366 446 105 187 - 2 - -
N. Dak. - - 22 12 - 2 - - - -
S. Dak. 1 - 34 12 - 1 - - - -
Nebr. 1 1 92 13 8 14 - - - -
Kans. - 2 58 44 19 16 - - - -
S. ATLANTIC 130 146 433 458 524 533 1 3 - -
Del. 1 - 5 7 1 3 - 1 - -
Md. 31 40 88 82 126 117 1 2 - -
D.C. 4 - 15 4 15 10 - - - -
Va. 4 16 62 79 62 37 - - - -
W. Va. 4 6 10 10 11 29 - - - -
N.C. 14 20 49 51 129 116 - - - -
S.C. 3 - 29 15 38 21 - - - -
Ga. 60 31 13 43 7 49 U - U -
Fla. 9 33 162 167 135 151 - - - -
E.S. CENTRAL 9 4 759 523 332 424 - - - -
Ky. 2 1 15 28 26 43 - - - -
Tenn. 1 - 530 415 206 329 - - - -
Ala. 5 3 94 47 22 52 - - - -
Miss. 1 - 120 33 78 - - - - -
W.S. CENTRAL 21 30 1,795 1,085 358 409 - - - 2
Ark. - 4 242 94 34 19 - - - -
La. 1 1 55 35 47 71 - - - -
Okla. 19 16 757 233 41 50 - - - -
Tex. 1 9 741 723 236 269 - - - 2
MOUNTAIN 60 52 1,488 1,736 437 331 3 14 - 1
Mont. - - 53 27 4 9 - - - -
Idaho 1 2 122 175 54 39 - 1 - -
Wyo. 30 2 18 63 14 9 - - - -
Colo. 5 8 159 212 57 54 - 3 - 1
N. Mex. 7 7 207 343 147 139 - - - -
Ariz. 9 17 473 488 93 41 - 3 - -
Utah 6 5 376 374 54 27 3 3 - -
Nev. 2 11 80 54 14 13 - 4 - -
PACIFIC 127 106 3,318 3,799 709 899 12 91 1 3
Wash. 1 4 220 228 46 62 12 26 - -
Oreg. 18 14 471 819 34 50 - 1 - -
Calif. 105 86 2,562 2,664 625 774 - 1 1 2
Alaska 1 - 28 15 2 6 - 63 - -
Hawaii 2 2 37 73 2 7 U - U 1
Guam - - 2 2 - - U - U -
P.R. 1 3 36 24 150 138 - 1 - -
V.I. - - - - - 2 U - U -
Amer. Samoa - - - 5 - - U - U -
C.N.M.I. 10 3 1 14 5 6 U - U -
------------------------------------------------------------------------------------------------------------------------------
* Of 111 cases reported among children aged <5 years, serotype was reported for 26 and of those, 5 were type B.
** For imported measles, cases include only those resulting from importation from other countries.
N: Not notifiable U: Unavailable -: no reported cases
============================================================================================================================================
TABLE III. (page 2) Cases of selected notifiable diseases preventable by vaccination, United
States, weeks ending May 25, 1996, and May 27, 1995 (21st Week)
Measles (Rubeola), cont'd.
--------------------------
Total Mumps Pertussis Rubella
-------------------------- -------------------------- --------------------------- ---------------------------
Reporting Area Cum. Cum. Cum. Cum. Cum. Cum. Cum. Cum.
1996 1995 1996 1996 1995 1996 1996 1995 1996 1996 1995
------------------------------------------------------------------------------------------------------------------------------------------
UNITED STATES 151 196 6 256 395 75 1,162 1,069 3 71 39
NEW ENGLAND 6 4 - - 4 8 185 160 - 8 6
Maine - - - - 2 - 8 18 - - -
N.H. - - - - - - 17 13 - - 1
Vt. 1 - - - - - 7 5 - 2 -
Mass. 4 2 - - 1 8 150 117 - 4 2
R.I. - 2 - - - - - - - - -
Conn. 1 - - - 1 - 3 7 - 2 3
MID. ATLANTIC 8 3 1 33 58 4 92 99 - 4 4
Upstate N.Y. - - - 9 15 4 53 59 - 3 -
N.Y. City 7 - 1 9 7 - 14 15 - 1 3
N.J. - 3 U - 8 U - 6 U - 1
Pa. 1 - - 15 28 - 25 19 - - -
E.N. CENTRAL 7 7 1 65 64 12 146 116 - 3 -
Ohio 2 1 - 26 20 10 66 37 - - -
Ind. - - - 5 5 - 12 9 - - -
Ill. 2 - - 15 19 2 51 26 - 1 -
Mich. 2 4 1 19 20 - 12 32 - 2 -
Wis. 1 2 - - - - 5 12 - - -
W.N. CENTRAL 16 1 - 3 25 3 56 70 - 1 -
Minn. 14 - - 1 2 3 38 27 - - -
Iowa - - - - 6 - 2 1 - 1 -
Mo. 2 1 - - 14 - 10 17 - - -
N. Dak. - - - 2 - - - 5 - - -
S. Dak. - - - - - - 1 7 - - -
Nebr. - - - - 3 - 1 3 - - -
Kans. - - - - - - 4 10 - - -
S. ATLANTIC 3 1 1 29 60 3 122 100 - 12 6
Del. 1 - - - - - 8 5 - - -
Md. 2 - - 12 17 3 50 12 - - -
D.C. - - - - - - - 2 - 1 -
Va. - - - 3 13 - 5 7 - - -
W. Va. - - - - - - 2 - - - -
N.C. - - - - 16 - 25 50 - - -
S.C. - - 1 5 6 - 5 10 - 1 -
Ga. - - U 2 - U 6 - U - -
Fla. - 1 - 7 8 - 21 14 - 10 6
E.S. CENTRAL - - 1 12 11 1 38 29 - - -
Ky. - - - - - - 23 5 - - -
Tenn. - - - 1 - - 9 4 - - -
Ala. - - - 4 4 1 3 20 - - -
Miss. - - 1 7 7 - 3 - N N N
W.S. CENTRAL 2 2 1 12 26 3 24 58 - 2 2
Ark. - 2 - - 5 - 2 7 - - -
La. - - 1 9 6 1 4 3 - 1 -
Okla. - - - - - - 4 9 - - -
Tex. 2 - - 3 15 2 14 39 - 1 2
MOUNTAIN 15 61 - 19 15 6 148 255 1 3 4
Mont. - - - - 1 - 4 3 - - -
Idaho 1 - - - 2 - 65 71 - - -
Wyo. - - - - - - - - - - -
Colo. 4 21 - 1 - 1 19 35 1 1 -
N. Mex. - 29 N N N 1 27 28 - - -
Ariz. 3 10 - 1 2 1 10 106 - 1 3
Utah 3 - - 2 3 3 6 10 - - 1
Nev. 4 1 - 15 7 - 17 2 - 1 -
PACIFIC 94 117 1 83 132 35 351 182 2 38 17
Wash. 26 16 - 8 10 16 136 30 - 1 -
Oreg. 1 1 N N N 2 27 13 1 1 1
Calif. 3 98 1 59 108 17 179 124 1 34 14
Alaska 63 - - 2 12 - - - - - -
Hawaii 1 2 U 14 2 U 9 15 U 2 2
Guam - - U 3 3 U - - U - -
P.R. 1 7 - 1 1 - - 8 - - -
V.I. - - U - 2 U - - U - -
Amer. Samoa - - U - - U - - U - -
C.N.M.I. - - U - - U - - U - -
------------------------------------------------------------------------------------------------------------------------------------------
N: Not notifiable U: Unavailable -: no reported cases
============================================================================================================================================
Return to top. Table_IV Note: To print large tables and graphs users may have to change their printer settings to landscape and use a small font size.
TABLE IV. Deaths in 121 U.S. cities* week ending
May 25, 1996 (21st Week)
===================================================================================================================================
All Causes, By Age (Years)
------------------------------------------------------------------------ P&I**
Reporting Area All Ages >=65 45-64 25-44 1-24 <1 Total
---------------------------------------------------------------------------------------------------------------
NEW ENGLAND 561 367 109 58 16 11 28
Boston, Mass. 185 95 47 27 9 7 12
Bridgeport, Conn. 43 31 6 6 - - -
Cambridge, Mass. 15 12 1 2 - - -
Fall River, Mass. 17 15 1 1 - - -
Hartford, Conn. 55 38 13 1 2 1 2
Lowell, Mass. 19 16 1 2 - - -
Lynn, Mass. 11 7 3 1 - - 1
New Bedford, Mass. 21 19 1 1 - - 2
New Haven, Conn. 32 18 8 6 - - 1
Providence, R.I. 41 36 3 1 - 1 2
Somerville, Mass. 5 2 2 1 - - -
Springfield, Mass. 44 26 11 2 3 2 3
Waterbury, Conn. 26 19 4 2 1 - 1
Worcester, Mass. 47 33 8 5 1 - 4
MID. ATLANTIC 2,419 1,583 505 242 40 49 100
Albany, N.Y. 60 42 8 6 1 3 5
Allentown, Pa. 12 10 2 - - - -
Buffalo, N.Y. 84 51 27 5 1 - 2
Camden, N.J. 31 17 8 2 1 3 2
Elizabeth, N.J. 24 18 5 1 - - -
Erie, Pa.*** 44 33 7 2 - 2 3
Jersey City, N.J. 45 31 6 5 1 2 -
New York City, N.Y. 1,299 814 289 156 20 20 30
Newark, N.J. 63 25 11 19 5 3 2
Paterson, N.J. 31 20 5 3 2 1 3
Philadelphia, Pa. 300 212 54 23 4 7 15
Pittsburgh, Pa.*** 78 56 17 2 2 1 6
Reading, Pa. 19 18 1 - - - 3
Rochester, N.Y. 132 101 21 7 1 2 12
Schenectady, N.Y. 24 15 7 2 - - 2
Scranton, Pa.*** 23 18 5 - - - 1
Syracuse, N.Y. 94 65 20 3 2 4 10
Trenton, N.J. 31 17 9 4 - 1 4
Utica, N.Y. 25 20 3 2 - - -
Yonkers, N.Y. U U U U U U U
E.N. CENTRAL 2,192 1,467 423 186 51 61 160
Akron, Ohio 58 44 7 4 1 2 -
Canton, Ohio 46 34 9 3 - - 5
Chicago, Ill. 432 245 102 59 9 13 48
Cincinnati, Ohio 156 105 29 11 6 5 15
Cleveland, Ohio 147 87 37 16 6 1 6
Columbus, Ohio 172 118 35 15 - 4 8
Dayton, Ohio 117 80 21 13 1 2 5
Detroit, Mich. 224 147 46 11 11 9 8
Evansville, Ind. 54 45 5 3 - 1 -
Fort Wayne, Ind. 52 44 5 1 1 1 6
Gary, Ind. 22 15 3 4 - - -
Grand Rapids, Mich. 57 43 9 1 - 4 4
Indianapolis, Ind. 219 135 40 25 11 8 19
Madison, Wis. U U U U U U U
Milwaukee, Wis. 109 75 23 9 - 2 10
Peoria, Ill. 55 45 5 1 - 4 2
Rockford, Ill. 58 42 12 1 1 2 9
South Bend, Ind. 59 49 6 - 3 1 5
Toledo, Ohio 99 71 20 6 - 2 10
Youngstown, Ohio 56 43 9 3 1 - -
W.N. CENTRAL 663 476 120 40 13 5 41
Des Moines, Iowa 32 22 7 3 - - 1
Duluth, Minn. 24 20 2 2 - - 1
Kansas City, Kans. 22 12 5 4 - 1 -
Kansas City, Mo. 77 44 15 7 2 - 4
Lincoln, Nebr. U U U U U U U
Minneapolis, Minn. 187 145 29 8 5 - 19
Omaha, Nebr. 84 61 16 3 2 2 10
St. Louis, Mo. 116 80 22 9 3 2 -
St. Paul, Minn. 45 38 7 - - - 3
Wichita, Kans. 76 54 17 4 1 - 3
S. ATLANTIC 1,197 758 239 139 37 24 60
Atlanta, Ga. 171 107 37 17 7 3 3
Baltimore, Md. 220 119 54 39 4 4 19
Charlotte, N.C. U U U U U U U
Jacksonville, Fla. 130 82 26 17 2 3 5
Miami, Fla. 96 59 15 16 4 2 1
Norfolk, Va. 64 38 11 4 3 8 5
Richmond, Va. 62 40 14 7 1 - 1
Savannah, Ga. 63 40 13 7 2 1 6
St. Petersburg, Fla. 65 55 5 3 2 - 1
Tampa, Fla. 174 128 31 12 1 2 15
Washington, D.C. 132 80 28 15 8 1 4
Wilmington, Del. 20 10 5 2 3 - -
E.S. CENTRAL 797 537 153 68 20 16 44
Birmingham, Ala. 130 73 36 11 5 3 1
Chattanooga, Tenn. 101 80 10 9 1 1 7
Knoxville, Tenn. 77 49 22 6 - - 5
Lexington, Ky. 52 37 6 4 4 1 -
Memphis, Tenn. 190 131 31 18 5 5 19
Mobile, Ala. 84 62 16 4 1 1 3
Montgomery, Ala. 37 27 8 1 - 1 1
Nashville, Tenn. 126 78 24 15 4 4 8
W.S. CENTRAL 1,441 914 300 141 47 39 79
Austin, Tex. 65 45 10 6 3 1 1
Baton Rouge, La. 65 38 13 7 3 4 2
Corpus Christi, Tex. 40 28 11 - - 1 2
Dallas, Tex. 219 132 41 31 8 7 3
El Paso, Tex. 87 56 14 11 5 1 4
Ft. Worth, Tex. 88 53 13 10 5 7 2
Houston, Tex. 390 239 94 38 8 11 37
Little Rock, Ark. 77 52 15 4 4 2 4
New Orleans, La. 94 59 20 11 4 - -
San Antonio, Tex. 177 110 46 15 2 4 16
Shreveport, La. 56 43 8 3 2 - 3
Tulsa, Okla. 83 59 15 5 3 1 5
MOUNTAIN 919 620 174 68 28 28 51
Albuquerque, N.M. 107 83 15 4 4 1 3
Colo. Springs, Colo. 49 30 12 4 2 1 2
Denver, Colo. 81 52 13 9 2 5 7
Las Vegas, Nev. 211 146 42 18 4 1 7
Ogden, Utah 19 9 7 - 1 2 2
Phoenix, Ariz. 176 100 39 16 8 12 16
Pueblo, Colo. 26 17 8 1 - - -
Salt Lake City, Utah 111 76 19 8 5 3 8
Tucson, Ariz. 139 107 19 8 2 3 6
PACIFIC 2,057 1,411 360 190 48 47 137
Berkeley, Calif. 14 7 5 2 - - -
Fresno, Calif. 104 76 10 6 7 5 10
Glendale, Calif. 38 28 3 5 1 1 5
Honolulu, Hawaii 90 61 16 8 3 2 5
Long Beach, Calif. 82 60 11 8 1 2 15
Los Angeles, Calif. 786 533 145 76 18 14 29
Pasadena, Calif. 19 9 5 1 2 2 1
Portland, Oreg. 142 103 21 9 4 5 7
Sacramento, Calif. U U U U U U U
San Diego, Calif. 128 84 23 17 - 4 21
San Francisco, Calif. 136 81 28 23 1 2 14
San Jose, Calif. 197 142 35 14 4 2 16
Santa Cruz, Calif. 29 19 7 2 - 1 2
Seattle, Wash. 152 106 28 12 3 3 4
Spokane, Wash. 61 44 11 2 2 2 5
Tacoma, Wash. 79 58 12 5 2 2 3
TOTAL 12,246**** 8,133 2,383 1,132 300 280 700
---------------------------------------------------------------------------------------------------------------
* Mortality data in this table are voluntarily reported from 121 cities in the United States, most of which have populations
of 100,000 or more. A death is reported by the place of its occurrence and by the week that the death certificate was
filed. Fetal deaths are not included.
** Pneumonia and influenza.
*** Because of changes in reporting methods in these 3 Pennsylvania cities, these numbers are partial counts for the current
week. Complete counts will be available in 4 to 6 weeks.
**** Total includes unknown ages.
U: Unavailable -: no reported cases
===================================================================================================================================
Return to top. Disclaimer All MMWR HTML versions of articles are electronic conversions from ASCII text into HTML. This conversion may have resulted in character translation or format errors in the HTML version. Users should not rely on this HTML document, but are referred to the electronic PDF version and/or the original MMWR paper copy for the official text, figures, and tables. An original paper copy of this issue can be obtained from the Superintendent of Documents, U.S. Government Printing Office (GPO), Washington, DC 20402-9371; telephone: (202) 512-1800. Contact GPO for current prices. **Questions or messages regarding errors in formatting should be addressed to mmwrq@cdc.gov.Page converted: 09/19/98 |
|||||||||
This page last reviewed 5/2/01
|