 |
|
|
|
|
|
|
| ||||||||||
|
|
|
|
|
|
|
||||
| ||||||||||
|
|
|
|
|
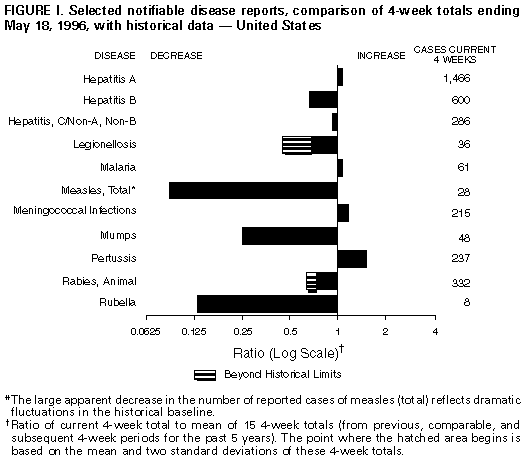
Persons using assistive technology might not be able to fully access information in this file. For assistance, please send e-mail to: mmwrq@cdc.gov. Type 508 Accommodation and the title of the report in the subject line of e-mail. Notifiable Diseases/Deaths in Selected Cities Weekly InformationFigure_I Selected notifiable disease reports, comparison of 4-week totals ending May 18, 1996, with historical data -- United States Table_I Summary -- cases of selected notifiable diseases, United States, cumulative, week ending May 18, 1996 (20th Week) Table_II Cases of selected notifiable diseases, United States, weeks ending May 18, 1996 and May 20, 1995 (20th Week) Table_III Cases of selected notifiable diseases preventable by vaccination, United States, weeks ending May 18, 1996 and May 20, 1995 (20th Week) Table_IV Deaths in 121 U.S. cities, week ending
May 18, 1996 (20th Week)
TABLE I. Summary -- cases of specified notifiable diseases, United States,
cumulative, week ending May 18, 1996 (20th Week)
============================================================================
                                             Cum. 1996
------------------------------------------------------
Anthrax                                              -
Brucellosis                                         24
Cholera                                              1
Congenital rubella syndrome                          1
Cryptosporidiosis*                                 549
Diphtheria                                           1
Encephalitis:  California*                           -
               eastern equine*                       1
               St. Louis*                            -
               western equine*                       -
Hansen Disease                                      35
Hantavirus pulmonary syndrome*+                      5
HIV infection, pediatric*&                          92
Plague                                               -
Poliomyelitis, paralytic@                            -
Psittacosis                                         10
Rabies, human                                        -
Rocky Mountain spotted fever (RMSF)                 61
Streptococcal toxic-shock syndrome*                 10
Syphilis, congenital**                               -
Tetanus                                              5
Toxic-shock syndrome                                55
Trichinosis                                         11
Typhoid fever                                      108
------------------------------------------------------
 * Not notifiable in all states
 + Updated weekly from reports to the Division of Viral and Rickettsial
   Diseases, National Center for Infectious Diseases (NCID).
 & Updated monthly to the Division of HIV/AIDS Prevention, National
   Center for HIV, STD, and TB Prevention (NCHSTP) (proposed), last update
   April 30, 1996.
 @ No suspected cases of polio reported for 1996.
** Updated quarterly from reports to the Division of STD Prevention,
   NCHSTP. First quarter 1996 is not yet available.
-: no reported cases
============================================================================
Return to top. Table_II Note: To print large tables and graphs users may have to change their printer settings to landscape and use a small font size.
TABLE II. (page 1) Cases of selected notifiable diseases, United States, weeks ending
May 18, 1996, and May 20, 1995 (20th Week)
Escherichia
coli O157:H7
------------------- Hepatitis
AIDS* Chlamydia NETSS** PHLIS*** Gonorrhea C\NA,NB Legionellosis
----------------- --------- -------- -------- ------------------- ---------------- -----------------
Reporting Area Cum. Cum. Cum. Cum. Cum. Cum. Cum. Cum. Cum. Cum. Cum.
1996 1995 1996 1996 1996 1996 1995 1996 1995 1996 1995
------------------------------------------------------------------------------------------------------------------------------------------
UNITED STATES 21,920 28,773 96,112 310 139 100,352 147,937 1,365 1,545 263 461
NEW ENGLAND 878 1,442 3,656 29 16 2,959 1,981 50 50 13 5
Maine 15 23 - 3 - 18 30 - - 1 1
N.H. 25 47 274 1 1 58 40 3 5 - -
Vt. 8 13 - 5 5 24 17 20 4 1 -
Mass. 490 637 2,574 11 10 851 1,131 24 40 6 3
R.I. 61 120 808 3 - 208 203 3 1 5 1
Conn. 279 602 - 6 - 1,800 560 - - N N
MID. ATLANTIC 5,707 7,413 13,201 34 22 11,092 16,183 136 140 58 59
Upstate N.Y. 568 828 N 23 11 2,361 3,445 116 66 13 16
N.Y. City 3,281 3,943 4,121 - - 2,608 6,128 1 1 - 1
N.J. 1,143 1,661 1,892 11 5 2,192 1,310 - 63 7 13
Pa. 715 981 7,188 N 6 3,931 5,300 19 10 38 29
E.N. CENTRAL 1,874 2,210 14,213 74 30 15,593 30,548 167 132 82 159
Ohio 438 497 3,513 24 8 2,028 9,771 4 5 38 72
Ind. 309 195 3,963 15 6 2,791 3,143 6 - 20 38
Ill. 758 889 - 19 2 6,593 7,876 22 43 2 17
Mich. 257 493 4,101 16 14 2,911 7,251 135 84 19 15
Wis. 112 136 2,636 N - 1,270 2,507 - - 3 17
W.N. CENTRAL 548 673 9,622 56 24 4,615 7,944 91 27 17 29
Minn. 109 148 - 13 13 U 1,152 - 2 1 -
Iowa 44 40 1,486 9 4 411 581 71 3 4 9
Mo. 237 277 5,119 9 - 3,070 4,608 14 10 1 8
N. Dak. 4 1 2 1 1 1 11 - 1 - 2
S. Dak. 7 7 545 2 - 79 82 - 1 2 -
Nebr. 40 51 760 6 1 153 387 2 7 7 8
Kans. 107 149 1,710 16 5 901 1,123 4 3 2 2
S. ATLANTIC 5,803 7,434 20,065 16 4 38,094 41,998 93 103 36 75
Del. 114 153 - - - 561 774 1 - - -
Md. 658 1,119 2,402 N 1 4,905 4,859 - 2 6 14
D.C. 373 461 N - - 1,684 1,868 - - 1 3
Va. 317 547 4,537 N 1 3,677 4,195 5 3 9 4
W. Va. 31 35 - N - 160 223 6 20 1 3
N.C. 266 404 - 6 2 7,318 9,467 18 25 3 14
S.C. 283 400 - 1 - 4,375 4,447 14 8 3 14
Ga. 871 890 4,632 4 - 8,722 8,105 - 11 - 9
Fla. 2,890 3,425 8,494 5 - 6,692 8,060 49 34 13 14
E.S. CENTRAL 776 917 10,755 9 4 11,013 16,351 277 526 21 13
Ky. 120 118 2,573 - - 1,582 1,738 11 12 3 3
Tenn. 283 379 4,802 4 4 4,265 5,138 239 512 9 6
Ala. 244 261 3,380 2 - 5,166 6,441 1 2 - 3
Miss. 129 159 U 3 - U 3,034 26 - 9 1
W.S. CENTRAL 2,096 2,490 4,838 12 4 7,220 17,662 157 80 2 8
Ark. 97 108 - 6 2 1,017 1,805 1 1 - 2
La. 559 360 2,574 4 2 2,926 4,547 60 47 - 2
Okla. 55 130 2,264 1 - 1,449 U 58 20 2 3
Tex. 1,385 1,892 - 1 - 1,828 11,310 38 12 - 1
MOUNTAIN 648 900 3,338 35 16 2,672 3,492 235 180 12 50
Mont. 8 8 - 3 - 13 32 9 7 1 2
Idaho 10 22 615 11 4 34 52 67 23 - 1
Wyo. 2 5 268 - - 10 20 80 69 2 2
Colo. 181 268 - 12 5 626 1,151 4 30 4 23
N. Mex. 43 81 - 2 - 352 401 33 27 - 4
Ariz. 197 266 1,420 N 7 1,366 1,281 27 13 3 5
Utah 79 58 254 5 - 49 - 10 6 1 3
Nev. 128 192 781 2 - 222 555 5 5 1 10
PACIFIC 3,590 5,294 16,424 45 19 7,094 11,778 159 307 22 63
Wash. 313 457 3,877 11 5 900 952 26 78 1 5
Oreg. 189 163 - 12 10 177 165 3 22 - -
Calif. 3,025 4,508 12,117 22 - 5,695 10,099 53 197 21 53
Alaska 10 45 N - - 200 305 2 1 - -
Hawaii 53 121 430 N 4 122 257 75 9 - 5
Guam 3 - 90 N - 22 42 - - - -
P.R. 423 953 N 5 U 106 235 19 60 - -
V.I. 6 19 N - U - 15 - - - -
Amer. Samoa - - - - U - 8 - - - -
C.N.M.I. - - N - U 11 12 - - - -
------------------------------------------------------------------------------------------------------------------------------------------
N: Not notifiable U: Unavailable -: no reported cases C.N.M.I.: Commonwealth of North Mariana Islands
* Updated monthly to the Division of HIV/AIDS Prevention, National Center for HIV, STD, and TB Prevention (proposed), last update
April 30, 1996.
** National Electronic Telecommunications System for Surveillance.
*** Public Health Laboratory Information System.
=======================================================================================================================================================
TABLE II. (page 2) Cases of selected notifiable diseases, United States, weeks ending
May 18, 1996, and May 20, 1995 (20th Week)
Meningococcal Syphilis
Lyme Malaria Disease (Primary & Secondary) Tuberculosis Rabies, Animal
---------------- ---------------- ---------------- --------------------- ----------------- ----------------
Reporting Area Cum. Cum. Cum. Cum. Cum. Cum. Cum. Cum. Cum. Cum. Cum. Cum.
1996 1995 1996 1995 1996 1995 1996 1995 1996 1995 1996 1995
-----------------------------------------------------------------------------------------------------------------------------------------------------
UNITED STATES 1,273 1,917 361 379 1,476 1,402 3,751 6,526 5,834 6,348 1,937 2,564
NEW ENGLAND 54 166 13 16 52 65 63 85 143 147 227 669
Maine 2 1 3 1 9 5 - 2 4 - - -
N.H. 2 11 1 1 1 13 1 1 4 5 33 79
Vt. - 2 1 - 3 6 - - - 1 65 92
Mass. 24 15 5 4 19 21 29 33 58 81 41 254
R.I. 21 35 3 2 - - - 1 20 17 22 92
Conn. 5 102 - 8 20 20 33 48 57 43 66 152
MID. ATLANTIC 1,068 1,435 87 96 118 170 166 364 998 1,384 293 583
Upstate N.Y. 561 750 22 20 36 50 24 34 118 147 156 224
N.Y. City 156 131 38 45 20 21 53 187 503 759 - -
N.J. 77 154 22 21 30 42 46 73 255 253 58 141
Pa. 274 400 5 10 32 57 43 70 122 225 79 218
E.N. CENTRAL 15 66 31 51 197 212 623 1,050 677 554 16 6
Ohio 13 5 6 2 75 57 228 358 108 105 3 1
Ind. 2 7 4 4 32 31 93 101 72 47 1 -
Ill. - 3 7 34 46 56 199 396 427 380 1 2
Mich. - 1 10 6 26 41 41 117 39 - 6 2
Wis. U 50 4 5 18 27 62 78 31 22 5 1
W.N. CENTRAL 36 30 10 9 115 84 168 317 142 226 183 129
Minn. 1 - 3 3 10 16 27 18 27 50 11 8
Iowa 16 1 1 - 25 16 10 25 19 33 97 41
Mo. 2 14 4 4 52 33 122 258 55 85 11 12
N. Dak. - - - - 2 - - - 2 1 16 14
S. Dak. - - - - 3 3 - - 13 8 37 30
Nebr. - 1 - 2 10 6 5 7 7 8 3 -
Kans. 17 14 2 - 13 10 4 9 19 41 8 24
S. ATLANTIC 48 149 78 78 303 228 1,356 1,658 991 1,010 966 838
Del. 1 19 2 1 2 2 16 7 20 20 26 40
Md. 24 87 20 20 25 17 228 155 106 165 232 166
D.C. 1 1 3 8 5 2 68 47 51 38 2 5
Va. - 10 8 15 27 27 192 271 82 62 221 152
W. Va. 3 12 1 1 8 4 1 1 23 39 38 38
N.C. 10 10 7 6 34 41 419 447 125 113 246 162
S.C. 2 5 3 - 32 31 173 270 40 123 21 50
Ga. - 4 8 10 81 52 117 297 240 10 118 123
Fla. 7 1 26 17 89 52 142 163 304 440 62 102
E.S. CENTRAL 18 12 10 9 96 83 701 1,563 423 511 71 109
Ky. 2 2 1 - 17 22 55 86 93 110 17 8
Tenn. 6 7 5 4 9 23 425 316 74 171 28 44
Ala. 1 1 1 5 35 21 221 232 161 154 26 55
Miss. 9 2 3 - 35 17 U 929 95 76 - 2
W.S. CENTRAL 7 30 10 5 176 148 482 1,133 678 692 23 47
Ark. 4 2 - 1 23 19 130 177 26 77 3 22
La. - - - 1 33 20 215 422 - 12 10 9
Okla. 2 14 - - 14 19 63 - 30 - 10 16
Tex. 1 14 10 3 106 90 74 534 622 603 - -
MOUNTAIN - 1 24 24 90 111 45 102 194 251 33 41
Mont. - - 2 2 3 2 - 3 7 3 5 17
Idaho - - - 1 11 5 1 - 3 6 - -
Wyo. - - 2 - 3 5 1 - 1 1 12 14
Colo. - - 12 13 14 23 15 62 25 5 1 -
N. Mex. - - 1 3 18 23 - 1 29 26 1 -
Ariz. - - 3 2 26 41 25 17 87 115 12 9
Utah - - 3 2 9 5 - - 10 10 - -
Nev. - 1 1 1 6 7 3 19 32 85 2 1
PACIFIC 27 28 98 91 329 301 147 254 1,588 1,573 125 142
Wash. 1 1 6 8 45 49 2 6 85 96 - -
Oreg. 7 1 8 6 61 55 4 6 37 21 - -
Calif. 18 26 79 69 217 190 141 241 1,378 1,360 117 136
Alaska - - 1 1 4 5 - 1 24 29 8 6
Hawaii 1 - 4 7 2 2 - - 64 67 - -
Guam - - - - 1 3 2 1 28 5 - -
P.R. - - - - 3 12 54 128 58 86 10 27
V.I. - - - - - - - 1 - - - -
Amer. Samoa - - - - - - - - - 2 - -
C.N.M.I. - - - - - - 1 2 - 13 - -
-----------------------------------------------------------------------------------------------------------------------------------------------------
N: Not notifiable U: Unavailable -: no reported cases
=======================================================================================================================================================
Return to top. Table_III Note: To print large tables and graphs users may have to change their printer settings to landscape and use a small font size.
TABLE III. (page 1) Cases of selected notifiable diseases preventable by vaccination, United
States, weeks ending May 18, 1996, and May 20, 1995 (20th Week)
Hepatitis (Viral), by type Measles (Rubeola)
H. influenzae, --------------------------------------- -------------------------------------
invasive A B Indigenous Imported**
---------------- ----------------- ----------------- --------------- ---------------
Reporting Area Cum. Cum. Cum. Cum. Cum. Cum. Cum. Cum.
1996* 1995 1996 1995 1996 1995 1996 1996 1996 1996
------------------------------------------------------------------------------------------------------------------------------
UNITED STATES 520 534 9,554 9,843 3,258 3,756 12 110 - 14
NEW ENGLAND 12 29 124 81 56 84 - 5 - 1
Maine 2 1 10 13 2 2 - - - -
N.H. 7 7 3 5 4 9 - - - -
Vt. - 1 3 3 2 1 - 1 - -
Mass. 3 7 64 32 17 30 - 3 - 1
R.I. - - 4 10 4 7 - - - -
Conn. - 13 40 18 27 35 - 1 - -
MID. ATLANTIC 78 57 620 609 495 503 - 4 - 4
Upstate N.Y. 24 15 162 133 128 125 - - - -
N.Y. City 10 14 267 290 233 172 - 4 - 3
N.J. 26 9 121 84 88 128 - - - -
Pa. 18 19 70 102 46 78 - - - 1
E.N. CENTRAL 73 99 833 1,312 351 456 1 4 - 3
Ohio 48 50 385 732 49 43 - 2 - -
Ind. 3 14 131 60 57 97 - - - -
Ill. 14 25 130 264 57 123 1 1 - 1
Mich. 3 10 136 155 164 163 - - - 2
Wis. 5 - 51 101 24 30 - 1 - -
W.N. CENTRAL 20 29 720 585 192 245 - 6 - 1
Minn. 7 11 35 63 13 20 - 4 - 1
Iowa 6 2 175 32 69 17 - - - -
Mo. 5 13 319 414 83 175 - 2 - -
N. Dak. - - 21 12 - 2 - - - -
S. Dak. 1 - 34 11 - 1 - - - -
Nebr. 1 1 84 12 8 14 - - - -
Kans. - 2 52 41 19 16 - - - -
S. ATLANTIC 127 142 380 431 494 497 - 2 - -
Del. 1 - 5 7 1 3 - 1 - -
Md. 30 40 79 79 118 109 - 1 - -
D.C. 4 - 15 4 15 10 - - - -
Va. 4 14 58 74 57 35 - - - -
W. Va. 4 6 10 10 11 21 - - - -
N.C. 14 18 43 49 129 116 - - - -
S.C. 3 - 29 15 38 20 - - - -
Ga. 60 31 13 43 7 49 - - - -
Fla. 7 33 128 150 118 134 - - - -
E.S. CENTRAL 9 4 738 503 320 413 - - - -
Ky. 2 1 14 25 26 42 - - - -
Tenn. 1 - 516 401 204 319 - - - -
Ala. 5 3 89 46 20 52 - - - -
Miss. 1 - 119 31 70 - - - - -
W.S. CENTRAL 19 24 1,719 1,018 324 385 - - - 2
Ark. - 4 231 85 31 17 - - - -
La. - 1 48 32 40 64 - - - -
Okla. 18 15 717 213 38 49 - - - -
Tex. 1 4 723 688 215 255 - - - 2
MOUNTAIN 60 47 1,261 1,665 370 311 1 10 - 1
Mont. - - 50 25 4 9 - - - -
Idaho 1 2 119 172 53 38 1 1 - -
Wyo. 30 2 17 58 14 8 - - - -
Colo. 5 7 U 207 U 51 - 2 - 1
N. Mex. 7 6 203 315 143 132 - - - -
Ariz. 9 16 431 475 88 40 - 3 - -
Utah 6 5 364 363 54 22 - - - -
Nev. 2 9 77 50 14 11 - 4 - -
PACIFIC 122 103 3,159 3,639 656 862 10 79 - 2
Wash. 1 4 217 224 46 62 10 14 - -
Oreg. 17 12 452 783 31 49 - 1 - -
Calif. 102 85 2,426 2,546 575 740 - 1 - 1
Alaska - - 27 15 2 5 - 63 - -
Hawaii 2 2 37 71 2 6 - - - 1
Guam - - 2 2 - - U - U -
P.R. 1 3 41 21 164 132 - 1 - -
V.I. - - - - - 2 U - U -
Amer. Samoa - - - 5 - - U - U -
C.N.M.I. 10 3 1 14 5 6 U - U -
------------------------------------------------------------------------------------------------------------------------------
* Of 109 cases reported among children aged <5 years, serotype was reported for 27 and of those, 5 were type b.
** For imported measles, cases include only those resulting from importation from other countries.
N: Not notifiable U: Unavailable -: no reported cases
============================================================================================================================================
TABLE III. (page 2) Cases of selected notifiable diseases preventable by vaccination, United
States, weeks ending May 18, 1996, and May 20, 1995 (20th Week)
Measles (Rubeola), cont'd.
--------------------------
Total Mumps Pertussis Rubella
-------------------------- -------------------------- --------------------------- ---------------------------
Reporting Area Cum. Cum. Cum. Cum. Cum. Cum. Cum. Cum.
1996 1995 1996 1996 1995 1996 1996 1995 1996 1996 1995
------------------------------------------------------------------------------------------------------------------------------------------
UNITED STATES 124 190 10 242 360 94 1,075 1,011 3 67 38
NEW ENGLAND 6 4 - - 4 1 172 158 - 8 6
Maine - - - - 2 - 8 18 - - -
N.H. - - - - - - 17 12 - - 1
Vt. 1 - - - - - 7 5 - 2 -
Mass. 4 2 - - 1 1 137 116 - 4 2
R.I. - 2 - - - - - - - - -
Conn. 1 - - - 1 - 3 7 - 2 3
MID. ATLANTIC 8 3 1 28 49 - 88 89 - 4 3
Upstate N.Y. - - 1 9 14 - 49 51 - 3 -
N.Y. City 7 - - 4 7 - 14 15 - 1 2
N.J. - 3 - - 7 - - 6 - - 1
Pa. 1 - - 15 21 - 25 17 - - -
E.N. CENTRAL 7 6 3 64 60 5 134 112 - 3 -
Ohio 2 - - 26 19 1 56 37 - - -
Ind. - - - 5 5 2 12 9 - - -
Ill. 2 - 2 15 18 2 49 23 - 1 -
Mich. 2 4 1 18 18 - 12 31 - 2 -
Wis. 1 2 - - - - 5 12 - - -
W.N. CENTRAL 7 1 - 3 23 3 52 69 - 1 -
Minn. 5 - - 1 2 3 35 27 - - -
Iowa - - - - 4 - 2 1 - 1 -
Mo. 2 1 - - 14 - 9 16 - - -
N. Dak. - - - 2 - - - 5 - - -
S. Dak. - - - - - - 1 7 - - -
Nebr. - - - - 3 - 1 3 - - -
Kans. - - - - - - 4 10 - - -
S. ATLANTIC 2 1 3 28 58 2 113 98 - 12 6
Del. 1 - - - - - 7 5 - - -
Md. 1 - 2 12 16 - 45 12 - - -
D.C. - - - - - - - 2 - 1 -
Va. - - - 3 13 - 5 7 - - -
W. Va. - - - - - - 2 - - - -
N.C. - - - - 16 - 25 49 - - -
S.C. - - 1 4 6 - 5 10 - 1 -
Ga. - - - 2 - 2 6 - - - -
Fla. - 1 - 7 7 - 18 13 - 10 6
E.S. CENTRAL - - - 11 10 1 37 26 - - -
Ky. - - - - - - 23 2 - - -
Tenn. - - - 1 - - 9 4 - - -
Ala. - - - 4 4 1 2 20 - - -
Miss. - - - 6 6 - 3 - N N N
W.S. CENTRAL 2 2 - 11 26 1 21 51 1 2 2
Ark. - 2 - - 5 - 2 7 - - -
La. - - - 8 6 - 3 1 - 1 -
Okla. - - - - - - 4 7 - - -
Tex. 2 - - 3 15 1 12 36 1 1 2
MOUNTAIN 11 57 - 19 13 22 142 237 - 2 4
Mont. - - - - 1 - 4 3 - - -
Idaho 1 - - - 2 17 65 71 - - -
Wyo. - - - - - - - - - - -
Colo. 3 17 - 1 - - 18 33 - - -
N. Mex. - 29 N N N - 26 23 - - -
Ariz. 3 10 - 1 1 5 9 96 - 1 3
Utah - - - 2 2 - 3 9 - - 1
Nev. 4 1 - 15 7 - 17 2 - 1 -
PACIFIC 81 116 3 78 117 59 316 171 2 35 17
Wash. 14 16 - 8 9 33 120 30 - 1 -
Oreg. 1 1 N N N - 25 13 - - 1
Calif. 2 97 3 54 96 25 162 115 2 32 14
Alaska 63 - - 2 11 - - - - - -
Hawaii 1 2 - 14 1 1 9 13 - 2 2
Guam - - U 2 3 U - - U - -
P.R. 1 7 - 1 1 - - 8 - - -
V.I. - - U - 2 U - - U - -
Amer. Samoa - - U - - U - - U - -
C.N.M.I. - - U - - U - - U - -
------------------------------------------------------------------------------------------------------------------------------------------
N: Not notifiable U: Unavailable -: no reported cases
============================================================================================================================================
Return to top. Table_IV Note: To print large tables and graphs users may have to change their printer settings to landscape and use a small font size.
TABLE IV. Deaths in 121 U.S. cities* week ending
May 18, 1996 (20th Week)
===================================================================================================================================
All Causes, By Age (Years)
------------------------------------------------------------------------ P&I**
Reporting Area All Ages >=65 45-64 25-44 1-24 <1 Total
---------------------------------------------------------------------------------------------------------------
NEW ENGLAND 611 418 104 58 17 14 29
Boston, Mass. 183 101 46 21 9 6 9
Bridgeport, Conn. 39 23 7 5 2 2 1
Cambridge, Mass. 23 18 4 1 - - 2
Fall River, Mass. 35 31 3 1 - - -
Hartford, Conn. 45 30 4 8 1 2 2
Lowell, Mass. 20 14 3 1 1 1 -
Lynn, Mass. 14 11 1 2 - - -
New Bedford, Mass. 28 20 4 3 1 - 1
New Haven, Conn. 33 26 4 3 - - 3
Providence, R.I. 64 47 12 3 1 1 -
Somerville, Mass. 1 - 1 - - - -
Springfield, Mass. 39 31 2 4 1 1 3
Waterbury, Conn. 35 29 3 1 1 1 1
Worcester, Mass. 52 37 10 5 - - 7
MID. ATLANTIC 2,460 1,663 470 226 47 54 132
Albany, N.Y. 43 32 6 4 1 - 3
Allentown, Pa. 17 14 3 - - - -
Buffalo, N.Y. 77 59 13 3 - 2 3
Camden, N.J. 27 20 3 2 1 1 1
Elizabeth, N.J. 18 11 5 1 1 - -
Erie, Pa.*** 46 35 8 1 - 2 2
Jersey City, N.J. 36 21 8 6 - 1 1
New York City, N.Y. 1,292 858 254 131 26 23 53
Newark, N.J. 64 30 20 8 3 3 2
Paterson, N.J. 25 19 2 3 1 - 1
Philadelphia, Pa. 400 246 85 43 10 16 27
Pittsburgh, Pa.*** 60 49 7 4 - - 8
Reading, Pa. 8 7 1 - - - 1
Rochester, N.Y. 128 98 19 7 1 3 9
Schenectady, N.Y. 17 12 3 2 - - -
Scranton, Pa.*** 28 25 3 - - - 3
Syracuse, N.Y. 98 70 20 4 2 2 12
Trenton, N.J. 33 22 5 5 - 1 4
Utica, N.Y. 14 12 2 - - - -
Yonkers, N.Y. 29 23 3 2 1 - 2
E.N. CENTRAL 2,086 1,416 412 157 51 48 135
Akron, Ohio 47 38 5 2 - 2 -
Canton, Ohio 41 30 7 4 - - 3
Chicago, Ill. 418 251 105 37 13 10 35
Cincinnati, Ohio 92 64 22 4 - 2 8
Cleveland, Ohio 129 83 25 17 2 2 5
Columbus, Ohio 233 150 46 24 4 9 8
Dayton, Ohio 129 100 19 6 3 1 12
Detroit, Mich. 195 116 41 26 9 3 13
Evansville, Ind. 45 34 6 3 2 - 3
Fort Wayne, Ind. 51 34 11 2 2 2 5
Gary, Ind. 18 7 8 2 - 1 1
Grand Rapids, Mich. 50 42 5 1 2 - 2
Indianapolis, Ind. 129 90 25 7 - 7 8
Madison, Wis. 51 36 9 5 1 - 5
Milwaukee, Wis. 123 86 30 3 2 2 7
Peoria, Ill. 52 38 5 3 2 4 1
Rockford, Ill. 57 45 7 2 3 - 3
South Bend, Ind. 57 43 8 1 4 1 6
Toledo, Ohio 102 75 20 4 2 1 8
Youngstown, Ohio 67 54 8 4 - 1 2
W.N. CENTRAL 783 557 133 51 14 19 60
Des Moines, Iowa 105 72 23 3 2 5 8
Duluth, Minn. 30 22 7 - - 1 3
Kansas City, Kans. 36 16 12 4 2 2 1
Kansas City, Mo. 99 64 18 6 - 2 5
Lincoln, Nebr. 35 23 8 4 - - 2
Minneapolis, Minn. 165 130 21 8 2 4 17
Omaha, Nebr. 86 64 10 9 2 1 4
St. Louis, Mo. 109 75 17 10 3 4 11
St. Paul, Minn. 47 36 9 1 1 - 4
Wichita, Kans. 71 55 8 6 2 - 5
S. ATLANTIC 1,274 780 266 144 40 43 80
Atlanta, Ga. 169 93 40 28 4 4 1
Baltimore, Md. 172 107 33 24 6 2 20
Charlotte, N.C. 84 56 10 11 3 4 8
Jacksonville, Fla. 154 92 25 24 5 7 3
Miami, Fla. 111 57 26 21 4 3 5
Norfolk, Va. 61 36 17 1 2 5 5
Richmond, Va. 90 53 20 5 5 7 3
Savannah, Ga. 58 35 12 6 4 1 8
St. Petersburg, Fla. 56 36 15 2 1 2 2
Tampa, Fla. 169 124 31 8 2 4 22
Washington, D.C. 134 88 27 13 2 4 3
Wilmington, Del. 16 3 10 1 2 - -
E.S. CENTRAL 726 480 141 64 22 19 60
Birmingham, Ala. 120 73 21 13 7 6 4
Chattanooga, Tenn. 69 50 15 4 - - 7
Knoxville, Tenn. 65 43 9 8 5 - 9
Lexington, Ky. 70 49 14 4 1 2 6
Memphis, Tenn. 171 105 35 16 6 9 13
Mobile, Ala. 51 37 9 4 1 - 3
Montgomery, Ala. 33 24 8 1 - - 4
Nashville, Tenn. 147 99 30 14 2 2 14
W.S. CENTRAL 1,414 917 270 152 40 35 90
Austin, Tex. 88 56 15 13 2 2 10
Baton Rouge, La. 55 45 4 4 - 2 -
Corpus Christi, Tex. 61 40 12 5 4 - 3
Dallas, Tex. 196 123 36 22 9 6 6
El Paso, Tex. 69 48 13 5 3 - 7
Ft. Worth, Tex. 86 60 17 4 3 2 4
Houston, Tex. 366 215 83 47 7 14 30
Little Rock, Ark. U U U U U U U
New Orleans, La. 134 84 27 19 3 1 -
San Antonio, Tex. 207 138 34 24 4 7 15
Shreveport, La. 58 39 12 5 2 - 6
Tulsa, Okla. 94 69 17 4 3 1 9
MOUNTAIN 951 661 142 92 33 22 55
Albuquerque, N.M. 100 67 19 13 1 - 3
Colo. Springs, Colo. 55 39 7 5 1 3 3
Denver, Colo. 139 90 18 20 7 4 8
Las Vegas, Nev. 149 104 23 17 4 1 5
Ogden, Utah 21 17 2 1 - 1 1
Phoenix, Ariz. 191 123 40 13 9 5 11
Pueblo, Colo. 27 22 4 1 - - 4
Salt Lake City, Utah 124 87 15 12 7 3 13
Tucson, Ariz. 145 112 14 10 4 5 7
PACIFIC 1,776 1,252 287 154 41 40 143
Berkeley, Calif. 15 5 7 - 1 2 2
Fresno, Calif. 68 57 7 2 2 - 6
Glendale, Calif. 43 35 5 3 - - 4
Honolulu, Hawaii 68 55 7 6 - - 8
Long Beach, Calif. 64 48 9 6 - - 16
Los Angeles, Calif. 652 450 104 59 18 21 40
Pasadena, Calif. 26 20 2 4 - - 3
Portland, Oreg. 130 99 17 8 5 1 4
Sacramento, Calif. U U U U U U U
San Diego, Calif. 135 93 19 12 5 5 9
San Francisco, Calif. 125 75 27 18 3 2 11
San Jose, Calif. 173 121 27 14 5 6 21
Santa Cruz, Calif. 34 27 5 2 - - 6
Seattle, Wash. 115 72 28 12 1 2 4
Spokane, Wash. 60 46 10 4 - - 7
Tacoma, Wash. 68 49 13 4 1 1 2
TOTAL 12,081**** 8,144 2,225 1,098 305 294 784
---------------------------------------------------------------------------------------------------------------
* Mortality data in this table are voluntarily reported from 121 cities in the United States, most of which have populations
of 100,000 or more. A death is reported by the place of its occurrence and by the week that the death certificate was
filed. Fetal deaths are not included.
** Pneumonia and influenza.
*** Because of changes in reporting methods in these 3 Pennsylvania cities, these numbers are partial counts for the current
week. Complete counts will be available in 4 to 6 weeks.
**** Total includes unknown ages.
U: Unavailable -: no reported cases
===================================================================================================================================
Return to top. Disclaimer All MMWR HTML versions of articles are electronic conversions from ASCII text into HTML. This conversion may have resulted in character translation or format errors in the HTML version. Users should not rely on this HTML document, but are referred to the electronic PDF version and/or the original MMWR paper copy for the official text, figures, and tables. An original paper copy of this issue can be obtained from the Superintendent of Documents, U.S. Government Printing Office (GPO), Washington, DC 20402-9371; telephone: (202) 512-1800. Contact GPO for current prices. **Questions or messages regarding errors in formatting should be addressed to mmwrq@cdc.gov.Page converted: 09/19/98 |
|||||||||
This page last reviewed 5/2/01
|