 |
|
|
|
|
|
|
| ||||||||||
|
|
|
|
|
|
|
||||
| ||||||||||
|
|
|
|
|
Persons using assistive technology might not be able to fully access information in this file. For assistance, please send e-mail to: mmwrq@cdc.gov. Type 508 Accommodation and the title of the report in the subject line of e-mail. AIDS Associated with Injecting-Drug Use -- United States, 1995Injecting-drug use is the second most frequently reported risk behavior for infection with human immunodeficiency virus (HIV) (1). As of December 31, 1995, of 513,486 cases of acquired immunodeficiency syndrome (AIDS) reported to CDC, 184,359 (36%) were directly or indirectly associated with injecting-drug use. Injecting-drug-user (IDU)-associated AIDS cases include persons who are IDUs * (n=161,891), their heterosexual sex partners (n=18,710), and children (n=3,758) whose mothers were IDUs or sex partners of IDUs (1). This report characterizes persons with and trends in IDU-associated AIDS reported to CDC through 1995 from the 50 states, the District of Columbia, and the U.S. territories. IDU-associated AIDS cases reported in 1995 were analyzed by sex, race/ethnicity, state, and region **. Trends in IDU-associated AIDS among adolescents and adults (aged greater than or equal to 13 years) were evaluated using the estimated incidence of AIDS-defining opportunistic illness (AIDS-OI), which adjusts for the 1993 expansion of the AIDS surveillance case definition and for reporting delays and anticipated reclassification of cases initially reported with no identified risk (1,2). Trends in estimated AIDS-OI incidence were analyzed by quarter for January 1990-June 1995 (the most recent date for which AIDS-OI incidence can be reliably estimated). For inter-area and intergroup comparisons, estimated IDU-associated AIDS-OI incidence rates (per 100,000 population) among adolescents and adults for July 1994-June 1995 were calculated using 1994 Bureau of the Census population estimates by race/ethnicity and region. IDU-Associated AIDS Cases Reported in 1995 Of 74,180 AIDS cases reported in 1995, a total of 25,860 (35%) were associated with injecting-drug use. Among persons with IDU-associated AIDS, 14,057 (54%) were heterosexual males, 5204 (20%) were female, 3425 (13%) were men who have sex with men (MSM), 2849 (11%) were male and female heterosexual sex partners of IDUs, and 325 (1%) were children whose mothers were either IDUs or sex partners of IDUs. Among persons with IDU-associated AIDS, 50% (12,832) were black, 25% (6509) white, and 24% (6319) Hispanic; Asians/Pacific Islanders (74) and American Indians/Alaskan Natives (88) each accounted for less than 1% of cases. When analyzed by sex and sexual orientation, 66% (7125 of 10,777) of AIDS cases reported among women and 85% (14,985 of 17,686) among heterosexual men with an identified exposure category were IDU-associated. In comparison, 10% (3425 of 34,096) of AIDS cases among MSM had a history of injecting-drug use. IDU-associated AIDS accounted for greater than 50% of cases reported from Delaware (204 {65%} of 314 cases), Puerto Rico (1647 {63%} of 2604), Connecticut (1018 {61%} of 1676), Maryland (1382 {52%} of 2680), and Rhode Island (121 {52%} of 232) and accounted for 49% from New York (6130 of 12,394) and New Jersey (2155 of 4364). By region, the Northeast accounted for 44% (11,284) of IDU-associated AIDS cases, followed by the South (29%, 7481), West (13%, 3351), Midwest (8%, 2091), and U.S. territories (6%, 1653). Trends in IDU-Associated AIDS-OI Cases Among Adolescents and Adults, 1990-1995 During January 1990-June 1995, the quarterly number of estimated IDU-associated AIDS-OI cases among adolescents and adults increased 48%, from approximately 4200 cases to approximately 6300 cases (Figure_1). However, most of this increase occurred during the early 1990s (annual increases of 17% during 1990-1991 compared with 4% during 1993-1994). Among female and heterosexual male IDUs, increases in annual AIDS-OI cases were substantial in the early 1990s and smaller in subsequent years (Figure_2). In comparison, the number of cases among MSM IDUs peaked in 1992 (approximately 1000 per quarter) and subsequently declined (Figure_2). Among heterosexual sex partners of IDUs, the number of cases increased steadily throughout the 1990s: cases among heterosexual sex partners of IDUs during 1990-1991 increased 23% among women and 19% among men; during January-June 1994 and January-June 1995, increases were 9% among women and 17% among men. Among non-Hispanic black IDUs, cases increased from January-June 1990 to January-June 1995 by 59% (from approximately 1800 cases to 2800 cases). During January-June 1995, the estimated quarterly number of cases among non-Hispanic blacks (approximately 2800 cases) was more than twice that among non-Hispanic whites (approximately 1300 cases) and Hispanics (approximately 1200 cases) (Figure_3) ***. From January-June 1990 through January-June 1995, the estimated number of cases in the South increased 62% (from 1000 to 1700 per quarter) and in the West by 56% (from approximately 460 to 700 cases per quarter). In comparison, during 1990-1993, AIDS-OI cases increased approximately 37% (from 1700 to 2400 per quarter) in the Northeast and 68% (from 240 to 400 per quarter) in the Midwest and have remained stable. Estimated IDU-Associated AIDS-OI Rates Among Adolescents and Adults, July 1994-June 1995 During July 1994-June 1995, the estimated annual incidence rate of IDU-associated AIDS-OI among adolescents and adults was 11.1 cases per 100,000 population. In all regions, estimated IDU-associated AIDS-OI rates were higher for non-Hispanic blacks and Hispanics than non-Hispanic whites (Table_1). Rates were nearly 14-fold higher for non-Hispanic black men (78.7 cases per 100,000 population) and nearly 17-fold higher for non-Hispanic black women (31.8) than for non-Hispanic white men (5.8) and non-Hispanic white women (1.9). Rates for Hispanic men (44.7) and Hispanic women (15.0) were eightfold higher than rates among non-Hispanic whites. Rates varied substantially by region and were highest in the Northeast (Table_1): of the 13 states with rates greater than or equal to 10 cases per 100,000 population, six were located in the Northeast (New York {39.4 cases per 100,000 population}, New Jersey {32.3}, Connecticut {24.7}, Massachusetts {12.5}, Rhode Island {12.4}, and Pennsylvania {10.1}), six in the South (Delaware {27.8}, Maryland {26.2}, Florida {19.3}, Georgia {12.2}, South Carolina {10.6}, and Louisiana {10.5}), and one in the West (Nevada {10.6}). Rates also were high in the District of Columbia (91.9) and Puerto Rico (46.4). Reported by: Local, state, and territorial health depts. Div of HIV/AIDS Prevention, National Center for STD, HIV, and TB Prevention (proposed), CDC. Editorial NoteEditorial Note: The findings in this report underscore three important trends in the AIDS epidemic. First, although annual increases in the number of cases associated with IDUs continue to occur, these increases have been progressively smaller while AIDS incidence among heterosexual partners of IDUs has continued to increase steadily. Second, IDU-associated AIDS has disproportionately increased among heterosexual minorities, particularly among blacks. Finally, although the highest rates of IDU-associated AIDS-OI continued to occur in the Northeast, the numbers of cases in the South and West continued to increase while increases in the Northeast have slowed. Rates of IDU-associated AIDS in this report were calculated using the total adolescent and adult population. Because the number of IDUs in the United States is unknown, rates of AIDS among IDUs could not be calculated. However, findings of HIV seroprevalence studies among IDUs entering drug-treatment centers are consistent with the results of this report: HIV seroprevalence has been consistently highest among IDUs in the Northeast (27%), intermediate in the South (12%), and lowest in the Midwest (7%) and West (3%) (3). In addition, HIV seroprevalence has been consistently higher among non-Hispanic black and Hispanic IDUs than among non-Hispanic white IDUs (3). Racial differences in the number and rate of IDU-associated AIDS cases probably reflect socioeconomic, behavioral, and other risk factors related to injecting-drug use. Because IDU-associated risk for AIDS is probably underreported, the findings in this report represent minimum estimates. Multiple overlapping risk behaviors are associated with HIV/AIDS and account for variations in the epidemiology of this disease. For example, through 1995, 17% of the 128,696 heterosexual men and women IDUs with AIDS also reported having heterosexual contact with an HIV-positive person or a person with other risks for HIV (1,4), emphasizing the strong links between heterosexually acquired AIDS and injecting-drug use. In addition, preliminary findings of a study at six sites to verify exposure risk indicated that 21% (120 of 569) of men and 15% (136 of 877) of women initially reported as having heterosexual contact with an HIV-positive partner or a partner at high risk for HIV infection had an additional risk; of these, most (56% of 120 men and 88% of 136 women) had injected drugs (5). Measures for reducing the occurrence of IDU-associated AIDS include preventing the initiation of injecting-drug use, increasing the number of IDUs in drug treatment, encouraging safer injecting practices among IDUs, and promoting safer sexual behaviors among IDUs and their sex partners (6,7). For example, in Connecticut, partial repeal of needle prescription and drug paraphernalia laws in 1992 allowing purchase of needles and syringes by IDUs without a prescription and possession of this equipment without medical need decreased the sharing of syringes by IDUs (8). In addition, some jurisdictions have implemented needle and syringe exchange programs to provide IDUs with sterile injection equipment and access to drug-abuse treatment and some services (9). Persons who continue to inject drugs should be screened periodically for HIV infection and advised of measures that may reduce risks for infection (10). References
* Defined as any person who injected drugs at least once after 1977. ** Northeast=Connecticut, Maine, Massachusetts, New Hampshire, New Jersey, New York, Pennsylvania, Rhode Island, and Vermont; Midwest=Illinois, Indiana, Iowa, Kansas, Michigan, Minnesota, Missouri, Nebraska, North Dakota, Ohio, South Dakota, and Wisconsin); South=Alabama, Arkansas, Delaware, District of Columbia, Florida, Georgia, Kentucky, Louisiana, Maryland, Mississippi, North Carolina, Oklahoma, South Carolina, Tennessee, Texas, Virginia, and West Virginia; West=Alaska, Arizona, California, Colorado, Hawaii, Idaho, Montana, Nevada, New Mexico, Oregon, Utah, Washington, and Wyoming; U.S. territories=Guam, Puerto Rico, U.S. Pacific Islands, and U.S. Virgin Islands. *** Numbers for other racial/ethnic groups were too small for meaningful analysis. Figure_1 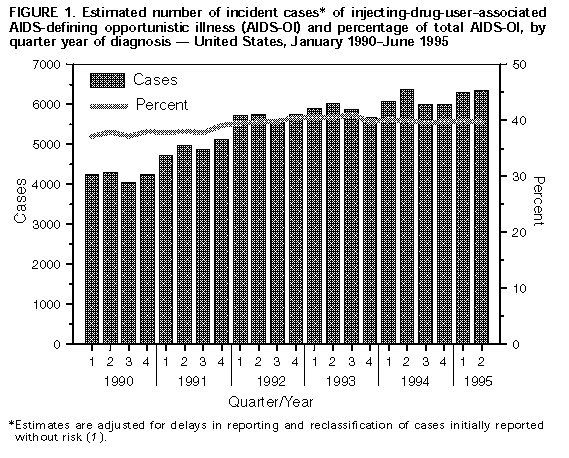 Return to top. Figure_2 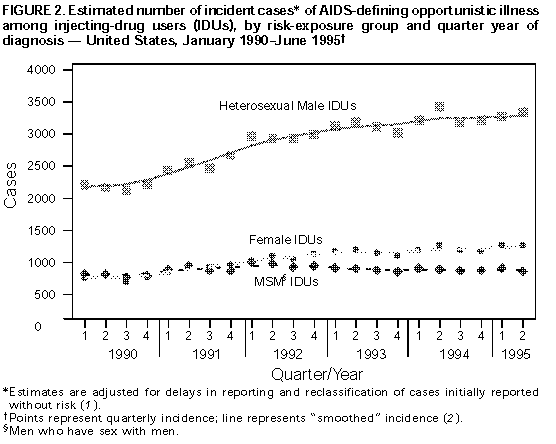 Return to top. Figure_3  Return to top. Table_1 Note: To print large tables and graphs users may have to change their printer settings to landscape and use a small font size.
TABLE 1. Estimated annual number and rate* of injecting-drug-use-associated AIDS-defining opportunistic
illness among persons aged >=13 years, by race/ethnicity+ and region& -- United States, July 1994-June 1995
============================================================================================================
              Northeast          Midwest            South             West             Total
Race/      -------------     --------------     -------------    --------------   ---------------
 Ethnicity   No.    Rate       No.    Rate       No.    Rate        No.    Rate       No.    Rate
------------------------------------------------------------------------------------------------------------
White      1,900 (  5.8)       550   ( 1.4)     1,700  ( 3.2)     1,400  ( 4.7)     5,600  ( 3.5)
Black      4,900 (117.3)     1,100   (23.4)     5,300  (41.0)       850  (38.7)    12,100  (50.9)
Hispanic   2,800 ( 87.6)       180   (12.1)       600  (12.0)       550  ( 6.6)     4,200  (21.9)

Total     10,400 ( 24.6)     2,000   ( 4.0)     7,900  (10.7)     3,100  ( 6.8)    23,300  (11.1)
------------------------------------------------------------------------------------------------------------
* Per 100,000 population.
+ Numbers for other racial/ethnic groups were too small for meaningful analysis.
& Northeast=Connecticut, Maine, Massachusetts, New Hampshire, New Jersey, New York, Pennsylvania,
  Rhode Island, and Vermont; Midwest=Illinois, Indiana, Iowa, Kansas, Michigan, Minnesota, Missouri,
  Nebraska, North Dakota, Ohio, South Dakota, and Wisconsin; South=Alabama, Arkansas, Delaware, District of
  Columbia, Florida, Georgia, Kentucky, Louisiana, Maryland, Mississippi, North Carolina, Oklahoma, South
  Carolina, Tennessee, Texas, Virginia, and West Virginia; West=Alaska, Arizona, California, Colorado,
  Hawaii, Idaho, Montana, Nevada, New Mexico, Oregon, Utah, Washington, and Wyoming.
@ Estimates are adjusted for delays in reporting of AIDS cases and anticipated redistribution of cases
  initially reported with no identified risk.
============================================================================================================
Return to top. Disclaimer All MMWR HTML versions of articles are electronic conversions from ASCII text into HTML. This conversion may have resulted in character translation or format errors in the HTML version. Users should not rely on this HTML document, but are referred to the electronic PDF version and/or the original MMWR paper copy for the official text, figures, and tables. An original paper copy of this issue can be obtained from the Superintendent of Documents, U.S. Government Printing Office (GPO), Washington, DC 20402-9371; telephone: (202) 512-1800. Contact GPO for current prices. **Questions or messages regarding errors in formatting should be addressed to mmwrq@cdc.gov.Page converted: 09/19/98 |
|||||||||
This page last reviewed 5/2/01
|