 |
|
|
|
|
|
|
| ||||||||||
|
|
|
|
|
|
|
||||
| ||||||||||
|
|
|
|
|
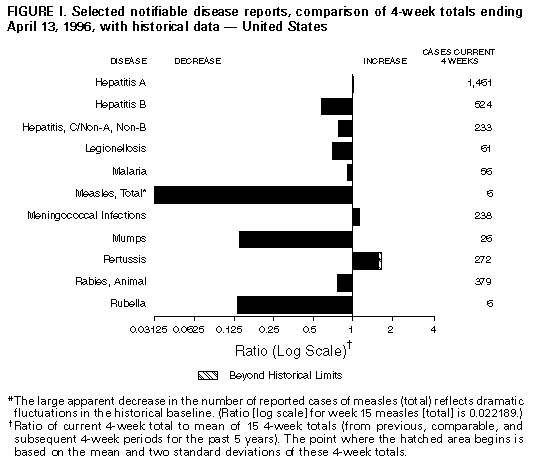
Persons using assistive technology might not be able to fully access information in this file. For assistance, please send e-mail to: mmwrq@cdc.gov. Type 508 Accommodation and the title of the report in the subject line of e-mail. Notifiable Diseases/Deaths in Selected Cities Weekly InformationFigure_I Selected notifiable disease reports, comparison of 4-week totals ending April 13, 1996, with historical data -- United States Table_I Summary -- cases of selected notifiable diseases, United States, cumulative, week ending April 13, 1996 (15th Week) Table_II Cases of selected notifiable diseases, United States, weeks ending April 13, 1996 and April 15, 1995 (15th Week) Table_III Cases of selected notifiable diseases preventable by vaccination, United States, weeks ending April 13, 1996 and April 15, 1995 (15th Week) Table_IV Deaths in 121 U.S. cities, week ending
April 13, 1996 (15th Week)
TABLE I. Summary -- cases of specified notifiable diseases, United States,
cumulative, week ending April 13, 1996 (15th Week)
============================================================================
                                             Cum. 1996
------------------------------------------------------
Anthrax                                              -
Brucellosis                                         18
Cholera                                              1
Congenital rubella syndrome                          1
Cryptosporidiosis*                                 396
Diphtheria                                           1
Encephalitis:  California*                           -
               eastern equine*                       1
               St. Louis*                            -
               western equine*                       -
Hansen Disease                                      27
Hantavirus pulmonary syndrome*+                      1
HIV infection, pediatric*&                          76
Plague                                               -
Poliomyelitis, paralytic@                            -
Psittacosis                                          5
Rabies, human                                        -
Rocky Mountain spotted fever (RMSF)                 23
Streptococcal toxic-shock syndrome*                  9
Syphilis, congenital**                               -
Tetanus                                              3
Toxic-shock syndrome                                40
Trichinosis                                          8
Typhoid fever                                       75
------------------------------------------------------
 * Not notifiable in all states
 + Updated weekly from reports to the Division of Viral and Rickettsial
   Diseases, National Center for Infectious Diseases (NCID).
 & Updated monthly to the Division of HIV/AIDS Prevention, National
   Center for Prevention Services (NCPS), last update March 26, 1996.
 @ No suspected cases of polio reported for 1996.
** Updated quarterly from reports to the Division of STD Prevention,
   NCPS. First quarter 1996 is not yet available.
-: no reported cases
============================================================================
Return to top. Table_II Note: To print large tables and graphs users may have to change their printer settings to landscape and use a small font size.
TABLE II. (page 1) Cases of selected notifiable diseases, United States, weeks ending
April 13, 1996, and April 15, 1995 (15th Week)
Escherichia
coli O157:H7
------------------- Hepatitis
AIDS* Chlamydia NETSS** PHLIS*** Gonorrhea C\NA,NB Legionellosis
----------------- --------- -------- -------- ------------------- ---------------- -----------------
Reporting Area Cum. Cum. Cum. Cum. Cum. Cum. Cum. Cum. Cum. Cum. Cum.
1996 1995 1996 1996 1996 1996 1995 1996 1995 1996 1995
------------------------------------------------------------------------------------------------------------------------------------------
UNITED STATES 16,791 20,883 65,303 215 76 78,352 111,537 949 1,181 201 326
NEW ENGLAND 657 1,243 2,735 22 5 2,210 1,664 26 29 7 4
Maine 10 23 - 3 - 13 18 - - 1 -
N.H. 23 37 204 1 1 38 30 1 3 - -
Vt. 7 6 - 4 4 17 14 15 2 - -
Mass. 392 581 1,911 10 - 648 897 7 23 4 3
R.I. 38 87 620 2 - 161 166 3 1 2 1
Conn. 187 509 - 2 - 1,333 539 - - N N
MID. ATLANTIC 4,440 4,906 9,496 31 15 7,047 12,759 90 107 46 44
Upstate N.Y. 538 621 N 16 10 1,503 2,779 81 49 9 11
N.Y. City 2,443 2,333 2,288 - - 1,785 4,571 1 1 - 1
N.J. 928 1,205 1,498 8 - 723 1,181 - 47 7 9
Pa. 531 747 5,710 N 5 3,036 4,228 8 10 30 23
E.N. CENTRAL 1,395 1,704 11,039 34 15 12,343 23,051 119 89 67 114
Ohio 300 436 2,686 18 8 1,480 7,122 4 4 31 46
Ind. 269 164 2,618 10 1 2,027 2,419 5 - 18 25
Ill. 518 733 - 2 1 5,053 5,971 8 32 2 14
Mich. 228 272 4,101 4 5 2,911 5,628 102 53 15 14
Wis. 80 99 1,634 N - 872 1,911 - - 1 15
W.N. CENTRAL 413 497 7,086 22 16 4,475 5,910 106 20 13 22
Minn. 84 93 - 3 10 U 881 - 1 - -
Iowa 31 32 927 5 3 295 437 71 3 3 8
Mo. 175 215 4,132 3 - 2,346 3,366 31 7 1 7
N. Dak. 1 1 2 1 1 1 9 - - - 2
S. Dak. 5 1 370 1 - 60 63 - 1 2 -
Nebr. 32 43 388 4 - 57 317 1 5 6 3
Kans. 85 112 1,267 5 2 717 837 3 3 1 2
S. ATLANTIC 4,590 5,908 15,558 15 2 29,826 32,730 50 74 26 51
Del. 93 114 - - - 416 596 1 - - -
Md. 444 963 1,710 N 1 3,877 4,108 - 2 5 12
D.C. 225 405 N - - 1,269 1,692 - - 1 3
Va. 224 370 3,463 N 1 2,824 3,271 3 1 9 3
W. Va. 24 30 - N - 99 192 4 19 1 3
N.C. 191 308 - 4 - 5,367 7,180 14 21 3 9
S.C. 229 270 - 1 - 3,316 3,235 11 2 1 8
Ga. 685 729 3,697 3 - 7,191 6,178 - 10 - 7
Fla. 2,475 2,719 6,688 4 - 5,467 6,278 17 19 6 6
E.S. CENTRAL 540 650 7,835 8 4 8,270 13,205 171 461 17 9
Ky. 86 63 1,940 - - 1,150 1,406 7 10 2 2
Tenn. 201 309 3,237 N 4 2,817 3,658 163 450 9 4
Ala. 157 158 2,537 2 - 3,905 5,372 1 1 - 2
Miss. 96 120 121 2 - 398 2,769 - - 6 1
W.S. CENTRAL 1,480 1,436 3,718 11 2 6,046 10,253 91 53 1 4
Ark. 70 86 - 5 - 833 1,324 1 - - -
La. 435 327 1,951 N 2 2,299 3,468 33 26 - 1
Okla. 54 83 1,767 1 - 1,086 1,290 35 21 1 3
Tex. 921 940 - 1 - 1,828 4,171 22 6 - -
MOUNTAIN 469 641 4,557 30 9 2,112 2,604 164 137 6 40
Mont. 4 8 - - - 10 28 8 7 - 2
Idaho 7 17 479 11 4 27 40 39 16 - 1
Wyo. 2 4 197 - - 10 16 55 56 - 1
Colo. 152 215 - 10 5 567 890 4 26 4 18
N. Mex. 25 69 - 2 - 280 318 27 18 - 3
Ariz. 136 135 2,984 N - 988 842 22 5 1 5
Utah 64 37 254 5 - 49 60 7 4 - 2
Nev. 79 156 643 2 - 181 410 2 5 1 8
PACIFIC 2,807 3,898 3,279 42 8 6,023 9,361 132 211 18 38
Wash. 220 356 2,790 6 4 708 748 24 60 1 1
Oreg. 153 132 - 12 - 126 148 3 13 - -
Calif. 2,394 3,279 - 19 - 4,955 8,014 62 129 17 32
Alaska 3 29 N 1 - 131 255 2 1 - -
Hawaii 37 102 361 N 4 103 196 41 8 - 5
Guam 3 - 26 N - 13 27 - - - -
P.R. 420 852 N N U 67 167 20 52 - -
V.I. 3 15 N N U - 10 - - - -
Amer. Samoa - - - N U - 8 - - - -
C.N.M.I. - - N N U 11 5 - - - -
------------------------------------------------------------------------------------------------------------------------------------------
N: Not notifiable U: Unavailable -: no reported cases C.N.M.I.: Commonwealth of North Mariana Islands
* Updated monthly to the Division of HIV/AIDS Prevention, National Center for Prevention Services, last update March 26, 1996.
** National Electronic Telecommunications System for Surveillance.
*** Public Health Laboratory Information System.
=======================================================================================================================================================
TABLE II. (page 2) Cases of selected notifiable diseases, United States, weeks ending
April 13, 1996, and April 15, 1995 (15th Week)
Meningococcal Syphilis
Lyme Malaria Disease (Primary & Secondary) Tuberculosis Rabies, Animal
---------------- ---------------- ---------------- --------------------- ----------------- ----------------
Reporting Area Cum. Cum. Cum. Cum. Cum. Cum. Cum. Cum. Cum. Cum. Cum. Cum.
1996 1995 1996 1995 1996 1995 1996 1995 1996 1995 1996 1995
-----------------------------------------------------------------------------------------------------------------------------------------------------
UNITED STATES 993 1,277 251 274 1,108 1,045 3,163 4,678 3,858 4,463 1,247 1,891
NEW ENGLAND 45 89 8 13 37 57 54 64 103 97 145 529
Maine - 1 2 1 6 3 - 2 4 - - -
N.H. 1 9 1 1 1 12 1 1 3 3 20 64
Vt. - 1 1 - 1 6 - - - 1 41 71
Mass. 18 10 3 2 15 18 22 21 41 47 26 212
R.I. 21 10 1 2 - - - 1 17 11 17 71
Conn. 5 58 - 7 14 18 31 39 38 35 41 111
MID. ATLANTIC 835 974 63 62 88 108 112 287 584 907 180 464
Upstate N.Y. 374 489 14 11 24 38 11 26 86 91 81 189
N.Y. City 146 31 28 27 14 12 34 154 269 497 - -
N.J. 50 133 18 17 25 28 35 57 161 157 42 91
Pa. 265 321 3 7 25 30 32 50 68 162 57 184
E.N. CENTRAL 11 13 26 36 140 151 513 806 513 483 11 2
Ohio 9 5 5 1 51 39 196 271 83 81 2 1
Ind. 2 6 3 3 14 28 76 73 47 25 1 -
Ill. - 1 7 26 44 39 153 309 328 261 - 1
Mich. - 1 8 2 15 25 41 92 39 103 4 -
Wis. U U 3 4 16 20 47 61 16 13 4 -
W.N. CENTRAL 36 23 4 7 92 61 139 246 109 155 115 81
Minn. 1 - 1 3 10 11 27 15 20 32 8 5
Iowa 16 1 1 - 20 10 6 19 13 22 59 28
Mo. 2 9 1 3 37 23 103 198 51 56 9 11
N. Dak. - - - - 2 - - - 1 1 11 7
S. Dak. - - - - 3 2 - - 9 8 21 17
Nebr. - - - 1 9 6 3 5 4 8 2 -
Kans. 17 13 1 - 11 9 - 9 11 28 5 13
S. ATLANTIC 35 130 45 58 209 172 997 1,233 581 671 639 550
Del. 1 12 2 1 2 2 12 7 - 15 16 30
Md. 23 92 16 18 21 10 172 111 74 127 162 123
D.C. - - 2 4 4 1 46 42 27 23 2 2
Va. - 3 6 10 16 23 137 205 43 29 147 107
W. Va. 3 7 - - 6 3 1 1 19 29 22 26
N.C. 6 7 6 5 29 28 293 330 99 71 154 125
S.C. 1 4 2 - 26 25 139 186 40 85 13 44
Ga. - 4 7 9 65 45 90 218 156 2 84 83
Fla. 1 1 4 11 40 35 107 133 123 290 39 10
E.S. CENTRAL 10 7 4 5 77 67 836 1,062 336 373 42 85
Ky. 1 1 - - 13 20 47 69 66 70 11 5
Tenn. 3 4 3 2 7 19 328 239 74 118 14 37
Ala. - - 1 3 30 15 163 187 119 115 17 42
Miss. 6 2 - - 27 13 298 567 77 70 - 1
W.S. CENTRAL 3 21 8 5 124 119 370 705 378 538 15 40
Ark. 2 1 - 1 17 12 73 144 20 53 2 21
La. - - - 1 25 14 173 330 - - 8 9
Okla. 1 12 - - 9 13 50 56 30 44 5 10
Tex. - 8 8 3 73 80 74 175 328 441 - -
MOUNTAIN - 1 18 19 71 86 38 80 127 127 17 24
Mont. - - 1 2 1 2 - 3 - 3 - 12
Idaho - - - 1 7 4 1 - 3 5 - -
Wyo. - - 2 - 3 4 1 - 1 1 10 2
Colo. - - 10 9 11 21 14 50 21 5 - -
N. Mex. - - 1 3 14 20 - 1 12 22 1 -
Ariz. - - 1 2 21 28 19 11 55 80 4 9
Utah - - 2 1 8 2 - 2 10 10 - -
Nev. - 1 1 1 6 5 3 13 25 1 2 1
PACIFIC 18 19 75 69 270 224 104 195 1,127 1,112 83 116
Wash. - - 2 7 31 33 1 5 71 64 - -
Oreg. 5 1 7 4 51 40 3 4 30 16 - -
Calif. 12 18 63 51 181 148 100 185 965 964 75 110
Alaska - - - 1 5 1 - 1 19 21 8 6
Hawaii 1 - 3 6 2 2 - - 42 47 - -
Guam - - - - 1 2 2 1 - 4 - -
P.R. - - - - 3 10 52 98 20 53 17 20
V.I. - - - - - - - - - - - -
Amer. Samoa - - - - - - - - - 2 - -
C.N.M.I. - - - - - - 1 - - 10 - -
-----------------------------------------------------------------------------------------------------------------------------------------------------
N: Not notifiable U: Unavailable -: no reported cases
=======================================================================================================================================================
Return to top. Table_III Note: To print large tables and graphs users may have to change their printer settings to landscape and use a small font size.
TABLE III. (page 1) Cases of selected notifiable diseases preventable by vaccination, United
States, weeks ending April 13, 1996, and April 15, 1995 (15th Week)
Hepatitis (Viral), by type Measles (Rubeola)
H. influenzae, --------------------------------------- -------------------------------------
invasive A B Indigenous Imported**
---------------- ----------------- ----------------- --------------- ---------------
Reporting Area Cum. Cum. Cum. Cum. Cum. Cum. Cum. Cum.
1996* 1995 1996 1995 1996 1995 1996 1996 1996 1996
------------------------------------------------------------------------------------------------------------------------------
UNITED STATES 408 402 6,959 7,167 2,207 2,579 1 66 - 4
NEW ENGLAND 9 20 79 50 46 66 - 5 - 1
Maine - 1 9 9 2 2 - - - -
N.H. 7 3 3 4 1 7 - - - -
Vt. - 1 1 3 2 1 - 1 - -
Mass. 2 4 42 18 10 19 - 3 - 1
R.I. - - 3 8 4 7 - - - -
Conn. - 11 21 8 27 30 - 1 - -
MID. ATLANTIC 60 43 486 395 368 302 - 2 - 1
Upstate N.Y. 17 14 107 91 82 92 - - - -
N.Y. City 7 5 222 164 177 63 - 2 - 1
N.J. 20 8 108 67 77 98 - - - -
Pa. 16 16 49 73 32 49 - - - -
E.N. CENTRAL 62 75 590 1,006 239 342 - 2 - -
Ohio 38 38 292 555 39 31 - 2 - -
Ind. 2 12 105 48 40 77 - - - -
Ill. 14 20 67 213 27 94 - - - -
Mich. 3 5 97 112 122 117 - - - -
Wis. 5 - 29 78 11 23 - - - -
W.N. CENTRAL 19 20 544 345 140 182 - 2 - -
Minn. 7 6 22 33 3 11 - 2 - -
Iowa 6 1 144 16 64 14 - - - -
Mo. 5 10 244 242 51 129 - - - -
N. Dak. - - 9 6 - 1 - - - -
S. Dak. 1 - 27 6 - 1 - - - -
Nebr. - 1 55 16 5 14 - - - -
Kans. - 2 43 26 17 12 - - - -
S. ATLANTIC 100 101 240 307 321 355 - 2 - -
Del. 1 - 5 5 1 3 - 1 - -
Md. 21 34 56 62 85 75 - 1 - -
D.C. - - 7 2 5 8 - - - -
Va. 3 12 44 55 43 27 - - - -
W. Va. 2 2 6 9 9 20 - - - -
N.C. 13 16 33 34 103 96 - - - -
S.C. 3 - 25 10 28 10 - - - -
Ga. 55 23 2 37 3 34 - - - -
Fla. 2 14 62 93 44 82 - - - -
E.S. CENTRAL 7 4 602 376 203 285 - - - -
Ky. 2 1 8 20 21 28 - - - -
Tenn. - - 433 292 165 218 - - - -
Ala. 4 3 76 37 17 39 - - - -
Miss. 1 - 85 27 - - - - - -
W.S. CENTRAL 11 17 1,056 660 172 230 - - - 1
Ark. - 3 173 37 16 4 - - - -
La. - 1 20 19 13 25 - - - -
Okla. 11 11 471 148 22 31 - - - -
Tex. - 2 392 456 121 170 - - - 1
MOUNTAIN 40 39 945 1,255 250 191 1 4 - -
Mont. - - 39 19 2 7 - - - -
Idaho 1 2 106 141 29 23 - - - -
Wyo. 18 2 8 46 7 3 - - - -
Colo. 4 6 22 156 8 38 1 1 - -
N. Mex. 7 5 152 255 112 72 - - - -
Ariz. 5 11 287 302 42 25 - - - -
Utah 3 4 279 299 39 15 - - - -
Nev. 2 9 52 37 11 8 - 3 - -
PACIFIC 100 83 2,417 2,773 468 626 - 49 - 1
Wash. 1 4 144 159 27 47 - 4 - -
Oreg. 12 9 355 566 26 35 - - - -
Calif. 85 68 1,865 1,985 411 536 - 1 - -
Alaska - - 29 15 2 3 - 44 - -
Hawaii 2 2 24 48 2 5 U - U 1
Guam - - 1 1 - - U - U -
P.R. - 3 30 11 106 88 - - - -
V.I. - - - - - 1 U - U -
Amer. Samoa - - - 5 - - U - U -
C.N.M.I. 10 - 1 10 5 1 U - U -
------------------------------------------------------------------------------------------------------------------------------
* Of 88 cases reported among children aged <5 years, serotype was reported for 22 and of those, 5 were type B.
** For imported measles, cases include only those resulting from importation from other countries.
N: Not notifiable U: Unavailable -: no reported cases
============================================================================================================================================
TABLE III. (page 2) Cases of selected notifiable diseases preventable by vaccination, United
States, weeks ending April 13, 1996, and April 15, 1995 (15th Week)
Measles (Rubeola), cont'd.
--------------------------
Total Mumps Pertussis Rubella
-------------------------- -------------------------- --------------------------- ---------------------------
Reporting Area Cum. Cum. Cum. Cum. Cum. Cum. Cum. Cum.
1996 1995 1996 1996 1995 1996 1996 1995 1996 1996 1995
------------------------------------------------------------------------------------------------------------------------------------------
UNITED STATES 70 172 4 166 237 41 705 760 - 43 24
NEW ENGLAND 6 3 - - 3 8 134 114 - 5 2
Maine - - - - 2 - 8 11 - - -
N.H. - - - - - 2 17 6 - - 1
Vt. 1 - - - - - 6 2 - - -
Mass. 4 1 - - - 6 100 89 - 3 1
R.I. - 2 - - - - - - - - -
Conn. 1 - - - 1 - 3 6 - 2 -
MID. ATLANTIC 3 2 - 20 37 5 73 68 - 3 2
Upstate N.Y. - - - 6 9 5 42 38 - 2 -
N.Y. City 3 - - 4 5 - 13 12 - 1 1
N.J. - 2 - - 6 - - 6 - - 1
Pa. - - - 10 17 - 18 12 - - -
E.N. CENTRAL 2 1 1 43 31 2 116 76 - 1 -
Ohio 2 - - 17 15 - 51 32 - - -
Ind. - - - 5 5 - 9 7 - - -
Ill. - - - 9 - 2 45 - - 1 -
Mich. - - 1 12 11 - 9 26 - - -
Wis. - 1 - - - - 2 11 - - -
W.N. CENTRAL 2 1 - 2 14 - 26 48 - 1 -
Minn. 2 - - - 2 - 22 14 - - -
Iowa - - - - 3 - 2 1 - 1 -
Mo. - 1 - - 7 - 1 12 - - -
N. Dak. - - - 2 - - - 5 - - -
S. Dak. - - - - - - 1 6 - - -
Nebr. - - - - 2 - - 3 - - -
Kans. - - - - - - - 7 - - -
S. ATLANTIC 2 - 1 16 40 9 62 75 - - 4
Del. 1 - - - - - 7 5 - - -
Md. 1 - 1 8 9 - 25 - - - -
D.C. - - - - - - - 1 - - -
Va. - - - 3 9 - 3 7 - - -
W. Va. - - - - - - 2 - - - -
N.C. - - - - 16 9 9 49 - - -
S.C. - - - 3 3 - 3 9 - - -
Ga. - - - 1 - - 2 - - - -
Fla. - - - 1 3 - 11 4 - - 4
E.S. CENTRAL - - - 8 8 1 16 20 - 2 -
Ky. - - - - - - 5 1 - - -
Tenn. - - - 1 - 1 7 4 - - -
Ala. - - - 4 3 - 1 15 - - -
Miss. - - - 3 5 - 3 - N N N
W.S. CENTRAL 1 2 - 7 12 1 9 33 - - 1
Ark. - 2 - - 3 - 2 3 - - -
La. - - - 7 2 - 2 1 - - -
Okla. - - - - - - 1 2 - - -
Tex. 1 - - - 7 1 4 27 - - 1
MOUNTAIN 4 56 - 17 11 7 102 199 - 1 3
Mont. - - - - - - 3 3 - - -
Idaho - - - - 2 1 41 59 - - -
Wyo. - - - - - - - - - - -
Colo. 1 17 - - - 3 17 32 - - -
N. Mex. - 28 N N N 3 22 17 - - -
Ariz. - 10 - 1 1 - 4 85 - 1 3
Utah - - - 1 1 - 2 2 - - -
Nev. 3 1 - 15 7 - 13 1 - - -
PACIFIC 50 107 2 53 81 8 167 127 - 30 12
Wash. 4 14 - 5 4 7 42 20 - 1 1
Oreg. - 1 N N N 1 22 7 - - 1
Calif. 1 91 1 38 68 - 95 96 - 27 9
Alaska 44 - 1 2 8 - - - - - -
Hawaii 1 1 U 8 1 U 8 4 U 2 1
Guam - - U 1 2 U - - U - -
P.R. - 3 - 1 1 - - 4 - - -
V.I. - - U - 1 U - - U - -
Amer. Samoa - - U - - U - - U - -
C.N.M.I. - - U - - U - - U - -
------------------------------------------------------------------------------------------------------------------------------------------
N: Not notifiable U: Unavailable -: no reported cases
============================================================================================================================================
Return to top. Table_IV Note: To print large tables and graphs users may have to change their printer settings to landscape and use a small font size.
TABLE IV. Deaths in 121 U.S. cities* week ending
April 13, 1996 (15th Week)
===================================================================================================================================
All Causes, By Age (Years)
------------------------------------------------------------------------ P&I**
Reporting Area All Ages >=65 45-64 25-44 1-24 <1 Total
---------------------------------------------------------------------------------------------------------------
NEW ENGLAND 635 436 112 49 27 10 38
Boston, Mass. 139 82 29 11 13 3 5
Bridgeport, Conn. 37 30 1 3 2 1 1
Cambridge, Mass. 14 9 4 1 - - 2
Fall River, Mass. 34 29 4 1 - - -
Hartford, Conn. 64 41 15 4 3 1 -
Lowell, Mass. 28 23 2 2 1 - 3
Lynn, Mass. 12 8 2 2 - - -
New Bedford, Mass. 30 24 2 4 - - 2
New Haven, Conn. 38 20 10 6 1 1 2
Providence, R.I. 72 48 13 6 3 2 8
Somerville, Mass. 9 7 2 - - - -
Springfield, Mass. 62 41 13 3 4 1 7
Waterbury, Conn. 38 26 9 3 - - 4
Worcester, Mass. 58 48 6 3 - 1 4
MID. ATLANTIC 2,419 1,611 486 240 43 39 116
Albany, N.Y. 46 36 5 5 - - 6
Allentown, Pa. 19 19 - - - - -
Buffalo, N.Y. 87 60 12 11 3 1 3
Camden, N.J. 33 21 7 3 2 - 1
Elizabeth, N.J. 13 8 4 1 - - -
Erie, Pa.*** 46 41 4 - - 1 5
Jersey City, N.J. 38 26 5 6 - 1 1
New York City, N.Y. 1,230 800 258 126 21 25 51
Newark, N.J. 61 31 20 6 3 1 1
Paterson, N.J. 31 18 5 4 - 4 2
Philadelphia, Pa. 400 235 97 55 8 5 22
Pittsburgh, Pa.*** 51 42 7 2 - - 3
Reading, Pa. 13 12 - - 1 - -
Rochester, N.Y. 125 94 22 6 3 - 7
Schenectady, N.Y. 23 21 2 - - - 1
Scranton, Pa.*** 33 26 6 1 - - 2
Syracuse, N.Y. 84 60 16 6 1 1 4
Trenton, N.J. 40 27 7 5 1 - 3
Utica, N.Y. 18 14 4 - - - 2
Yonkers, N.Y. 28 20 5 3 - - 2
E.N. CENTRAL 2,265 1,508 470 192 58 34 147
Akron, Ohio 45 35 6 1 2 1 1
Canton, Ohio 49 39 8 1 1 - 4
Chicago, Ill. 485 280 122 58 14 8 27
Cincinnati, Ohio 112 79 19 7 4 3 16
Cleveland, Ohio 208 139 42 17 7 3 7
Columbus, Ohio 175 117 42 9 5 2 21
Dayton, Ohio 126 94 24 8 - - 7
Detroit, Mich. 192 120 37 28 6 1 6
Evansville, Ind. 48 36 10 2 - - 3
Fort Wayne, Ind. 82 55 17 3 4 3 7
Gary, Ind. 15 8 3 3 1 - -
Grand Rapids, Mich. 52 39 8 4 - 1 3
Indianapolis, Ind. 213 135 48 19 7 4 9
Madison, Wis. U U U U U U U
Milwaukee, Wis. 131 89 25 11 2 4 8
Peoria, Ill. 33 18 12 2 1 - 3
Rockford, Ill. 50 38 8 3 1 - 4
South Bend, Ind. 58 45 9 3 - 1 4
Toledo, Ohio 129 98 20 6 3 2 14
Youngstown, Ohio 62 44 10 7 - 1 3
W.N. CENTRAL 741 513 130 62 12 15 61
Des Moines, Iowa 69 51 14 3 1 - 10
Duluth, Minn. 21 17 1 3 - - 1
Kansas City, Kans. 43 31 6 5 1 - 1
Kansas City, Mo. 113 69 22 9 2 2 7
Lincoln, Nebr. 31 23 6 - 2 - 6
Minneapolis, Minn. 146 110 17 14 2 3 4
Omaha, Nebr. 93 55 19 14 2 3 7
St. Louis, Mo. 102 68 23 5 2 4 18
St. Paul, Minn. 50 38 8 3 - 1 6
Wichita, Kans. 73 51 14 6 - 2 1
S. ATLANTIC 1,267 764 269 159 42 29 63
Atlanta, Ga. 193 111 37 34 4 7 6
Baltimore, Md. 189 113 38 30 5 3 16
Charlotte, N.C. 96 68 18 7 2 1 7
Jacksonville, Fla. 123 76 27 14 2 2 1
Miami, Fla. 109 62 28 13 4 2 -
Norfolk, Va. 63 34 19 5 4 1 4
Richmond, Va. 73 43 20 8 1 1 1
Savannah, Ga. 44 24 8 6 5 1 7
St. Petersburg, Fla. 54 40 9 5 - - 5
Tampa, Fla. 171 110 27 18 8 6 12
Washington, D.C. 141 78 33 19 6 5 4
Wilmington, Del. 11 5 5 - 1 - -
E.S. CENTRAL 799 579 134 62 17 7 67
Birmingham, Ala. 120 87 19 10 2 2 5
Chattanooga, Tenn. 99 69 15 9 3 3 6
Knoxville, Tenn. 61 44 15 1 1 - 9
Lexington, Ky. 76 50 17 4 3 2 9
Memphis, Tenn. 182 135 25 17 5 - 16
Mobile, Ala. 55 44 3 6 2 - 7
Montgomery, Ala. 59 45 11 2 1 - 3
Nashville, Tenn. 147 105 29 13 - - 12
W.S. CENTRAL 1,600 978 343 172 69 38 110
Austin, Tex. 61 39 11 7 1 3 2
Baton Rouge, La. 46 24 10 4 2 6 2
Corpus Christi, Tex. 56 35 9 5 2 5 1
Dallas, Tex. 185 106 44 27 5 3 7
El Paso, Tex. 56 39 13 1 2 1 1
Ft. Worth, Tex. 106 71 19 7 4 5 8
Houston, Tex. 462 255 110 64 27 6 49
Little Rock, Ark. 74 49 15 3 7 - 5
New Orleans, La. 159 72 43 28 11 5 -
San Antonio, Tex. 224 158 40 17 6 3 19
Shreveport, La. 28 21 7 - - - 1
Tulsa, Okla. 143 109 22 9 2 1 15
MOUNTAIN 994 694 179 81 28 12 86
Albuquerque, N.M. 125 89 22 11 3 - 10
Colo. Springs, Colo. 57 44 8 4 - 1 4
Denver, Colo. 96 53 21 13 7 2 2
Las Vegas, Nev. 218 147 54 13 3 1 19
Ogden, Utah 27 20 5 - - 2 4
Phoenix, Ariz. 193 134 32 19 6 2 20
Pueblo, Colo. 20 16 3 1 - - 3
Salt Lake City, Utah 109 73 18 8 7 3 9
Tucson, Ariz. 149 118 16 12 2 1 15
PACIFIC 2,131 1,466 346 212 60 45 158
Berkeley, Calif. 11 7 1 3 - - -
Fresno, Calif. 106 72 22 4 3 5 3
Glendale, Calif. 47 32 6 2 6 1 10
Honolulu, Hawaii 91 67 10 7 3 3 10
Long Beach, Calif. 88 58 17 8 3 2 18
Los Angeles, Calif. 716 474 116 87 23 15 27
Pasadena, Calif. 30 20 7 1 2 - 2
Portland, Oreg. 123 94 17 7 3 2 10
Sacramento, Calif. 181 131 31 15 1 3 17
San Diego, Calif. 164 112 21 16 6 9 12
San Francisco, Calif. 126 78 23 23 1 1 8
San Jose, Calif. 176 123 36 10 4 3 20
Santa Cruz, Calif. 32 23 4 4 1 - 5
Seattle, Wash. 135 89 25 18 3 - 1
Spokane, Wash. 48 38 6 4 - - 8
Tacoma, Wash. 57 48 4 3 1 1 7
TOTAL 12,851**** 8,549 2,469 1,229 356 229 846
---------------------------------------------------------------------------------------------------------------
* Mortality data in this table are voluntarily reported from 121 cities in the United States, most of which have populations
of 100,000 or more. A death is reported by the place of its occurrence and by the week that the death certificate was
filed. Fetal deaths are not included.
** Pneumonia and influenza.
*** Because of changes in reporting methods in these 3 Pennsylvania cities, these numbers are partial counts for the current
week. Complete counts will be available in 4 to 6 weeks.
**** Total includes unknown ages.
U: Unavailable -: no reported cases
===================================================================================================================================
Return to top. Disclaimer All MMWR HTML versions of articles are electronic conversions from ASCII text into HTML. This conversion may have resulted in character translation or format errors in the HTML version. Users should not rely on this HTML document, but are referred to the electronic PDF version and/or the original MMWR paper copy for the official text, figures, and tables. An original paper copy of this issue can be obtained from the Superintendent of Documents, U.S. Government Printing Office (GPO), Washington, DC 20402-9371; telephone: (202) 512-1800. Contact GPO for current prices. **Questions or messages regarding errors in formatting should be addressed to mmwrq@cdc.gov.Page converted: 09/19/98 |
|||||||||
This page last reviewed 5/2/01
|