 |
|
|
|
|
|
|
| ||||||||||
|
|
|
|
|
|
|
||||
| ||||||||||
|
|
|
|
|
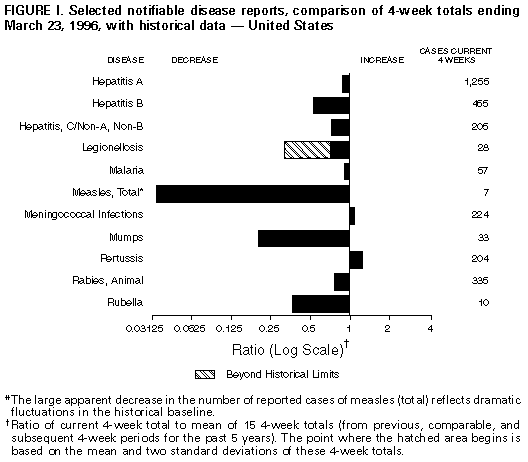
Persons using assistive technology might not be able to fully access information in this file. For assistance, please send e-mail to: mmwrq@cdc.gov. Type 508 Accommodation and the title of the report in the subject line of e-mail. Notifiable Diseases/Deaths in Selected Cities Weekly InformationFigure_I Selected notifiable disease reports, comparison of 4-week totals ending March 23, 1996, with historical data -- United States Table_I Summary -- cases of selected notifiable diseases, United States, cumulative, week ending March 23, 1996 (12th Week) Table_II Cases of selected notifiable diseases, United States, weeks ending March 23, 1996 and March 25, 1995 (12th Week) Table_III Cases of selected notifiable diseases preventable by vaccination, United States, weeks ending March 23, 1996 and March 25, 1995 (12th Week) Table_IV Deaths in 121 U.S. cities, week ending
March 23, 1996 (12th Week)
TABLE I. Summary -- cases of specified notifiable diseases, United States,
cumulative, week ending March 23, 1996 (12th Week)
============================================================================
                                             Cum. 1996
------------------------------------------------------
Anthrax                                              -
Brucellosis                                          9
Cholera                                              1
Congenital rubella syndrome                          -
Cryptosporidiosis*                                 289
Diphtheria                                           1
Encephalitis:  California*                           -
               eastern equine*                       1
               St. Louis*                            -
               western equine*                       -
Hansen Disease                                      22
Hantavirus pulmonary syndrome*+                      1
HIV infection, pediatric*&                          49
Plague                                               -
Poliomyelitis, paralytic@                            -
Psittacosis                                          4
Rabies, human                                        -
Rocky Mountain spotted fever (RMSF)                 19
Streptococcal toxic shock syndrome*                  9
Syphilis, congenital**                               -
Tetanus                                              3
Toxic-shock syndrome                                27
Trichinosis                                          6
Typhoid fever                                       47
------------------------------------------------------
 * Not notifiable in all states
 + Updated weekly from reports to the Division of Viral and Rickettsial
   Diseases, National Center for Infectious Diseases (NCID).
 & Updated monthly to the Division of HIV/AIDS Prevention, National
   Center for Prevention Services (NCPS), last update February 27, 1996.
 @ No suspected cases of polio reported for 1996.
** Updated quarterly from reports to the Division of STD Prevention,
   NCPS. First quarter 1996 is not yet available.
-: no reported cases
============================================================================
Return to top. Table_II Note: To print large tables and graphs users may have to change their printer settings to landscape and use a small font size.
TABLE II. (page 1) Cases of selected notifiable diseases, United States, weeks ending
March 23, 1996, and March 25, 1995 (12th Week)
Escherichia
coli O157:H7
------------------- Hepatitis
AIDS* Chlamydia NETSS** PHLIS*** Gonorrhea C\NA,NB Legionellosis
----------------- --------- -------- -------- ------------------- ---------------- -----------------
Reporting Area Cum. Cum. Cum. Cum. Cum. Cum. Cum. Cum. Cum. Cum. Cum.
1996 1995 1996 1996 1996 1996 1995 1996 1995 1996 1995
------------------------------------------------------------------------------------------------------------------------------------------
UNITED STATES 10,058 16,914 47,253 141 50 61,684 88,496 701 912 137 252
NEW ENGLAND 454 808 2,228 20 3 1,746 1,266 16 24 4 3
Maine 8 15 - 3 - 9 16 - - 1 -
N.H. 14 24 142 1 1 33 26 1 2 - -
Vt. 5 6 - 3 2 17 7 9 2 - -
Mass. 250 447 1,545 9 - 534 728 5 20 2 2
R.I. 17 55 541 2 - 144 138 1 - 1 1
Conn. 160 261 - 2 - 1,009 351 - - N N
MID. ATLANTIC 2,863 4,125 6,281 23 14 5,033 10,187 59 85 30 34
Upstate N.Y. 324 277 N 12 9 988 2,014 54 34 7 8
N.Y. City 1,615 2,302 765 - - 1,012 3,524 1 1 - 1
N.J. 554 980 1,247 8 - 703 1,024 - 39 5 9
Pa. 370 566 4,269 N 5 2,330 3,625 4 11 18 16
E.N. CENTRAL 822 1,405 9,064 21 2 10,131 18,882 93 68 46 91
Ohio 250 379 1,907 16 - 1,033 6,124 3 2 21 37
Ind. 91 104 2,124 3 - 1,688 1,893 3 - 11 19
Ill. 315 578 - 2 1 3,989 4,701 7 27 1 13
Mich. 108 270 4,095 - 1 2,909 4,575 80 39 12 12
Wis. 58 74 938 N - 512 1,589 - - 1 10
W.N. CENTRAL 254 391 5,545 14 12 3,802 4,975 84 21 10 32
Minn. 56 91 - 2 8 975 705 - - - -
Iowa 23 20 549 4 1 197 372 56 2 2 7
Mo. 93 146 3,355 1 - 1,943 2,909 26 14 1 23
N. Dak. - - 2 1 1 1 7 - - - -
S. Dak. 3 1 249 - - 40 42 - 1 2 -
Nebr. 22 38 388 1 - 57 250 - 2 5 1
Kans. 57 95 1,002 5 2 589 690 2 2 - 1
S. ATLANTIC 2,485 4,057 11,736 10 1 24,642 25,333 32 59 14 41
Del. 72 69 - - - 357 477 1 - - -
Md. 198 626 1,300 N - 3,159 3,292 - 2 2 10
D.C. 125 236 N - - 1,076 1,359 - - 1 3
Va. 129 326 2,678 N 1 2,184 2,448 1 - 5 2
W. Va. 19 20 - N - 99 141 4 14 1 3
N.C. 34 245 - 4 - 4,706 5,734 8 17 3 7
S.C. 93 167 - 1 - 2,808 2,728 7 1 1 5
Ga. 446 507 2,863 2 - 6,095 4,278 - 9 - 5
Fla. 1,369 1,861 4,895 - - 4,158 4,876 11 16 1 6
E.S. CENTRAL 360 556 4,293 5 1 6,447 10,586 95 350 14 8
Ky. 66 62 - - - 951 1,179 4 7 2 2
Tenn. 141 220 2,225 N 1 2,126 2,881 90 342 6 3
Ala. 90 157 2,027 - - 3,203 4,478 1 1 - 2
Miss. 63 117 41 2 - 167 2,048 - - 6 1
W.S. CENTRAL 956 1,372 1,437 6 1 3,477 8,210 78 42 1 3
Ark. 45 63 - 4 - 656 975 1 - - -
La. 225 286 - N 1 1,898 2,796 29 17 - 1
Okla. 28 83 1,437 1 - 923 701 34 19 1 2
Tex. 658 940 - 1 - - 3,738 14 6 - -
MOUNTAIN 254 558 4,055 18 8 1,641 2,161 140 103 5 27
Mont. 3 8 - - - 4 24 8 4 - 2
Idaho 4 17 356 7 4 20 35 37 13 - 1
Wyo. - 4 149 - - 9 13 41 40 - -
Colo. 85 214 - 6 4 470 727 4 20 4 14
N. Mex. 20 42 - - - 198 274 24 15 - 2
Ariz. 96 135 2,733 N - 734 703 18 5 - 1
Utah 39 37 254 3 - 49 44 6 3 - 2
Nev. 7 101 563 2 - 157 341 2 3 1 5
PACIFIC 1,610 3,642 2,614 24 8 4,765 6,896 104 160 13 13
Wash. 141 282 2,260 4 4 584 635 24 39 1 -
Oreg. 103 110 - 10 - 91 129 2 9 - -
Calif. 1,340 3,143 - 7 - 3,907 5,770 44 103 12 10
Alaska 3 29 N - - 97 216 2 1 - -
Hawaii 23 78 342 N 4 86 146 32 8 - 3
Guam 3 - - N - - 20 - - - -
P.R. 255 638 N N U 93 138 36 33 - -
V.I. 1 14 N N U - 9 - - - -
Amer. Samoa - - - N U - 8 - - - -
C.N.M.I. - - N N U 11 5 - - - -
------------------------------------------------------------------------------------------------------------------------------------------
N: Not notifiable U: Unavailable -: no reported cases C.N.M.I.: Commonwealth of North Mariana Islands
* Updated monthly to the Division of HIV/AIDS Prevention, National Center for Prevention Services, last update February 27, 1996.
** National Electronic Telecommunications System for Surveillance.
*** Public Health Laboratory Information System.
=======================================================================================================================================================
TABLE II. (page 2) Cases of selected notifiable diseases, United States, weeks ending
March 23, 1996, and March 25, 1995 (12th Week)
Meningococcal Syphilis
Lyme Malaria Disease (Primary & Secondary) Tuberculosis Rabies, Animal
---------------- ---------------- ---------------- --------------------- ----------------- ----------------
Reporting Area Cum. Cum. Cum. Cum. Cum. Cum. Cum. Cum. Cum. Cum. Cum. Cum.
1996 1995 1996 1995 1996 1995 1996 1995 1996 1995 1996 1995
-----------------------------------------------------------------------------------------------------------------------------------------------------
UNITED STATES 725 1,030 198 221 835 823 2,339 3,775 2,737 3,113 880 1,484
NEW ENGLAND 36 54 5 11 22 52 46 56 85 66 105 424
Maine - 1 1 - 7 3 - 2 4 - - -
N.H. - 6 - 1 1 10 1 1 3 1 15 56
Vt. - 1 1 - 1 5 - - - - 28 57
Mass. 12 9 3 1 13 17 18 18 30 30 23 169
R.I. 19 - - 2 - - - 1 13 9 10 59
Conn. 5 37 - 7 - 17 27 34 35 26 29 83
MID. ATLANTIC 613 818 55 53 66 82 83 239 450 582 140 389
Upstate N.Y. 255 402 13 9 18 29 3 22 55 64 66 181
N.Y. City 129 29 23 25 11 11 28 134 226 315 - -
N.J. 17 106 16 13 19 25 29 45 115 111 36 64
Pa. 212 281 3 6 18 17 23 38 54 92 38 144
E.N. CENTRAL 7 10 21 27 110 127 415 645 425 374 6 2
Ohio 5 5 4 1 48 32 158 223 68 59 2 1
Ind. 2 4 3 2 11 22 63 59 34 21 1 -
Ill. - 1 4 20 32 37 119 246 274 196 - 1
Mich. - - 7 2 8 21 40 67 39 88 - -
Wis. U U 3 2 11 15 35 50 10 10 3 -
W.N. CENTRAL 26 18 3 7 70 44 112 203 73 101 72 63
Minn. 1 - - 3 4 6 26 13 14 16 4 5
Iowa 14 - 1 - 16 9 4 15 11 15 38 18
Mo. 2 8 1 3 26 15 79 163 31 46 8 8
N. Dak. - - - - 2 - - - 1 - 6 6
S. Dak. - - - - 3 - - - 6 - 10 15
Nebr. - - - 1 8 6 3 4 - 5 1 -
Kans. 9 10 1 - 11 8 - 8 10 19 5 11
S. ATLANTIC 25 97 32 50 145 143 762 1,004 316 500 456 412
Del. 1 9 2 1 2 1 11 6 - 11 14 20
Md. 17 70 13 17 17 6 124 93 58 98 123 97
D.C. - - 2 3 2 1 39 37 16 21 2 2
Va. - 2 6 9 14 20 109 153 25 29 111 78
W. Va. 2 6 - - 4 3 1 1 18 22 15 20
N.C. 4 6 5 4 24 23 221 269 40 37 106 90
S.C. 1 4 1 - 18 21 107 166 40 64 8 32
Ga. - - 3 6 44 39 74 171 3 77 57 64
Fla. - - - 10 20 29 76 108 116 141 20 9
E.S. CENTRAL 5 7 2 3 63 46 618 873 248 221 16 55
Ky. - 1 - - 9 16 39 55 49 40 3 5
Tenn. - 4 1 1 3 8 188 183 45 87 - 26
Ala. - - 1 2 25 13 153 151 91 93 13 23
Miss. 5 2 - - 26 9 238 484 63 1 - 1
W.S. CENTRAL 1 10 6 2 96 89 224 564 197 280 4 36
Ark. 1 - - 1 11 8 52 110 20 39 - 20
La. - - - - 19 13 132 273 - - - 9
Okla. - 9 - - 6 10 40 33 18 32 4 7
Tex. - 1 6 1 60 58 - 148 159 209 - -
MOUNTAIN - 1 15 14 56 65 31 64 87 105 14 13
Mont. - - - 1 1 2 - 3 - 3 - 6
Idaho - - - - 6 3 1 - 2 4 - -
Wyo. - - 2 - 3 1 1 - - - 8 -
Colo. - - 8 8 7 13 12 37 15 5 - -
N. Mex. - - 1 3 12 18 - 1 7 22 1 -
Ariz. - - 1 1 18 23 14 11 50 63 3 6
Utah - - 2 1 3 2 - 2 - 7 - -
Nev. - 1 1 - 6 3 3 10 13 1 2 1
PACIFIC 12 15 59 54 207 175 48 127 856 884 67 90
Wash. - - 1 5 21 22 - 4 50 51 - -
Oreg. 4 1 4 4 37 35 2 4 24 10 - -
Calif. 7 14 51 41 144 116 46 119 737 764 61 87
Alaska - - - 1 3 - - - 15 19 6 3
Hawaii 1 - 3 3 2 2 - - 30 40 - -
Guam - - - - - 1 - 1 - 4 - -
P.R. - - - - 2 10 39 73 20 16 9 17
V.I. - - - - - - - - - - - -
Amer. Samoa - - - - - - - - - 2 - -
C.N.M.I. - - - - - - 1 - - 10 - -
-----------------------------------------------------------------------------------------------------------------------------------------------------
N: Not notifiable U: Unavailable -: no reported cases
=======================================================================================================================================================
Return to top. Table_III Note: To print large tables and graphs users may have to change their printer settings to landscape and use a small font size.
TABLE III. (page 1) Cases of selected notifiable diseases preventable by vaccination, United
States, weeks ending March 23, 1996, and March 25, 1995 (12th Week)
Hepatitis (Viral), by type Measles (Rubeola)
H. influenzae, --------------------------------------- -------------------------------------
invasive A B Indigenous Imported**
---------------- ----------------- ----------------- --------------- ---------------
Reporting Area Cum. Cum. Cum. Cum. Cum. Cum. Cum. Cum.
1996* 1995 1996 1995 1996 1995 1996 1996 1996 1996
------------------------------------------------------------------------------------------------------------------------------
UNITED STATES 304 327 5,066 5,656 1,495 1,984 1 41 - 2
NEW ENGLAND 8 16 55 38 29 58 - 6 - -
Maine - 1 8 6 2 2 - - - -
N.H. 6 1 3 3 - 5 - - - -
Vt. - 1 - 2 2 1 - 1 - -
Mass. 2 4 24 13 4 14 - 4 - -
R.I. - - 2 7 2 7 - - - -
Conn. - 9 18 7 19 29 - 1 - -
MID. ATLANTIC 38 34 330 292 223 223 - 1 - 1
Upstate N.Y. 10 10 72 69 65 67 - - - -
N.Y. City 4 5 165 121 135 42 - 1 - 1
N.J. 16 8 66 57 4 78 - - - -
Pa. 8 11 27 45 19 36 - - - -
E.N. CENTRAL 48 62 444 845 168 274 - - - -
Ohio 31 34 233 485 27 22 - - - -
Ind. 2 7 86 42 22 56 - - - -
Ill. 12 18 35 171 13 78 - - - -
Mich. 2 3 71 89 101 98 - - - -
Wis. 1 - 19 58 5 20 - - - -
W.N. CENTRAL 11 14 424 241 122 140 - - - -
Minn. 1 3 12 12 2 5 - - - -
Iowa 5 1 125 10 54 14 - - - -
Mo. 5 8 180 175 48 102 - - - -
N. Dak. - - 5 3 - 1 - - - -
S. Dak. - - 25 3 - 1 - - - -
Nebr. - 1 45 16 3 8 - - - -
Kans. - 1 32 22 15 9 - - - -
S. ATLANTIC 62 79 179 246 260 272 - 2 - -
Del. 1 - 3 3 1 1 - 1 - -
Md. 17 26 43 49 72 60 - 1 - -
D.C. - - 6 2 3 8 - - - -
Va. 3 11 31 46 29 23 - - - -
W. Va. - 2 5 7 8 14 - - - -
N.C. 9 11 26 24 93 82 - - - -
S.C. 2 - 19 6 24 8 - - - -
Ga. 30 15 - 35 - 24 - - - -
Fla. - 14 46 74 30 52 - - - -
E.S. CENTRAL 6 3 218 319 39 233 - - - -
Ky. 2 1 6 19 16 26 - - - -
Tenn. - - 67 243 10 177 - - - -
Ala. 3 2 65 35 13 30 - - - -
Miss. 1 - 80 22 - - - - - -
W.S. CENTRAL 9 13 817 500 113 158 - - - -
Ark. - 1 136 17 13 2 - - - -
La. - 1 14 15 12 15 - - - -
Okla. 9 9 411 122 21 21 - - - -
Tex. - 2 256 346 67 120 - - - -
MOUNTAIN 38 34 723 987 203 131 - 3 - -
Mont. - - 17 14 - 4 - - - -
Idaho 1 2 98 120 25 19 - - - -
Wyo. 16 1 6 30 5 2 - - - -
Colo. 4 4 22 135 8 23 - - - -
N. Mex. 7 5 121 211 91 46 - - - -
Ariz. 5 10 228 200 38 17 - - - -
Utah 3 4 191 243 26 13 - - - -
Nev. 2 8 40 34 10 7 - 3 - -
PACIFIC 84 72 1,876 2,188 338 495 1 29 - 1
Wash. - 4 117 104 18 33 - 4 - -
Oreg. 11 8 264 431 20 27 - - - -
Calif. 71 58 1,454 1,602 296 428 - 1 - -
Alaska - - 20 14 2 2 1 24 - -
Hawaii 2 2 21 37 2 5 - - - 1
Guam - - - 1 - - U - U -
P.R. - 3 25 8 143 64 - - - -
V.I. - - - - - 1 U - U -
Amer. Samoa - - - 5 - - U - U -
C.N.M.I. 10 - 1 8 5 - U - U -
------------------------------------------------------------------------------------------------------------------------------
* Of 69 cases reported among children aged <5 years, serotype was reported for 18 and of those, 4 were type B.
** For imported measles, cases include only those resulting from importation from other countries.
N: Not notifiable U: Unavailable -: no reported cases
============================================================================================================================================
TABLE III. (page 2) Cases of selected notifiable diseases preventable by vaccination, United
States, weeks ending March 23, 1996, and March 25, 1995 (12th Week)
Measles (Rubeola), cont'd.
--------------------------
Total Mumps Pertussis Rubella
-------------------------- -------------------------- --------------------------- ---------------------------
Reporting Area Cum. Cum. Cum. Cum. Cum. Cum. Cum. Cum.
1996 1995 1996 1996 1995 1996 1996 1995 1996 1996 1995
------------------------------------------------------------------------------------------------------------------------------------------
UNITED STATES 43 154 8 134 189 51 439 597 3 37 15
NEW ENGLAND 6 3 - - 3 - 74 83 - 2 2
Maine - - - - 2 - 2 9 - - -
N.H. - - - - - - 13 5 - - 1
Vt. 1 - - - - - 6 2 - - -
Mass. 4 1 - - - - 50 63 - - 1
R.I. - 2 - - - - - - - - -
Conn. 1 - - - 1 - 3 4 - 2 -
MID. ATLANTIC 2 2 1 18 28 2 53 54 - 3 1
Upstate N.Y. - - 1 6 9 2 32 30 - 2 -
N.Y. City 2 - - 3 2 - 9 9 - 1 1
N.J. - 2 - - 4 - - 6 - - -
Pa. - - - 9 13 - 12 9 - - -
E.N. CENTRAL - - 2 38 26 7 82 65 - - -
Ohio - - 2 16 12 5 46 29 - - -
Ind. - - - 5 4 1 7 7 - - -
Ill. - - - 7 - 1 17 - - - -
Mich. - - - 10 10 - 10 24 - - -
Wis. - - - - - - 2 5 - - -
W.N. CENTRAL - 1 - 2 12 - 3 27 - - -
Minn. - - - - - - 1 - - - -
Iowa - - - - 3 - 2 1 - - -
Mo. - 1 - - 7 - - 7 - - -
N. Dak. - - - 2 - - - 5 - - -
S. Dak. - - - - - - - 4 - - -
Nebr. - - - - 2 - - 3 - - -
Kans. - - - - - - - 7 - - -
S. ATLANTIC 2 - 1 14 32 9 39 59 - - 1
Del. 1 - - - - 2 5 3 - - -
Md. 1 - - 7 7 1 21 - - - -
D.C. - - - - - - - 1 - - -
Va. - - 1 3 7 - - - - - -
W. Va. - - - - - - - - - - -
N.C. - - - - 14 - - 46 - - -
S.C. - - - 3 1 1 3 7 - - -
Ga. - - - 1 - 1 2 - - - -
Fla. - - - - 3 4 8 2 - - 1
E.S. CENTRAL - - - 5 6 2 10 16 2 2 -
Ky. - - - - - - 5 1 - - -
Tenn. - - - - - 1 1 2 - - -
Ala. - - - 3 2 - 1 13 - - -
Miss. - - - 2 4 1 3 - N N N
W.S. CENTRAL - 2 2 5 12 - 4 15 - - 1
Ark. - 2 - - 3 - 2 - - - -
La. - - 2 5 2 - 2 1 - - -
Okla. - - - - - - - - - - -
Tex. - - - - 7 - - 14 - - 1
MOUNTAIN 3 54 1 10 9 17 61 176 - - 2
Mont. - - - - - 1 3 3 - - -
Idaho - - - - 1 7 19 49 - - -
Wyo. - - - - - - - - - - -
Colo. - 17 - - - 2 8 32 - - -
N. Mex. - 27 N N N 2 15 7 - - -
Ariz. - 9 - 1 1 - 2 82 - - 2
Utah - - - - 1 - 1 2 - - -
Nev. 3 1 1 9 6 5 13 1 - - -
PACIFIC 30 92 1 42 61 14 113 102 1 30 8
Wash. 4 13 1 4 3 3 26 12 - 1 -
Oreg. - 1 N N N - 16 2 - - 1
Calif. 1 77 - 30 51 11 66 86 1 27 7
Alaska 24 - - 1 6 - - - - - -
Hawaii 1 1 - 7 1 - 5 2 - 2 -
Guam - - U - 1 U - - U - -
P.R. - 3 - 1 1 - - 4 - - -
V.I. - - U - 1 U - - U - -
Amer. Samoa - - U - - U - - U - -
C.N.M.I. - - U - - U - - U - -
------------------------------------------------------------------------------------------------------------------------------------------
N: Not notifiable U: Unavailable -: no reported cases
============================================================================================================================================
Return to top. Table_IV Note: To print large tables and graphs users may have to change their printer settings to landscape and use a small font size.
TABLE IV. Deaths in 121 U.S. cities* week ending
March 23, 1996 (12th Week)
===================================================================================================================================
All Causes, By Age (Years)
------------------------------------------------------------------------ P&I**
Reporting Area All Ages >=65 45-64 25-44 1-24 <1 Total
---------------------------------------------------------------------------------------------------------------
NEW ENGLAND 606 438 98 45 13 12 49
Boston, Mass. 151 98 27 19 3 4 18
Bridgeport, Conn. 41 29 6 5 1 - 3
Cambridge, Mass. 28 22 4 2 - - 6
Fall River, Mass. 20 17 2 1 - - -
Hartford, Conn. 62 41 9 5 3 4 3
Lowell, Mass. 26 20 6 - - - 2
Lynn, Mass. 11 7 1 2 1 - 1
New Bedford, Mass. 30 25 3 1 1 - -
New Haven, Conn. 28 24 2 2 - - 2
Providence, R.I. 63 46 14 1 1 1 2
Somerville, Mass. 4 4 - - - - 1
Springfield, Mass. 50 37 8 3 1 1 1
Waterbury, Conn. 28 19 7 1 1 - 3
Worcester, Mass. 64 49 9 3 1 2 7
MID. ATLANTIC 2,279 1,520 430 239 52 38 97
Albany, N.Y. 62 49 7 5 - 1 5
Allentown, Pa. 23 19 4 - - - 1
Buffalo, N.Y. U U U U U U U
Camden, N.J. 34 18 9 5 - 2 2
Elizabeth, N.J. 16 13 2 1 - - -
Erie, Pa.*** 44 38 5 1 - - 2
Jersey City, N.J. 40 28 7 4 1 - 2
New York City, N.Y. 1,324 848 259 161 36 20 37
Newark, N.J. 71 28 21 18 3 1 5
Paterson, N.J. 29 15 8 3 1 2 4
Philadelphia, Pa. 200 134 43 16 4 3 15
Pittsburgh, Pa.*** 107 76 24 4 1 2 6
Reading, Pa. 16 14 2 - - - -
Rochester, N.Y. 114 92 12 5 2 3 7
Schenectady, N.Y. 19 13 4 2 - - 1
Scranton, Pa.*** 33 29 3 - 1 - 1
Syracuse, N.Y. 99 74 14 7 2 2 7
Trenton, N.J. 32 19 4 6 1 2 2
Utica, N.Y. 16 13 2 1 - - -
Yonkers, N.Y. U U U U U U U
E.N. CENTRAL 2,253 1,569 419 162 44 57 157
Akron, Ohio 58 40 9 6 1 2 -
Canton, Ohio 43 36 4 3 - - 5
Chicago, Ill. 461 300 95 36 13 15 32
Cincinnati, Ohio 228 152 51 15 4 6 16
Cleveland, Ohio 180 116 39 14 3 8 5
Columbus, Ohio 209 142 41 11 8 7 13
Dayton, Ohio 131 97 25 6 1 2 9
Detroit, Mich. 193 129 35 24 3 2 4
Evansville, Ind. 29 27 2 - - - 3
Fort Wayne, Ind. 66 51 10 3 2 - 9
Gary, Ind. 15 12 1 2 - - 1
Grand Rapids, Mich. 56 44 7 2 3 - 6
Indianapolis, Ind. 166 108 36 13 2 7 12
Madison, Wis. U U U U U U U
Milwaukee, Wis. 126 95 18 8 - 5 8
Peoria, Ill. 36 25 8 1 2 - 4
Rockford, Ill. 54 38 10 5 - 1 8
South Bend, Ind. 63 47 12 3 - 1 9
Toledo, Ohio 82 64 8 7 2 1 8
Youngstown, Ohio 57 46 8 3 - - 5
W.N. CENTRAL 861 607 128 72 22 24 53
Des Moines, Iowa 81 62 12 2 1 3 9
Duluth, Minn. 29 23 4 1 - 1 6
Kansas City, Kans. 30 19 5 5 - 1 -
Kansas City, Mo. 119 73 16 13 6 4 3
Lincoln, Nebr. 52 43 6 3 - - 5
Minneapolis, Minn. 173 129 24 12 4 4 18
Omaha, Nebr. 95 64 14 9 3 5 6
St. Louis, Mo. 136 92 20 16 5 3 -
St. Paul, Minn. 58 42 13 3 - - 1
Wichita, Kans. 88 60 14 8 3 3 5
S. ATLANTIC 1,448 910 288 172 41 34 81
Atlanta, Ga. 200 110 48 26 7 9 8
Baltimore, Md. 226 134 45 32 6 7 20
Charlotte, N.C. 91 72 11 5 3 - 6
Jacksonville, Fla. 101 63 21 12 3 2 3
Miami, Fla. 105 59 24 15 5 2 -
Norfolk, Va. 71 43 14 8 3 3 4
Richmond, Va. 101 64 25 8 2 2 6
Savannah, Ga. 59 39 12 5 1 2 6
St. Petersburg, Fla. 61 47 9 5 - - 1
Tampa, Fla. 218 153 40 19 1 4 21
Washington, D.C. 196 107 39 37 10 3 6
Wilmington, Del. 19 19 - - - - -
E.S. CENTRAL 649 428 135 58 10 16 58
Birmingham, Ala. 139 93 28 12 - 4 4
Chattanooga, Tenn. 68 47 15 4 - 2 8
Knoxville, Tenn. 69 55 11 3 - - 15
Lexington, Ky. 60 41 13 4 1 1 6
Memphis, Tenn. U U U U U U U
Mobile, Ala. 103 67 20 11 1 4 13
Montgomery, Ala. 71 50 11 7 2 1 3
Nashville, Tenn. 139 75 37 17 6 4 9
W.S. CENTRAL 1,122 760 206 97 29 30 49
Austin, Tex. 69 47 12 7 3 - 4
Baton Rouge, La. 35 22 7 3 2 1 -
Corpus Christi, Tex. 55 42 4 5 3 1 5
Dallas, Tex. 225 136 53 28 4 4 4
El Paso, Tex. 62 45 8 5 2 2 4
Ft. Worth, Tex. 89 66 13 3 5 2 2
Houston, Tex. U U U U U U U
Little Rock, Ark. 69 44 15 4 1 5 6
New Orleans, La. 190 121 35 24 6 4 -
San Antonio, Tex. 112 85 19 5 1 2 8
Shreveport, La. 73 55 9 6 1 2 5
Tulsa, Okla. 143 97 31 7 1 7 11
MOUNTAIN 938 625 174 90 20 28 60
Albuquerque, N.M. 124 83 25 11 2 3 3
Colo. Springs, Colo. 53 34 12 5 2 - 3
Denver, Colo. 127 88 17 14 2 6 11
Las Vegas, Nev. 138 95 30 9 3 1 7
Ogden, Utah 24 18 4 2 - - 6
Phoenix, Ariz. 170 97 36 24 2 10 13
Pueblo, Colo. 29 18 9 1 1 - 2
Salt Lake City, Utah 113 79 13 10 5 6 7
Tucson, Ariz. 160 113 28 14 3 2 8
PACIFIC 2,132 1,481 371 192 45 41 162
Berkeley, Calif. 24 11 6 6 - 1 1
Fresno, Calif. 70 55 8 4 1 2 7
Glendale, Calif. 33 32 1 - - - 2
Honolulu, Hawaii 72 53 11 5 1 2 9
Long Beach, Calif. 67 39 16 8 2 1 12
Los Angeles, Calif. 800 548 142 85 15 10 44
Pasadena, Calif. 20 16 - 2 1 1 3
Portland, Oreg. 147 107 20 11 5 3 10
Sacramento, Calif. 168 115 36 8 6 3 13
San Diego, Calif. 124 83 23 12 3 3 16
San Francisco, Calif. 149 92 28 22 2 5 13
San Jose, Calif. 169 124 29 9 3 4 16
Santa Cruz, Calif. 35 27 3 4 - 1 1
Seattle, Wash. 129 91 20 9 5 4 3
Spokane, Wash. 44 29 11 4 - - 4
Tacoma, Wash. 81 59 17 3 1 1 8
TOTAL 12,288**** 8,338 2,249 1,127 276 280 766
---------------------------------------------------------------------------------------------------------------
* Mortality data in this table are voluntarily reported from 121 cities in the United States, most of which have populations
of 100,000 or more. A death is reported by the place of its occurrence and by the week that the death certificate was
filed. Fetal deaths are not included.
** Pneumonia and influenza.
*** Because of changes in reporting methods in these 3 Pennsylvania cities, these numbers are partial counts for the current
week. Complete counts will be available in 4 to 6 weeks.
**** Total includes unknown ages.
U: Unavailable -: no reported cases
===================================================================================================================================
Return to top. Disclaimer All MMWR HTML versions of articles are electronic conversions from ASCII text into HTML. This conversion may have resulted in character translation or format errors in the HTML version. Users should not rely on this HTML document, but are referred to the electronic PDF version and/or the original MMWR paper copy for the official text, figures, and tables. An original paper copy of this issue can be obtained from the Superintendent of Documents, U.S. Government Printing Office (GPO), Washington, DC 20402-9371; telephone: (202) 512-1800. Contact GPO for current prices. **Questions or messages regarding errors in formatting should be addressed to mmwrq@cdc.gov.Page converted: 09/19/98 |
|||||||||
This page last reviewed 5/2/01
|