 |
|
|
|
|
|
|
| ||||||||||
|
|
|
|
|
|
|
||||
| ||||||||||
|
|
|
|
|
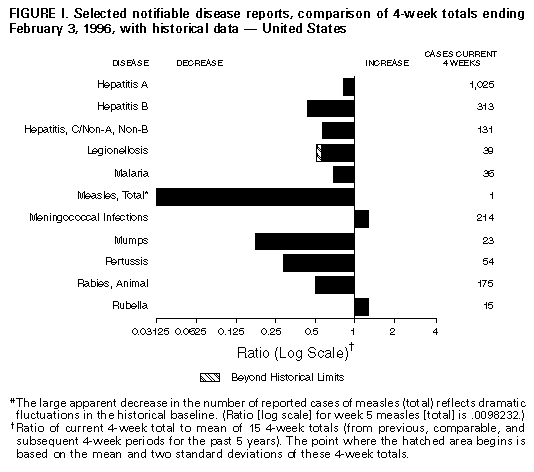
Persons using assistive technology might not be able to fully access information in this file. For assistance, please send e-mail to: mmwrq@cdc.gov. Type 508 Accommodation and the title of the report in the subject line of e-mail. Notifiable Diseases/Deaths in Selected Cities Weekly InformationFigure_I Selected notifiable disease reports, comparison of 4-week totals ending February 3, 1996, with historical data -- United States Table_I Summary -- cases of selected notifiable diseases, United States, cumulative, week ending February 3, 1996 (5th Week) Table_II Cases of selected notifiable diseases, United States, weeks ending February 3, 1996 and February 4, 1995 (5th Week) Table_III Cases of selected notifiable diseases preventable by vaccination, United States, weeks ending February 3, 1996 and February 4, 1995 (5th Week) Table_IV Deaths in 121 U.S. cities, week ending
February 3, 1996 (5th Week)
TABLE I. Summary -- cases of specified notifiable diseases, United States,
cumulative, week ending February 3, 1996 (5th Week)
============================================================================
                                             Cum. 1996
------------------------------------------------------
Anthrax                                              -
Brucellosis                                          4
Cholera                                              -
Congenital rubella syndrome                          -
Cryptosporidiosis*                                  79
Diphtheria                                           -
Encephalitis:  California*                           -
               eastern equine*                       -
               St. Louis*                            -
               western equine*                       -
Hansen Disease                                       3
Hantavirus pulmonary syndrome*+                      -
HIV infection, pediatric*&                          26
Plague                                               -
Poliomyelitis, paralytic@                            -
Psittacosis                                          1
Rabies, human                                        -
Rocky Mountain spotted fever (RMSF)                  4
Streptococcal toxic-shock syndrome*                  -
Syphilis, congenital**                               -
Tetanus                                              -
Toxic-shock syndrome                                11
Trichinosis                                          2
Typhoid fever                                       10
------------------------------------------------------
 * Not notifiable in all states
 + Updated weekly from reports to the Division of Viral and Rickettsial
   Diseases, National Center for Infectious Diseases (NCID).
 & Updated monthly to the Division of HIV/AIDS Prevention, National
   Center for Prevention Services (NCPS), last update January 30, 1996.
 @ No suspected cases of polio reported for 1996.
** Updated quarterly from reports to the Division of STD Prevention,
   NCPS. First quarter 1996 is not yet available.
-: no reported cases
============================================================================
Return to top. Table_II Note: To print large tables and graphs users may have to change their printer settings to landscape and use a small font size.
TABLE II. (page 1) Cases of selected notifiable diseases, United States, weeks ending
February 3, 1996, and February 4, 1995 (5th Week)
Escherichia
coli O157:H7
------------------- Hepatitis
AIDS* Chlamydia NETSS** PHLIS*** Gonorrhea C\NA,NB Legionellosis
----------------- --------- -------- -------- ------------------- ---------------- -----------------
Reporting Area Cum. Cum. Cum. Cum. Cum. Cum. Cum. Cum. Cum. Cum. Cum.
1996 1995 1996 1996 1996 1996 1995 1996 1995 1996 1995
------------------------------------------------------------------------------------------------------------------------------------------
UNITED STATES 4,357 5,498 11,480 56 8 26,446 37,576 209 231 61 97
NEW ENGLAND 208 306 880 12 1 554 659 - 1 4 -
Maine 7 15 - 1 - 3 5 - - - -
N.H. 3 5 59 1 1 11 9 - - - -
Vt. - - - 2 - 12 2 - - - -
Mass. 135 191 621 5 - 226 337 - 1 3 -
R.I. 9 9 200 2 - 49 45 - - 1 -
Conn. 54 86 - 1 - 253 261 - - N N
MID. ATLANTIC 1,235 1,702 871 3 3 701 4,534 14 23 5 12
Upstate N.Y. 158 188 N 2 3 - 920 12 7 - 2
N.Y. City 696 921 - - - - 1,493 1 1 - 1
N.J. 244 364 871 - - 245 379 - 10 - 4
Pa. 137 229 - N - 456 1,742 1 5 5 5
E.N. CENTRAL 419 474 2,977 8 1 4,703 8,102 30 31 28 39
Ohio 143 31 578 5 - 394 2,575 1 1 14 16
Ind. 50 38 - 2 - 785 746 - - 5 7
Ill. 156 243 - 1 - 1,824 1,823 - 11 - 7
Mich. 37 133 2,263 - 1 1,590 2,240 29 19 9 2
Wis. 33 29 136 N - 110 718 - - - 7
W.N. CENTRAL 145 100 1,326 8 2 1,110 2,184 16 7 1 8
Minn. 20 25 - 2 2 - 312 - - - -
Iowa 17 4 - 2 - - 155 15 2 1 2
Mo. 53 50 847 - - 782 1,299 1 2 - 6
N. Dak. - - - - - - - - - - -
S. Dak. 2 - 91 - - 12 16 - 1 - -
Nebr. 15 12 388 - - 57 67 - 1 - -
Kans. 38 9 - 4 - 259 335 - 1 - -
S. ATLANTIC 880 1,328 3,454 7 - 13,368 11,570 7 17 7 22
Del. 32 30 - - - 155 218 - - - -
Md. 69 178 215 N - 926 1,688 - - 1 6
D.C. 64 76 N - - 360 700 - - - -
Va. 36 134 948 N - 919 1,033 - - 2 -
W. Va. 7 4 - N - 45 73 3 5 1 2
N.C. 1 81 - 2 - 1,415 2,544 1 6 3 6
S.C. 13 73 - 1 - 5,444 1,257 1 1 - 2
Ga. 215 234 474 1 - 2,504 2,016 - - - 4
Fla. 443 518 1,817 - - 1,600 2,041 2 5 - 2
E.S. CENTRAL 152 132 664 3 - 2,478 4,535 - 77 9 4
Ky. 43 7 - - - 369 532 - 1 2 1
Tenn. 56 73 659 N - 741 974 - 75 3 1
Ala. 35 34 - 1 - 1,312 2,160 - 1 - 1
Miss. 18 18 5 2 - 56 869 - - 4 1
W.S. CENTRAL 495 370 - 2 - 903 1,817 48 4 - 1
Ark. 19 20 - 1 - 218 310 - - - -
La. 113 90 - N - 685 1,235 2 - - -
Okla. 1 35 - 1 - - 58 42 4 - 1
Tex. 362 225 - - - - 214 4 - - -
MOUNTAIN 120 172 361 5 - 549 866 56 18 2 7
Mont. 2 7 - - - 2 13 3 2 - 1
Idaho 1 5 129 1 - 8 9 21 3 - -
Wyo. - 1 65 - - 5 6 12 6 - -
Colo. 54 75 - 2 - 201 275 3 5 2 1
N. Mex. 8 7 - - - 94 127 10 - - -
Ariz. 37 38 - N - 190 275 3 2 - 1
Utah 17 5 68 1 - 26 19 4 - - 2
Nev. 1 34 99 1 - 23 142 - - - 2
PACIFIC 703 914 947 8 1 2,080 3,309 38 53 5 4
Wash. 65 91 886 1 1 268 251 2 2 - -
Oreg. 48 58 - 3 - 9 29 2 4 - -
Calif. 580 707 - 2 - 1,736 2,882 23 40 5 2
Alaska 3 18 N - - 49 98 1 - - -
Hawaii 7 40 61 N - 18 49 10 7 - 2
Guam - - - N - - 8 - - - -
P.R. 255 62 N N U 5 59 2 1 - -
V.I. 1 - N N U - - - - - -
Amer. Samoa - - - N U - 3 - - - -
C.N.M.I. - - N N U - 3 - - - -
------------------------------------------------------------------------------------------------------------------------------------------
N: Not notifiable U: Unavailable -: no reported cases C.N.M.I.: Commonwealth of North Mariana Islands
* Updated monthly to the Division of HIV/AIDS Prevention, National Center for Prevention Services, last update January 30, 1996.
** National Electronic Telecommunications System for Surveillance.
*** Public Health Laboratory Information System.
=======================================================================================================================================================
TABLE II. (page 2) Cases of selected notifiable diseases, United States, weeks ending
February 3, 1996, and February 4, 1995 (5th Week)
Meningococcal Syphilis
Lyme Malaria Disease (Primary & Secondary) Tuberculosis Rabies, Animal
---------------- ---------------- ---------------- --------------------- ----------------- ----------------
Reporting Area Cum. Cum. Cum. Cum. Cum. Cum. Cum. Cum. Cum. Cum. Cum. Cum.
1996 1995 1996 1995 1996 1995 1996 1995 1996 1995 1996 1995
-----------------------------------------------------------------------------------------------------------------------------------------------------
UNITED STATES 131 321 52 67 338 282 775 1,500 743 928 247 518
NEW ENGLAND 11 1 3 2 17 20 14 18 22 11 46 143
Maine - - - - 4 2 - - 4 - - -
N.H. - - - - 1 6 - 1 - - 3 21
Vt. - - 1 - 1 1 - - - - 9 18
Mass. 5 1 2 - 4 7 7 8 3 3 13 73
R.I. 6 - - 2 - - - - 5 2 6 -
Conn. - - - - 7 4 7 9 10 6 15 31
MID. ATLANTIC 107 252 2 15 10 30 21 124 43 95 33 139
Upstate N.Y. 1 34 - 2 2 11 - 13 - 13 19 85
N.Y. City 73 27 2 6 4 6 10 86 20 31 - -
N.J. - 43 - 6 - 9 7 15 22 19 7 26
Pa. 33 148 - 1 4 4 4 10 1 32 7 28
E.N. CENTRAL 1 5 7 14 47 48 190 244 175 136 2 1
Ohio 1 3 - - 26 11 77 81 19 27 1 1
Ind. - 1 1 - 4 11 28 21 14 3 - -
Ill. - 1 1 11 14 17 55 83 127 78 - -
Mich. - - 5 1 3 4 24 32 13 25 - -
Wis. - - - 2 - 5 6 27 2 3 1 -
W.N. CENTRAL 4 6 - 2 30 14 27 81 16 31 19 27
Minn. - - - - - - - 3 3 6 1 -
Iowa 4 - - - 11 5 - 6 3 10 16 7
Mo. - 3 - 2 8 6 24 72 7 7 - 4
N. Dak. - - - - 1 - - - - - 2 4
S. Dak. - - - - 2 - - - - - - 9
Nebr. - - - - 4 1 3 - - - - -
Kans. - 3 - - 4 2 - - 3 8 - 3
S. ATLANTIC 7 48 12 12 60 46 240 382 49 129 119 152
Del. - 7 2 - 1 - 5 3 - 6 8 8
Md. 7 32 2 4 9 - 22 41 3 46 32 39
D.C. - - 1 - 2 1 6 17 - 12 - 1
Va. - 1 3 2 4 3 37 53 - - 35 28
W. Va. - 4 - - 1 - - - 7 12 1 6
N.C. - 3 2 1 6 6 83 101 17 9 15 33
S.C. - 1 - - 11 3 38 61 19 16 5 10
Ga. - - 2 2 22 19 24 60 - 28 23 19
Fla. - - - 3 4 14 25 46 3 - - 8
E.S. CENTRAL - 2 - 1 30 12 212 376 67 65 7 18
Ky. - - - - 6 2 26 24 12 6 - 3
Tenn. - 1 - - - 2 58 60 - 28 - 7
Ala. - - - 1 14 6 49 68 27 31 7 8
Miss. - 1 - - 10 2 79 224 28 - - -
W.S. CENTRAL - - - - 42 16 60 173 12 14 1 15
Ark. - - - - 7 1 20 47 3 6 - 9
La. - - - - 7 4 40 99 - - - 4
Okla. - - - - 2 3 - 13 9 8 1 2
Tex. - - - - 26 8 - 14 - - - -
MOUNTAIN - 1 7 5 31 23 10 20 15 25 2 5
Mont. - - - 1 1 - - - - - - 3
Idaho - - 1 - 3 2 - - 1 2 - -
Wyo. - - - - - 1 - - - - 2 -
Colo. - - 4 2 3 8 6 8 - 2 - -
N. Mex. - - 1 2 8 4 - 5 1 4 - -
Ariz. - - - - 12 7 2 3 13 13 - 2
Utah - - 1 - 2 - - 1 - 3 - -
Nev. - 1 - - 2 1 2 3 - 1 - -
PACIFIC 1 6 21 16 71 73 1 82 344 422 18 18
Wash. - - - - 5 4 - 1 20 26 - -
Oreg. 1 - 2 2 16 13 1 1 5 2 - -
Calif. - 6 19 13 48 55 - 80 303 372 15 18
Alaska - - - 1 1 - - - 9 8 3 -
Hawaii - - - - 1 1 - - 7 14 - -
Guam - - - - - - - - - 4 - -
P.R. - - - - - 2 10 29 - - 1 8
V.I. - - - - - - - - - - - -
Amer. Samoa - - - - - - - - - 1 - -
C.N.M.I. - - - - - - - - - 3 - -
-----------------------------------------------------------------------------------------------------------------------------------------------------
N: Not notifiable U: Unavailable -: no reported cases
=======================================================================================================================================================
Return to top. Table_III Note: To print large tables and graphs users may have to change their printer settings to landscape and use a small font size.
TABLE III. (page 1) Cases of selected notifiable diseases preventable by vaccination, United
States, weeks ending February 3, 1996, and February 4, 1995 (5th Week)
Hepatitis (Viral), by type Measles (Rubeola)
H. influenzae, --------------------------------------- -------------------------------------
invasive A B Indigenous Imported**
---------------- ----------------- ----------------- --------------- ---------------
Reporting Area Cum. Cum. Cum. Cum. Cum. Cum. Cum. Cum.
1996* 1995 1996 1995 1996 1995 1996 1996 1996 1996
------------------------------------------------------------------------------------------------------------------------------
UNITED STATES 102 129 1,640 1,913 451 640 1 1 - 1
NEW ENGLAND 5 1 20 12 2 20 1 1 - -
Maine - - 3 3 - 1 - - - -
N.H. 4 - 1 - - - - - - -
Vt. - 1 - - - - - - - -
Mass. 1 - 9 2 1 2 1 1 - -
R.I. - - 2 2 1 2 - - - -
Conn. - - 5 5 - 15 - - - -
MID. ATLANTIC 10 15 82 95 55 48 - - - -
Upstate N.Y. 5 4 3 8 7 12 - - - -
N.Y. City 2 2 71 48 42 7 - - - -
N.J. - 4 - 19 - 16 - - - -
Pa. 3 5 8 20 6 13 - - - -
E.N. CENTRAL 15 33 154 343 51 104 - - - -
Ohio 14 19 96 184 12 6 - - - -
Ind. - 2 25 22 1 25 - - - -
Ill. 1 10 2 76 2 31 - - - -
Mich. - 2 31 39 35 36 - - - -
Wis. - - - 22 1 6 - - - -
W.N. CENTRAL 7 4 111 76 37 51 - - - -
Minn. - - - 4 - - - - - -
Iowa 6 1 48 6 21 5 - - - -
Mo. 1 3 36 58 8 44 - - - -
N. Dak. - - 1 - - - - - - -
S. Dak. - - 6 - - - - - - -
Nebr. - - 10 3 2 2 - - - -
Kans. - - 10 5 6 - - - - -
S. ATLANTIC 17 24 63 77 88 82 - - - -
Del. - - 1 1 - 1 - - - -
Md. 2 8 19 23 28 18 - - - -
D.C. - - 1 1 1 7 - - - -
Va. - 3 3 20 5 9 - - - -
W. Va. - - 2 3 3 7 - - - -
N.C. 3 9 12 9 37 26 - - - -
S.C. 1 - 7 1 4 2 - - - -
Ga. 11 4 - - - - - - - -
Fla. - - 18 19 10 12 - - - -
E.S. CENTRAL 2 1 59 42 5 82 - - - -
Ky. - - 4 9 - 11 - - - -
Tenn. - - - 15 - 62 - - - -
Ala. 2 1 7 14 5 9 - - - -
Miss. - - 48 4 - - - - - -
W.S. CENTRAL 6 1 197 58 18 11 - - - -
Ark. - - 48 - 2 - - - - -
La. - - 5 1 2 3 - - - -
Okla. 6 1 98 46 6 7 - - - -
Tex. - - 46 11 8 1 - - - -
MOUNTAIN 9 12 283 374 81 43 - - - -
Mont. - - 7 8 - 2 - - - -
Idaho 1 - 50 39 10 2 - - - -
Wyo. - 1 1 6 - - - - - -
Colo. 1 - 14 69 9 15 - - - -
N. Mex. 3 2 57 91 41 14 - - - -
Ariz. 2 6 59 62 7 5 - - - -
Utah 1 1 76 86 8 1 - - - -
Nev. 1 2 19 13 6 4 - - - -
PACIFIC 31 38 671 836 114 199 - - - 1
Wash. - 1 22 11 5 2 - - - -
Oreg. 2 4 113 168 1 13 U - U -
Calif. 27 31 524 645 105 181 - - - -
Alaska - - 2 9 2 1 - - - -
Hawaii 2 2 10 3 1 2 - - - 1
Guam - - - - - - U - U -
P.R. - - 11 - 8 7 - - - -
V.I. - - - - - - U - U -
Amer. Samoa - - - 2 - - U - U -
C.N.M.I. - - - 1 - - U - U -
------------------------------------------------------------------------------------------------------------------------------
* Of 21 cases reported among children aged <5 years, serotype was reported for 6 and of those, 1 was type B.
** For imported measles, cases include only those resulting from importation from other countries.
N: Not notifiable U: Unavailable -: no reported cases
============================================================================================================================================
TABLE III. (page 2) Cases of selected notifiable diseases preventable by vaccination, United
States, weeks ending February 3, 1996, and February 4, 1995 (5th Week)
Measles (Rubeola), cont'd.
--------------------------
Total Mumps Pertussis Rubella
-------------------------- -------------------------- --------------------------- ---------------------------
Reporting Area Cum. Cum. Cum. Cum. Cum. Cum. Cum. Cum.
1996 1995 1996 1996 1995 1996 1996 1995 1996 1996 1995
------------------------------------------------------------------------------------------------------------------------------------------
UNITED STATES 2 25 12 41 68 19 78 252 - 11 7
NEW ENGLAND 1 3 - - - - 7 34 - 2 1
Maine - - - - - - 1 5 - - -
N.H. - - - - - - 1 - - - -
Vt. - - - - - - 1 2 - - -
Mass. 1 1 - - - - 4 26 - - 1
R.I. - 2 - - - - - - - - -
Conn. - - - - - - - 1 - 2 -
MID. ATLANTIC - - - 1 9 2 5 10 - - -
Upstate N.Y. - - - 1 2 2 5 5 - - -
N.Y. City - - - - 1 - - 3 - - -
N.J. - - - - - - - 2 - - -
Pa. - - - - 6 - - - - - -
E.N. CENTRAL - - 1 12 14 8 26 19 - - -
Ohio - - - 5 7 5 19 16 - - -
Ind. - - - - - 1 1 - - - -
Ill. - - - - - - - - - - -
Mich. - - 1 7 7 2 6 2 - - -
Wis. - - - - - - - 1 - - -
W.N. CENTRAL - - - 2 8 - - 9 - - -
Minn. - - - - - - - - - - -
Iowa - - - - 1 - - 1 - - -
Mo. - - - - 7 - - 3 - - -
N. Dak. - - - 2 - - - - - - -
S. Dak. - - - - - - - - - - -
Nebr. - - - - - - - - - - -
Kans. - - - - - - - 5 - - -
S. ATLANTIC - - 1 2 9 2 8 33 - - -
Del. - - - - - - - 1 - - -
Md. - - - - 2 1 5 - - - -
D.C. - - - - - - - 1 - - -
Va. - - - - 3 - - - - - -
W. Va. - - - - - - - - - - -
N.C. - - - - 3 - - 30 - - -
S.C. - - - 1 - 1 2 1 - - -
Ga. - - 1 1 - - 1 - - - -
Fla. - - - - 1 - - - - - -
E.S. CENTRAL - - 2 3 3 - 1 3 - - -
Ky. - - - - - - - - - - -
Tenn. - - - - - - - - - - -
Ala. - - 2 3 2 - 1 3 - - -
Miss. - - - - 1 - - - N N N
W.S. CENTRAL - - - 1 1 1 2 2 - - -
Ark. - - - - 1 - 1 - - - -
La. - - - 1 - 1 1 - - - -
Okla. - - - - - - - - - - -
Tex. - - - - - - - 2 - - -
MOUNTAIN - 22 - 6 2 4 14 101 - - -
Mont. - - - - - - - 2 - - -
Idaho - - - - - 1 1 36 - - -
Wyo. - - - - - - - - - - -
Colo. - 15 - - - - - 15 - - -
N. Mex. - 3 N N N 1 8 3 - - -
Ariz. - 4 - - - 2 2 45 - - -
Utah - - - - 1 - - - - - -
Nev. - - - 6 1 - 3 - - - -
PACIFIC 1 - 8 14 22 2 15 41 - 9 6
Wash. - - 1 1 1 2 3 - - - -
Oreg. - - N N N U 12 - U - -
Calif. - - 3 7 19 - - 39 - 9 6
Alaska - - 1 1 2 - - - - - -
Hawaii 1 - 3 5 - - - 2 - - -
Guam - - U - - U - - U - -
P.R. - - - - - - - - - - -
V.I. - - U - - U - - U - -
Amer. Samoa - - U - - U - - U - -
C.N.M.I. - - U - - U - - U - -
------------------------------------------------------------------------------------------------------------------------------------------
N: Not notifiable U: Unavailable -: no reported cases
============================================================================================================================================
Return to top. Table_IV Note: To print large tables and graphs users may have to change their printer settings to landscape and use a small font size.
TABLE IV. Deaths in 121 U.S. cities* week ending
February 3, 1996 (5th Week)
===================================================================================================================================
All Causes, By Age (Years)
------------------------------------------------------------------------ P&I**
Reporting Area All Ages >=65 45-64 25-44 1-24 <1 Total
---------------------------------------------------------------------------------------------------------------
NEW ENGLAND 613 429 123 35 16 10 31
Boston, Mass. 190 116 46 13 11 4 6
Bridgeport, Conn. 50 35 13 2 - - 4
Cambridge, Mass. 20 14 4 1 1 - 1
Fall River, Mass. 36 32 1 2 1 - 1
Hartford, Conn. U U U U U U U
Lowell, Mass. 28 25 3 - - - 4
Lynn, Mass. 16 7 4 4 1 - -
New Bedford, Mass. 31 26 5 - - - 3
New Haven, Conn. 40 23 8 5 2 2 3
Providence, R.I. 50 37 10 1 - 2 -
Somerville, Mass. 9 5 3 1 - - -
Springfield, Mass. 48 32 14 2 - - 4
Waterbury, Conn. 36 33 2 1 - - 2
Worcester, Mass. 59 44 10 3 - 2 3
MID. ATLANTIC 2,537 1,674 508 259 41 55 133
Albany, N.Y. 45 26 11 6 1 1 2
Allentown, Pa. 29 26 3 - - - -
Buffalo, N.Y. U U U U U U U
Camden, N.J. 41 27 8 4 1 1 1
Elizabeth, N.J. 20 12 6 1 - 1 1
Erie, Pa.*** 42 33 8 1 - - 4
Jersey City, N.J. 62 45 8 2 2 5 3
New York City, N.Y. 1,416 914 292 165 18 27 53
Newark, N.J. 79 30 21 19 6 3 4
Paterson, N.J. 31 19 7 1 2 2 3
Philadelphia, Pa. 300 185 70 31 4 10 15
Pittsburgh, Pa.*** 91 62 14 9 5 1 9
Reading, Pa. 23 19 3 1 - - 4
Rochester, N.Y. 130 107 17 5 1 - 17
Schenectady, N.Y. 21 16 3 2 - - 2
Scranton, Pa.*** 39 33 6 - - - -
Syracuse, N.Y. 104 78 17 5 1 3 12
Trenton, N.J. 51 31 13 6 - 1 2
Utica, N.Y. 13 11 1 1 - - 1
Yonkers, N.Y. U U U U U U U
E.N. CENTRAL 2,521 1,717 486 188 62 68 191
Akron, Ohio 50 41 5 3 - 1 -
Canton, Ohio 26 18 5 2 1 - 5
Chicago, Ill. 435 268 103 33 15 16 39
Cincinnati, Ohio 157 103 32 12 3 7 17
Cleveland, Ohio 160 103 36 11 4 6 1
Columbus, Ohio 218 134 52 21 7 4 19
Dayton, Ohio 162 123 26 9 2 2 20
Detroit, Mich. 231 140 39 36 9 7 9
Evansville, Ind. 41 32 6 2 1 - 3
Fort Wayne, Ind. 58 46 8 2 1 1 1
Gary, Ind. 21 11 5 2 2 1 -
Grand Rapids, Mich. 63 45 9 2 3 4 11
Indianapolis, Ind. 375 249 75 30 7 14 31
Madison, Wis. 70 52 11 4 2 1 7
Milwaukee, Wis. 141 107 30 4 - - 7
Peoria, Ill. 43 34 6 2 1 - 1
Rockford, Ill. 64 51 10 2 - 1 12
South Bend, Ind. 37 28 3 4 1 1 1
Toledo, Ohio 107 85 15 5 1 1 6
Youngstown, Ohio 62 47 10 2 2 1 1
W.N. CENTRAL 791 584 115 44 17 26 61
Des Moines, Iowa 71 53 14 4 - - 13
Duluth, Minn. 34 29 5 - - - 1
Kansas City, Kans. 32 23 5 4 - - 1
Kansas City, Mo. 102 63 17 9 1 7 4
Lincoln, Nebr. 35 28 4 1 1 1 3
Minneapolis, Minn. 172 132 26 6 1 7 20
Omaha, Nebr. 94 67 15 4 3 5 5
St. Louis, Mo. 99 75 14 4 2 4 7
St. Paul, Minn. 77 59 11 3 3 1 4
Wichita, Kans. 75 55 4 9 6 1 3
S. ATLANTIC 1,183 762 230 128 39 24 79
Atlanta, Ga. 245 139 57 29 10 10 4
Baltimore, Md. 121 77 17 21 5 1 14
Charlotte, N.C. 76 44 16 12 4 - 8
Jacksonville, Fla. 119 72 27 13 6 1 7
Miami, Fla. 125 77 26 16 4 2 1
Norfolk, Va. 55 38 10 5 - 2 5
Richmond, Va. 96 56 20 10 6 4 6
Savannah, Ga. 50 36 10 2 2 - 10
St. Petersburg, Fla. 62 51 8 2 - 1 3
Tampa, Fla. 211 152 39 15 2 3 21
Washington, D.C. U U U U U U U
Wilmington, Del. 23 20 - 3 - - -
E.S. CENTRAL 761 542 118 67 19 11 60
Birmingham, Ala. 149 97 26 15 4 3 7
Chattanooga, Tenn. 97 70 16 9 2 - 6
Knoxville, Tenn. 106 80 13 9 2 2 10
Lexington, Ky. 73 53 14 5 1 - 9
Memphis, Tenn. U U U U U U U
Mobile, Ala. 151 111 19 12 5 4 12
Montgomery, Ala. 61 42 13 4 2 - 4
Nashville, Tenn. 124 89 17 13 3 2 12
W.S. CENTRAL 1,663 1,089 325 149 57 42 127
Austin, Tex. 58 38 7 9 4 - 4
Baton Rouge, La. 61 35 12 11 1 2 -
Corpus Christi, Tex. 60 40 14 4 1 1 4
Dallas, Tex. 182 116 36 17 10 3 8
El Paso, Tex. 146 102 28 8 5 2 5
Ft. Worth, Tex. 133 80 23 20 6 4 15
Houston, Tex. 438 273 98 41 12 14 45
Little Rock, Ark. 68 43 15 3 1 6 5
New Orleans, La. 74 40 6 15 9 4 -
San Antonio, Tex. 257 182 53 14 5 3 24
Shreveport, La. 78 68 6 1 2 1 11
Tulsa, Okla. 108 72 27 6 1 2 6
MOUNTAIN 1,019 690 194 86 23 25 101
Albuquerque, N.M. 93 58 18 11 4 2 6
Colo. Springs, Colo. 63 47 11 3 1 1 7
Denver, Colo. 109 75 18 8 2 6 13
Las Vegas, Nev. 207 141 42 19 4 1 21
Ogden, Utah 26 20 3 3 - - 2
Phoenix, Ariz. 195 117 40 19 9 9 28
Pueblo, Colo. 24 19 3 2 - - 2
Salt Lake City, Utah 119 85 23 7 3 1 9
Tucson, Ariz. 183 128 36 14 - 5 13
PACIFIC 1,349 921 227 135 32 34 152
Berkeley, Calif. 25 15 4 6 - - 1
Fresno, Calif. 99 71 11 8 4 5 13
Glendale, Calif. U U U U U U U
Honolulu, Hawaii 94 65 17 6 3 3 8
Long Beach, Calif. 96 63 23 7 2 1 21
Los Angeles, Calif. U U U U U U U
Pasadena, Calif. 37 32 4 - 1 - 5
Portland, Oreg. 148 108 16 11 6 7 14
Sacramento, Calif. U U U U U U U
San Diego, Calif. 154 100 20 23 5 6 25
San Francisco, Calif. 154 94 29 27 1 3 19
San Jose, Calif. 237 168 47 16 3 3 26
Santa Cruz, Calif. 34 26 4 2 2 - 2
Seattle, Wash. 130 77 29 18 4 2 6
Spokane, Wash. 51 33 13 4 - 1 3
Tacoma, Wash. 90 69 10 7 1 3 9
TOTAL 12,437**** 8,408 2,326 1,091 306 295 935
---------------------------------------------------------------------------------------------------------------
* Mortality data in this table are voluntarily reported from 121 cities in the United States, most of which have populations
of 100,000 or more. A death is reported by the place of its occurrence and by the week that the death certificate was
filed. Fetal deaths are not included.
** Pneumonia and influenza.
*** Because of changes in reporting methods in these 3 Pennsylvania cities, these numbers are partial counts for the current
week. Complete counts will be available in 4 to 6 weeks.
**** Total includes unknown ages.
U: Unavailable -: no reported cases
===================================================================================================================================
Return to top. Disclaimer All MMWR HTML versions of articles are electronic conversions from ASCII text into HTML. This conversion may have resulted in character translation or format errors in the HTML version. Users should not rely on this HTML document, but are referred to the electronic PDF version and/or the original MMWR paper copy for the official text, figures, and tables. An original paper copy of this issue can be obtained from the Superintendent of Documents, U.S. Government Printing Office (GPO), Washington, DC 20402-9371; telephone: (202) 512-1800. Contact GPO for current prices. **Questions or messages regarding errors in formatting should be addressed to mmwrq@cdc.gov.Page converted: 09/19/98 |
|||||||||
This page last reviewed 5/2/01
|