 |
|
|
|
|
|
|
| ||||||||||
|
|
|
|
|
|
|
||||
| ||||||||||
|
|
|
|
|
Persons using assistive technology might not be able to fully access information in this file. For assistance, please send e-mail to: mmwrq@cdc.gov. Type 508 Accommodation and the title of the report in the subject line of e-mail. Injury Surveillance in Correctional Facilities -- Michigan, April 1994-March 1995Following an outbreak of Legionnaires disease in a Michigan prison in 1993 (1), which was first recognized at a civilian hospital, the Michigan Department of Public Health (MDPH) recommended that surveillance for acute infectious diseases be established in the Michigan Department of Corrections (MDOC). In April 1994, MDOC and MDPH implemented a pilot system to monitor trends and detect clusters of selected acute infectious diseases and injury in six Michigan state correctional facilities. This report summarizes the findings of injury surveillance during April 1994-March 1995. In each facility, the nurse in charge of the clinic submitted daily reports by electronic mail of the number of inmates with acute unintentional injury (occurring during recreational, occupational, and other activities) and acute intentional injury (assault and self-inflicted). Of the 34 MDOC facilities, reporting sources were clinics in five facilities (one for females {F}; one regional prison for housing near families {R}; one for young men {aged 15-25 years} {Y}; one with a 25% prevalence of chronic disease {C}; and one in the upper peninsula of Michigan {U}) and the emergency department (ED) of the MDOC hospital serving one large facility and facility C. These sites accounted for approximately 10,000 of the 38,000 prisoners statewide. However, prisoners at facility C and the facility served by the ED were able to use services at other clinics, which were not reporting sources in the pilot system. Incidence rates per 1000 prisoners were calculated based on annual average prisoner populations. During April 1994-March 1995, a total of 3176 new injury-related visits was reported. The number of reported unintentional injuries (2502) was nearly fourfold greater than that for intentional injuries (674). Nearly half (1446 {46%}) of all unintentional injuries were associated with recreational activities (Table_1). Temporal peaks in assault injuries coincided with, or were preceded by, peaks in recreational injuries (Figure_1). The high incidence of recreational and occupational injuries at two facilities (Y and F) prompted investigations by facility staff. Based on a review of 30 consecutive recreational injuries at facility Y in July 1994, participation in basketball accounted for more than one third (11) of all recreational injuries that month; other activities resulting in injuries were softball (five), weight lifting (three), volleyball (one), and soccer (one); the activities for nine were unspecified. The most serious injury, which had been sustained in the weight-training area, was a fractured humerus requiring surgery. These findings enabled the development of recommendations for improved training and supervision of prisoners during recreational activities. Based on a review of the 25 occupational injuries reported at facility F during April-June 1994, most injuries were burns incurred by prisoners while they removed dishes from the oven in a kitchen. Following this investigation, the food-service supervisor instituted a safety training program to prevent occupational injuries in this setting, and numbers of occupational injuries decreased to 13, 10, and three during the three subsequent quarters, respectively. Reported by: L Green, MD, C Hutchinson, MD, D Lamb, Michigan Dept of Corrections. D Johnson, MD, K Wilcox, MD, State Epidemiologist, Michigan Dept of Public Health. Div of Field Epidemiology, Epidemiology Program Office, CDC. Editorial NoteEditorial Note: During the first year of operation, the pilot disease and injury surveillance system in Michigan prisons suggested the occurrence of high annual rates (greater than 500 per 1000) of new injury-related visits in some facilities. The co-incidence of peaks in assault and recreational injury suggests a possible association between recreational events and subsequent assaults, or that some prisoners reported assault as recreational injury to avoid official investigation or retribution by the perpetrator(s). Based on data from the National Hospital Ambulatory Medical Care Survey and the National Ambulatory Medical Care Survey (2), the total rate of injury-related visits at facilities Y and U was 1.7 and 2.4 times higher, respectively, than the estimated comparable age- and sex-specific rates of new injury-related visits to emergency departments and physicians' offices, after excluding traffic injuries. However, these higher rates may reflect differences in thresholds for seeking health care. The findings from the pilot surveillance system in Michigan are subject to at least three limitations. First, because only injuries resulting in a health-care visit were counted, actual injury incidence was probably higher than that documented in the system. Second, because prisoners at facility C and facilities served by the ED could use other clinics, injury rates for these facilities were underestimated. Third, to ensure simplicity of this system, only counts of different types of injuries were collected without information on cause. The injury component of the pilot surveillance system recognizes that injury control is a national priority (3) and responds to recommendations of the National Research Council to establish injury surveillance systems in prisons (4). The information obtained through surveillance in Michigan prisons was used by facility staff to undertake investigations of the high level of specific types of injury in their facilities. Although this surveillance system was not continued when the pilot was completed in March 1994, MDOC plans to reinstate surveillance when its health-care-visit logs for the system statewide are computerized in late 1996 or early 1997. To increase the effectiveness of injury-prevention efforts, more detailed information on injury severity, circumstance, and cause should be collected, particularly from high-incidence facilities; such efforts will require a team approach involving health-care and custody staff. References
Table_1 Note: To print large tables and graphs users may have to change their printer settings to landscape and use a small font size.
TABLE 1. Number and annual rate * of new injury-related visits in correctional facilities +, by facility and
type of injury -- Michigan, April 1994-March 1995
=============================================================================================================================
                                   Unintentional Injury                        Intentional Injury
                      ------------------------------------------------   ---------------------------------
                                                                                      Self
                      Recreational  Occupational     Other     Total      Assault   inflicted     Total      Total
                      ------------  ------------  ---------- ---------   ---------  ----------  ---------  ------------
Facility  Population & No.    Rate  No.     Rate  No.   Rate No.  Rate   No.  Rate  No.  Rate   No.  Rate  No.  Rate
-----------------------------------------------------------------------------------------------------------------------------
F            562       49      87   51       91    83   132  183   326    11   26     2    5     13   23   196   349
R           1303      213     163   32       25    61    47  306   235    41   31     6    5     47   36   353   271
Y           1311      297     227   79       60   135   103  511   390   153  117    32   24    185  141   696   531
C           1000        8       8   13       13    20    20   41    41     2    2     0   --      2    2    43    43
U           1053      344     327   20       19   151   126  515   489    91   86    37   35    128  122   643   611
ED          6000      535      89  185       31   226    38  946   158   120   20   179   30    299   50  1245   208
-----------------------------------------------------------------------------------------------------------------------------
* Per 1000 prisoners.
+ Includes clinics of one for females (F), one regional prison for housing near families (R), one for young men (aged 15-25
  years) (Y), one with a 25% prevalence of chronic disease (C), one in the upper peninsula of Michigan (U), and the emergency
  department (ED) of a hospital serving one large facility and facility C.
& Average annual population.
=============================================================================================================================
Return to top. Figure_1 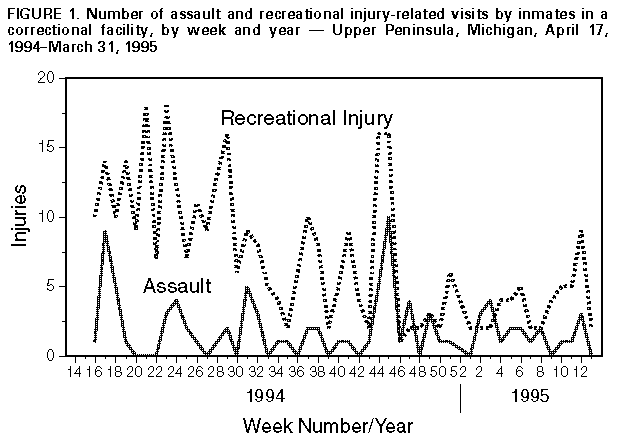 Return to top. Disclaimer All MMWR HTML versions of articles are electronic conversions from ASCII text into HTML. This conversion may have resulted in character translation or format errors in the HTML version. Users should not rely on this HTML document, but are referred to the electronic PDF version and/or the original MMWR paper copy for the official text, figures, and tables. An original paper copy of this issue can be obtained from the Superintendent of Documents, U.S. Government Printing Office (GPO), Washington, DC 20402-9371; telephone: (202) 512-1800. Contact GPO for current prices. **Questions or messages regarding errors in formatting should be addressed to mmwrq@cdc.gov.Page converted: 09/19/98 |
|||||||||
This page last reviewed 5/2/01
|