 |
|
|
|
|
|
|
| ||||||||||
|
|
|
|
|
|
|
||||
| ||||||||||
|
|
|
|
|
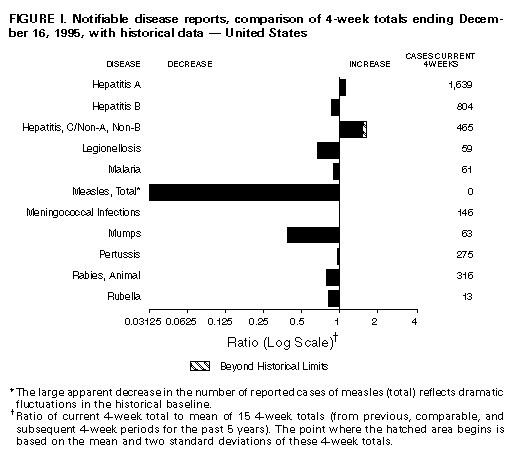
Persons using assistive technology might not be able to fully access information in this file. For assistance, please send e-mail to: mmwrq@cdc.gov. Type 508 Accommodation and the title of the report in the subject line of e-mail. Notifiable Diseases/Deaths in Selected Cities Weekly InformationFigure_I Notifiable disease reports, comparison of 4-week totals ending December 16, 1995, with historical data -- United States Table_I Summary -- cases of specified notifiable diseases, United States, cumulative, week ending December 16, 1995 (50th Week) Table_II Cases of selected notifiable diseases, United States, weeks ending December 16, 1995 and December 17, 1994 (50th Week) Table_III Deaths in 121 U.S. cities, week ending
December 16, 1995 (50th Week)
TABLE I. Summary -- cases of specified notifiable diseases, United States,
cumulative, week ending December 16, 1995 (50th Week)
============================================================================
                                             Cum. 1995
------------------------------------------------------
Anthrax                                              -
Brucellosis                                         85
Cholera                                             16
Congenital rubella syndrome                          7
Diphtheria                                           -
Haemophilus influenzae*                          1,114
Hansen Disease                                     133
Plague                                               7
Poliomyelitis, Paralytic                             -
Psittacosis                                         66
Rabies, human                                        2
Rocky Mountain Spotted Fever                       563
Syphilis, congenital, age less than 1 year **      469
Tetanus                                             33
Toxic shock syndrome                               173
Trichinosis                                         27
Typhoid fever                                      315
------------------------------------------------------
 * Of 1,084 cases of known age, 262 (24) were reported among children
   less than 5 years of age.
** Updated quarterly from reports to the Division of STD Prevention,
   National Center for Prevention Services. This total through third
   quarter 1995.
-: no reported cases
============================================================================
Return to top. Table_II Note: To print large tables and graphs users may have to change their printer settings to landscape and use a small font size.
TABLE II. (page 1) Cases of selected notifiable diseases, United States, weeks ending
December 16, 1995, and December 17, 1994 (50th Week)
Hepatitis (Viral), by type
--------------------------------------------------------------
AIDS* Gonorrhea A B C/NA,NB Legionellosis
------ ------------------- ----------------- ----------------- ---------------- ----------------
Reporting Area Cum. Cum. Cum. Cum. Cum. Cum. Cum. Cum. Cum. Cum. Cum.
1995 1995 1994 1995 1994 1995 1994 1995 1994 1995 1994
------------------------------------------------------------------------------------------------------------------------------------------
UNITED STATES 65,705 336,133 389,459 27,940 24,338 9,701 11,085 4,197 3,916 1,128 1,486
NEW ENGLAND 3,119 6,085 7,753 298 280 194 326 108 143 37 75
Maine 81 82 89 30 24 12 11 - - 6 5
N.H. 87 109 104 11 17 21 27 14 11 2 -
Vt. 30 66 35 6 14 1 12 1 16 1 1
Mass. 1,339 2,767 3,130 131 102 86 177 86 96 23 52
R.I. 214 533 457 34 27 8 8 7 20 5 17
Conn. 1,368 2,528 3,938 86 96 66 91 - - N N
MID. ATLANTIC 17,668 33,526 43,515 1,714 1,623 1,259 1,486 470 446 187 247
Upstate N.Y. 2,127 3,852 10,599 465 520 389 361 262 212 55 58
N.Y. City 9,225 11,818 15,473 779 634 386 385 1 4 5 7
N.J. 4,158 5,592 5,089 266 278 305 364 167 193 28 44
Pa. 2,158 12,264 12,354 204 191 179 376 40 37 99 138
E.N. CENTRAL 4,940 69,794 79,957 2,931 2,626 1,022 1,169 337 311 319 422
Ohio 1,017 19,330 22,243 1,732 1,106 108 161 15 23 149 192
Ind. 499 7,943 8,841 174 358 243 209 17 9 78 46
Ill. 2,054 20,101 23,810 496 598 220 298 67 78 27 41
Mich. 1,039 17,228 17,502 358 333 393 408 238 201 35 82
Wis. 331 5,192 7,561 171 231 58 93 - - 30 61
W.N. CENTRAL 1,555 18,416 21,719 1,814 1,170 596 659 129 90 112 102
Minn. 347 2,686 3,322 179 233 63 64 4 17 6 3
Iowa 94 1,475 1,557 80 64 46 26 13 13 21 33
Mo. 713 10,662 11,880 1,240 600 406 504 73 29 55 41
N. Dak. 5 28 37 24 6 4 1 8 1 4 4
S. Dak. 18 217 222 84 37 2 4 1 - 4 1
Nebr. 101 854 1,060 55 121 31 29 12 13 14 14
Kans. 277 2,494 3,641 152 109 44 31 18 17 8 6
S. ATLANTIC 16,629 100,343 103,511 1,306 1,283 1,582 1,999 588 430 172 350
Del. 279 2,163 1,930 9 22 8 14 - 2 2 31
Md. 2,409 9,514 17,675 220 191 253 342 4 20 31 79
D.C. 976 4,645 6,852 21 27 19 52 - 2 5 7
Va. 1,400 9,850 13,180 217 183 109 129 21 25 20 14
W. Va. 116 631 806 24 22 53 45 44 44 4 4
N.C. 951 22,915 27,052 107 139 286 276 61 54 32 27
S.C. 868 11,780 12,518 44 39 49 33 19 10 30 16
Ga. 2,144 19,036 U 54 42 63 545 15 203 14 110
Fla. 7,486 19,809 23,498 610 618 742 563 424 70 34 62
E.S. CENTRAL 2,093 39,655 44,921 1,835 708 790 1,176 891 911 44 82
Ky. 267 4,727 5,008 42 195 65 75 32 31 10 9
Tenn. 843 13,275 14,883 1,491 317 616 1,014 857 861 24 44
Ala. 562 15,974 14,133 86 122 109 87 2 19 7 13
Miss. 421 5,679 10,897 216 74 - - - - 3 16
W.S. CENTRAL 5,626 34,289 46,970 4,680 3,104 1,506 1,292 382 317 20 45
Ark. 243 4,655 6,464 616 201 80 37 5 8 3 9
La. 972 10,282 11,555 151 151 212 166 178 181 3 14
Okla. 256 4,955 4,521 1,239 364 232 128 87 57 6 11
Tex. 4,155 14,397 24,430 2,674 2,388 982 961 112 71 8 11
MOUNTAIN 2,071 8,399 9,835 3,993 4,959 801 647 453 433 111 94
Mont. 22 67 84 164 24 23 20 16 13 4 16
Idaho 43 137 92 341 366 95 74 50 68 3 2
Wyo. 15 49 86 103 31 27 23 185 163 12 5
Colo. 631 2,677 3,479 496 560 134 96 62 77 40 19
N. Mex. 155 984 1,041 778 1,068 299 208 51 45 5 4
Ariz. 635 3,566 3,154 1,233 2,061 105 88 50 30 12 17
Utah 143 131 298 666 615 80 81 18 18 17 7
Nev. 427 788 1,601 212 234 38 57 21 19 18 24
PACIFIC 12,004 25,626 31,278 9,369 8,585 1,951 2,331 839 835 126 69
Wash. 855 2,462 2,783 798 1,029 187 225 206 256 21 12
Oreg. 426 364 991 2,164 1,109 108 146 31 43 - -
Calif. 10,441 21,302 25,950 6,203 6,185 1,616 1,919 482 531 100 53
Alaska 62 652 882 53 206 11 13 3 - - -
Hawaii 220 846 672 151 56 29 28 117 5 5 4
Guam - 77 131 6 23 1 5 - - 1 1
P.R. 2,189 550 486 89 84 489 384 185 193 - -
V.I. 30 6 41 - 3 2 9 - 1 - -
Amer. Samoa - 41 31 6 11 - - - - - -
C.N.M.I. - 42 46 18 12 13 1 - - - -
------------------------------------------------------------------------------------------------------------------------------------------
N: Not nofifiable U: Unavailable -: no reported cases C.N.M.I.: Commonwealth of North Mariana Islands
*Updated monthly to the Division of HIV/AIDS Prevention, National Center for Prevention Services, last update November 30, 1995.
=============================================================================================================================================================================
TABLE II. (page 2) Cases of selected notifiable diseases, United States, weeks ending
December 16, 1995, and December 17, 1994 (50th Week)
Measles (Rubeola)
------------------------------------------------------------
Lyme Malaria Indigenous Imported* Total Meningococcal Mumps
Disease Infections
---------------- --------------- --------------- --------------- --------------- --------------- ---------------
Reporting Area Cum. Cum. Cum. Cum. Cum. Cum. Cum. Cum. Cum. Cum. Cum. Cum.
1995 1994 1995 1994 1995 1995 1995 1995 1995 1994 1995 1994 1995 1994
---------------------------------------------------------------------------------------------------------------------------------------------------------------------------
UNITED STATES 9,055 12,147 1,217 1,087 - 259 - 27 286 915 2,803 2,602 817 1,380
NEW ENGLAND 2,019 2,731 48 72 - 8 - 3 11 27 140 128 11 26
Maine 34 27 7 6 - - - - - 5 15 23 4 3
N.H. 27 30 2 3 - - - - - 1 23 8 1 4
Vt. 9 16 1 3 - - - - - 3 11 4 - -
Mass. 196 208 19 34 - 2 - 2 4 7 47 61 2 3
R.I. 285 471 4 9 - 5 - - 5 7 - - 1 4
Conn. 1,468 1,979 15 17 - 1 - 1 2 4 44 32 3 12
MID. ATLANTIC 5,855 7,538 338 228 - 7 - 5 12 225 309 279 117 114
Upstate N.Y. 2,850 4,644 65 55 - 1 - - 1 26 99 91 27 31
N.Y. City 231 28 183 86 - 2 - 3 5 15 45 32 16 12
N.J. 1,366 1,490 64 51 - 4 - 2 6 175 77 58 17 13
Pa. 1,408 1,376 26 36 - - - - - 9 88 98 57 58
E.N. CENTRAL 88 526 134 105 - 13 - 4 17 103 374 381 169 258
Ohio 53 44 13 15 - 1 - 1 2 17 112 117 51 74
Ind. 20 18 18 14 - - - - - 1 54 50 10 7
Ill. 10 23 63 45 - 4 - 2 6 56 92 119 48 107
Mich. 5 33 26 28 - 6 - 1 7 26 71 58 60 56
Wis. - 408 14 3 U 2 U - 2 3 45 37 - 14
W.N. CENTRAL 271 285 30 45 - 2 - - 2 171 187 166 49 67
Minn. 191 150 10 14 - - - - - - 29 20 8 4
Iowa 15 17 2 5 - - - - - 7 30 21 11 16
Mo. 40 101 8 13 - 1 - - 1 161 76 75 24 42
N. Dak. - - 2 1 - - - - - - 2 1 1 4
S. Dak. - - 2 - - - - - - - 9 9 - -
Nebr. 3 3 3 5 - - - - - 2 16 13 4 1
Kans. 22 14 3 7 - 1 - - 1 1 25 27 1 -
S. ATLANTIC 528 802 238 226 - 11 - 1 12 73 521 380 124 199
Del. 23 105 1 3 - - - - - - 6 5 - -
Md. 293 307 61 81 - - - 1 1 4 38 35 20 64
D.C. 2 9 17 15 - - - - - - 7 6 - -
Va. 54 129 54 37 - - - - - 3 61 66 25 44
W. Va. 23 27 4 - - - - - - 37 9 14 - 3
N.C. 83 77 17 11 - - - - - 3 83 53 41 36
S.C. 17 7 3 5 - - - - - - 57 33 11 8
Ga. 14 121 37 34 - 2 - - 2 4 107 78 10 9
Fla. 19 20 44 40 - 9 - - 9 22 153 90 17 35
E.S. CENTRAL 57 43 27 31 - - - - - 28 180 189 22 29
Ky. 10 24 3 11 - - - - - - 58 38 - -
Tenn. 28 13 10 10 - - - - - 28 42 40 5 8
Ala. 12 6 11 9 - - - - - - 44 75 4 12
Miss. 7 - 3 1 - - - - - - 36 36 13 9
W.S. CENTRAL 114 128 49 75 - 31 - 3 34 19 343 319 53 240
Ark. 10 9 2 3 - 2 - - 2 1 33 44 10 6
La. 7 2 6 10 - 17 - 1 18 1 53 40 13 34
Okla. 48 73 1 7 - - - - - - 41 33 - 23
Tex. 49 44 40 55 - 12 - 2 14 17 216 202 30 177
MOUNTAIN 11 18 61 40 - 66 - 2 68 188 196 172 26 159
Mont. - - 3 - - - - - - - 4 6 1 -
Idaho - 3 1 2 - 1 - 1 2 1 11 17 4 10
Wyo. 3 5 - 1 - - - - - - 8 9 - 3
Colo. - 1 26 18 - 24 - - 24 41 48 39 2 4
N. Mex. 1 5 8 3 - 30 - 1 31 - 37 16 N N
Ariz. 1 - 13 10 - 10 - - 10 3 60 56 2 99
Utah 1 3 6 4 - - - - - 134 17 19 11 28
Nev. 5 1 4 2 - 1 - - 1 9 11 10 6 15
PACIFIC 112 76 292 265 - 121 - 9 130 81 553 588 246 288
Wash. 10 4 21 31 - 16 - 4 20 4 93 90 15 20
Oreg. 14 6 21 17 - - - 1 1 2 105 133 N N
Calif. 88 66 234 200 - 105 - 3 108 61 337 352 205 246
Alaska - - 4 2 - - - - - 10 14 5 13 4
Hawaii - - 12 15 - - - 1 1 4 4 8 13 18
Guam - - - - U - U - - 228 3 - 4 7
P.R. - - 1 5 U 11 U - 11 11 23 7 2 2
V.I. - - - - U - U - - - - - 2 4
Amer. Samoa - - - - - - - - - - - - - 3
C.N.M.I. - - 1 1 U - U - - 29 - - - 2
---------------------------------------------------------------------------------------------------------------------------------------------------------------------------
*For imported measles, cases include only those resulting from importation from other countries.
N: Not notifiable U: Unavailable -: no reported cases
=============================================================================================================================================================================
TABLE II. (page 3) Cases of selected notifiable diseases, United States, weeks ending
December 16, 1995, and December 17, 1994 (50th Week)
Pertussis Rubella Syphilis Tuberculosis Rabies,
(Primary & Animal
Secondary)
--------------------------- -------------------------- ----------------- ----------------- ----------------
Reporting Area Cum. Cum. Cum. Cum. Cum. Cum. Cum. Cum. Cum. Cum.
1995 1995 1994 1995 1995 1994 1995 1994 1995 1994 1995 1994
-----------------------------------------------------------------------------------------------------------------------------------------------------
UNITED STATES 64 4,060 4,132 13 158 218 14,543 20,027 19,068 21,238 6,508 7,409
NEW ENGLAND 8 593 629 - 49 131 247 212 497 497 1,432 1,816
Maine - 48 18 - 1 - 2 4 24 27 45 -
N.H. - 54 90 - 1 - 1 4 18 14 148 211
Vt. - 67 46 - - - - - 4 8 172 140
Mass. 8 393 428 - 7 125 67 90 268 259 397 703
R.I. - 4 7 - - 3 4 15 48 48 315 40
Conn. - 27 40 - 40 3 173 99 135 141 355 722
MID. ATLANTIC 5 392 617 1 14 7 817 1,346 3,903 4,307 1,227 1,996
Upstate N.Y. 2 221 232 1 5 6 42 162 496 580 490 1,485
N.Y. City - 40 176 - 8 - 368 581 2,053 2,460 - -
N.J. - 15 15 - 1 1 175 234 762 779 319 267
Pa. 3 116 194 - - - 232 369 592 488 418 244
E.N. CENTRAL 20 501 569 - 5 10 2,455 2,966 1,812 2,022 91 69
Ohio 14 172 157 - - - 861 1,113 273 331 12 4
Ind. - 73 67 - 1 - 271 259 171 184 13 14
Ill. 6 134 106 - 1 1 872 1,030 922 1,017 15 21
Mich. - 110 93 - 3 9 291 278 376 430 40 14
Wis. U 12 146 U - - 160 286 70 60 11 16
W.N. CENTRAL - 248 221 - 1 2 689 1,140 559 553 346 219
Minn. - 127 100 - - - 37 46 128 129 26 19
Iowa - 12 23 - - - 44 71 65 60 125 85
Mo. - 54 43 - - 2 571 957 225 232 23 27
N. Dak. - 8 5 - - - - 1 5 10 28 14
S. Dak. - 12 26 - - - - 2 26 25 96 39
Nebr. - 12 11 - - - 11 11 21 19 5 -
Kans. - 23 13 - 1 - 26 52 89 78 43 35
S. ATLANTIC - 322 399 12 42 16 3,678 5,224 3,200 3,707 2,057 1,953
Del. - 10 3 - - - 18 25 49 40 88 69
Md. - 40 70 - - - 315 318 289 328 311 509
D.C. - 6 10 - - - 100 210 99 105 11 3
Va. - 31 36 - - - 557 788 283 292 441 418
W. Va. - - 5 - - - 10 9 69 78 112 79
N.C. - 110 140 - 1 - 1,081 1,601 486 514 451 166
S.C. - 27 14 - 1 - 554 775 301 376 119 172
Ga. - 30 30 11 16 2 671 782 319 671 273 359
Fla. - 68 91 1 24 14 372 716 1,305 1,303 251 178
E.S. CENTRAL 2 272 128 - 2 - 3,539 3,823 1,374 1,524 277 219
Ky. - 24 60 - - - 197 204 296 310 28 27
Tenn. - 207 22 - 1 - 883 1,009 404 519 92 71
Ala. 2 38 34 - - - 633 631 403 421 148 117
Miss. - 3 12 N N N 1,826 1,979 271 274 9 4
W.S. CENTRAL - 279 193 - 8 13 2,332 4,216 2,795 2,853 574 651
Ark. - 41 28 - 1 - 466 462 304 251 50 36
La. - 17 12 - - - 983 1,616 111 193 45 69
Okla. - 30 32 - - 4 182 149 334 224 29 38
Tex. - 191 121 - 7 9 701 1,989 2,046 2,185 450 508
MOUNTAIN 10 553 571 - 5 5 204 231 560 560 163 148
Mont. - 9 12 - - - 4 3 10 9 43 22
Idaho - 101 150 - - - - 2 14 12 3 3
Wyo. - 1 - - 1 - 1 2 5 9 25 19
Colo. 6 110 222 - - - 99 117 17 92 9 18
N. Mex. 1 145 33 - - - 31 21 76 66 6 8
Ariz. - 151 116 - 3 - 36 45 311 215 50 56
Utah 3 31 35 - 1 4 4 11 37 51 15 13
Nev. - 5 3 - - 1 29 30 90 106 12 9
PACIFIC 19 900 805 - 32 34 582 869 4,368 5,215 341 338
Wash. 17 351 108 - 2 - 15 32 234 248 7 15
Oreg. 2 61 104 - 2 4 9 36 66 90 1 13
Calif. - 429 574 - 24 26 556 794 3,820 4,562 329 276
Alaska - 1 - - - - 2 3 75 86 4 34
Hawaii - 58 19 - 4 4 - 4 173 229 - -
Guam U 1 2 U - 1 8 3 53 80 - -
P.R. U 15 3 U - - 289 304 195 189 47 74
V.I. U - - U - - 2 28 - - - -
Amer. Samoa - - 1 - - - - 1 5 4 - -
C.N.M.I. U - - U - - 12 2 16 30 - -
-----------------------------------------------------------------------------------------------------------------------------------------------------
U: Unavailable -: no reported cases
=============================================================================================================================================================================
Return to top. Table_III Note: To print large tables and graphs users may have to change their printer settings to landscape and use a small font size.
TABLE III. Deaths in 121 U.S. cities* week ending
December 16, 1995 (50th Week)
===================================================================================================================================
All Causes, By Age (Years)
------------------------------------------------------------------------ P&I**
Reporting Area All Ages >=65 45-64 25-44 1-24 <1 Total
---------------------------------------------------------------------------------------------------------------
NEW ENGLAND 590 415 119 43 7 6 45
Boston, Mass. 144 94 32 13 3 2 20
Bridgeport, Conn. 31 21 6 4 - - 2
Cambridge, Mass. 19 13 3 3 - - -
Fall River, Mass. 36 32 3 1 - - -
Hartford, Conn. 61 37 16 6 1 1 1
Lowell, Mass. 24 20 3 1 - - 3
Lynn, Mass. 13 10 2 - 1 - -
New Bedford, Mass. 21 15 4 2 - - -
New Haven, Conn. 39 23 10 3 1 2 3
Providence, R.I. 64 50 11 2 - 1 6
Somerville, Mass. 6 5 - 1 - - -
Springfield, Mass. 47 33 11 3 - - 5
Waterbury, Conn. 35 26 8 1 - - 2
Worcester, Mass. 50 36 10 3 1 - 3
MID. ATLANTIC 2,588 1,711 506 266 54 50 154
Albany, N.Y. 40 33 5 1 1 - 3
Allentown, Pa. 28 17 6 3 2 - -
Buffalo, N.Y. 102 81 11 6 1 3 12
Camden, N.J. 35 24 4 4 2 1 3
Elizabeth, N.J. 33 22 6 4 1 - -
Erie, Pa.*** 45 33 7 4 1 - 2
Jersey City, N.J. 41 21 8 9 2 1 -
New York City, N.Y. 1,383 879 292 152 28 32 65
Newark, N.J. 83 31 34 11 3 3 10
Paterson, N.J. 28 18 4 5 - 1 -
Philadelphia, Pa. 300 190 64 36 6 4 17
Pittsburgh, Pa.*** 99 72 12 10 2 3 8
Reading, Pa. 15 11 2 1 1 - 3
Rochester, N.Y. 128 103 17 6 1 1 11
Schenectady, N.Y. 19 12 2 4 1 - 1
Scranton, Pa.*** 45 35 8 2 - - 1
Syracuse, N.Y. 100 78 17 3 2 - 11
Trenton, N.J. 37 28 5 3 - 1 7
Utica, N.Y. 27 23 2 2 - - -
Yonkers, N.Y. U U U U U U U
E.N. CENTRAL 2,278 1,548 450 162 54 63 139
Akron, Ohio 77 54 15 4 2 2 -
Canton, Ohio 42 28 12 2 - - 6
Chicago, Ill. 416 246 87 48 16 18 36
Cincinnati, Ohio 171 129 25 8 5 4 16
Cleveland, Ohio 168 104 41 12 5 6 1
Columbus, Ohio 186 133 34 12 5 2 9
Dayton, Ohio 131 98 26 4 1 2 8
Detroit, Mich. 237 145 59 24 4 5 5
Evansville, Ind. 54 42 7 1 1 3 3
Fort Wayne, Ind. 73 49 17 3 3 1 3
Gary, Ind. 13 9 - 4 - - 1
Grand Rapids, Mich. 45 32 10 1 1 1 5
Indianapolis, Ind. 157 105 33 9 2 8 11
Madison, Wis. 62 53 2 5 1 1 4
Milwaukee, Wis. 134 95 23 11 4 1 14
Peoria, Ill. 43 29 10 3 1 - 3
Rockford, Ill. 53 39 8 3 - 3 5
South Bend, Ind. 51 36 12 - - 3 3
Toledo, Ohio 88 62 17 4 3 2 4
Youngstown, Ohio 77 60 12 4 - 1 2
W.N. CENTRAL 855 585 144 72 20 23 41
Des Moines, Iowa 71 53 13 3 1 1 8
Duluth, Minn. 21 17 3 - 1 - 3
Kansas City, Kans. 37 18 6 11 - 2 1
Kansas City, Mo. 120 70 24 9 4 2 5
Lincoln, Nebr. 39 30 7 2 - - 3
Minneapolis, Minn. 180 135 24 11 1 9 6
Omaha, Nebr. 86 59 15 7 3 2 6
St. Louis, Mo. 125 84 23 12 4 2 1
St. Paul, Minn. 64 48 7 5 2 2 4
Wichita, Kans. 112 71 22 12 4 3 4
S. ATLANTIC 1,481 900 295 206 46 31 97
Atlanta, Ga. 173 109 38 22 3 1 6
Baltimore, Md. 297 176 55 50 10 6 34
Charlotte, N.C. 94 61 12 19 2 - 3
Jacksonville, Fla. 130 76 30 17 6 1 11
Miami, Fla. 120 67 30 14 5 4 1
Norfolk, Va. 54 35 9 5 1 3 7
Richmond, Va. 89 56 19 12 2 - 3
Savannah, Ga. 81 61 12 7 - 1 11
St. Petersburg, Fla. 52 39 2 6 - 5 -
Tampa, Fla. 191 118 37 26 4 4 13
Washington, D.C. 194 96 51 28 13 6 8
Wilmington, Del. 6 6 - - - - -
E.S. CENTRAL 871 588 163 68 28 23 65
Birmingham, Ala. 121 75 26 11 3 5 2
Chattanooga, Tenn. 77 49 15 6 5 2 7
Knoxville, Tenn. 77 50 15 9 2 1 13
Lexington, Ky. 93 67 17 4 1 4 7
Memphis, Tenn. 205 154 22 15 11 3 23
Mobile, Ala. 84 51 24 5 2 2 2
Montgomery, Ala. 70 50 15 3 1 1 1
Nashville, Tenn. 144 92 29 15 3 5 10
W.S. CENTRAL 1,502 962 289 146 63 40 117
Austin, Tex. 77 52 10 8 5 2 5
Baton Rouge, La. 48 35 9 2 1 1 4
Corpus Christi, Tex. 37 26 5 4 - 2 2
Dallas, Tex. 223 127 51 25 11 9 11
El Paso, Tex. 64 38 12 8 3 3 9
Ft. Worth, Tex. 94 59 18 9 5 2 13
Houston, Tex. 376 239 74 37 17 9 32
Little Rock, Ark. 64 38 11 10 3 2 7
New Orleans, La. 111 67 26 8 6 4 -
San Antonio, Tex. 224 156 33 23 9 3 23
Shreveport, La. 71 51 16 2 1 1 6
Tulsa, Okla. 113 74 24 10 2 2 5
MOUNTAIN 930 643 159 77 30 21 78
Albuquerque, N.M. 97 62 14 15 5 1 6
Colo. Springs, Colo. 40 25 9 3 1 2 4
Denver, Colo. 119 66 27 17 1 8 6
Las Vegas, Nev. 145 103 26 10 6 - 11
Ogden, Utah 20 18 2 - - - -
Phoenix, Ariz. 210 143 33 16 11 7 27
Pueblo, Colo. 36 26 8 1 - 1 1
Salt Lake City, Utah 109 82 17 7 3 - 10
Tucson, Ariz. 154 118 23 8 3 2 13
PACIFIC 1,166 803 194 113 26 29 132
Berkeley, Calif. 18 14 4 - - - 1
Fresno, Calif. 44 34 7 1 1 1 4
Glendale, Calif. U U U U U U U
Honolulu, Hawaii 73 48 18 6 1 - 10
Long Beach, Calif. 68 49 12 4 1 2 4
Los Angeles, Calif. U U U U U U U
Pasadena, Calif. 37 28 1 3 3 2 3
Portland, Oreg. 107 77 16 10 3 1 9
Sacramento, Calif. U U U U U U U
San Diego, Calif. 158 98 30 20 4 6 25
San Francisco, Calif. 144 99 17 23 1 3 23
San Jose, Calif. 187 129 32 15 5 6 21
Santa Cruz, Calif. 32 22 2 8 - - 8
Seattle, Wash. 135 82 30 17 3 3 3
Spokane, Wash. 59 47 5 3 2 2 9
Tacoma, Wash. 104 76 20 3 2 3 12
TOTAL 12,261 8,155 2,319 1,153 328 286 868
---------------------------------------------------------------------------------------------------------------
* Mortality data in this table are voluntarily reported from 121 cities in the United States, most of which have populations
of 100,000 or more. A death is reported by the place of its occurrence and by the week that the death certificate was
filed. Fetal deaths are not included.
** Pneumonia and influenza.
*** Because of changes in reporting methods in these 3 Pennsylvania cities, these numbers are partial counts for the current
week. Complete counts will be available in 4 to 6 weeks.
**** Total includes unknown ages.
U: Unavailable -: no reported cases
===================================================================================================================================
Return to top. Disclaimer All MMWR HTML versions of articles are electronic conversions from ASCII text into HTML. This conversion may have resulted in character translation or format errors in the HTML version. Users should not rely on this HTML document, but are referred to the electronic PDF version and/or the original MMWR paper copy for the official text, figures, and tables. An original paper copy of this issue can be obtained from the Superintendent of Documents, U.S. Government Printing Office (GPO), Washington, DC 20402-9371; telephone: (202) 512-1800. Contact GPO for current prices. **Questions or messages regarding errors in formatting should be addressed to mmwrq@cdc.gov.Page converted: 09/19/98 |
|||||||||
This page last reviewed 5/2/01
|