 |
|
|
|
|
|
|
| ||||||||||
|
|
|
|
|
|
|
||||
| ||||||||||
|
|
|
|
|
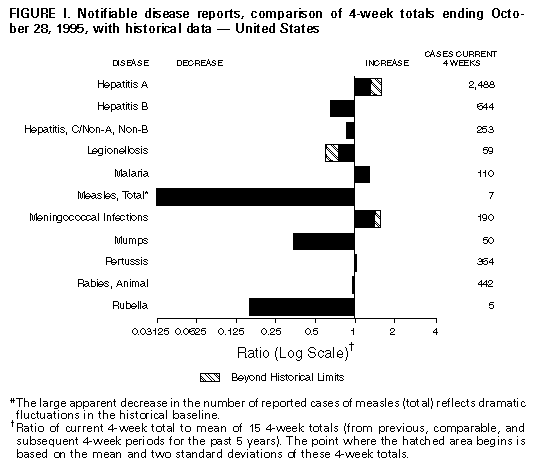
Persons using assistive technology might not be able to fully access information in this file. For assistance, please send e-mail to: mmwrq@cdc.gov. Type 508 Accommodation and the title of the report in the subject line of e-mail. Notifiable Diseases/Deaths in Selected Cities Weekly InformationFigure_I Notifiable disease reports, comparison of 4-week totals ending October 28, 1995, with historical data -- United States Table_I Summary -- cases of specified notifiable diseases, United States, cumulative, week ending October 28, 1995 (43rd Week) Table_II Cases of selected notifiable diseases, United States, weeks ending October 28, 1995 and October 29, 1994 (43rd Week) Table_III Deaths in 121 U.S. cities, week ending
October 28, 1995 (43rd Week)
TABLE I. Summary -- cases of specified notifiable diseases, United States,
cumulative, week ending October 28, 1995 (43rd Week)
============================================================================
                                             Cum. 1995
------------------------------------------------------
Anthrax                                              -
Brucellosis                                         75
Cholera                                             14
Congenital rubella syndrome                          6
Diphtheria                                           -
Haemophilus influenzae*                            968
Hansen Disease                                     112
Plague                                               7
Poliomyelitis, Paralytic                             -
Psittacosis                                         55
Rabies, human                                        2
Rocky Mountain Spotted Fever                       492
Syphilis, congenital, age less than 1 year**       469
Tetanus                                             26
Toxic shock syndrome                               153
Trichinosis                                         26
Typhoid fever                                      273
------------------------------------------------------
 * Of 948 cases of known age, 227 (24) were reported among children
   less than 5 years of age.
** Updated quarterly from reports to the Division of STD Prevention,
   National Center for Prevention Services. This total through third
   quarter 1995.
-: no reported cases
============================================================================
Return to top. Table_II Note: To print large tables and graphs users may have to change their printer settings to landscape and use a small font size.
TABLE II. (page 1) Cases of selected notifiable diseases, United States, weeks ending
October 28, 1995, and October 29, 1994 (43rd Week)
Hepatitis (Viral), by type
--------------------------------------------------------------
AIDS* Gonorrhea A B C/NA,NB Legionellosis
------ ------------------- ----------------- ----------------- ---------------- ----------------
Reporting Area Cum. Cum. Cum. Cum. Cum. Cum. Cum. Cum. Cum. Cum. Cum.
1995 1995 1994 1995 1994 1995 1994 1995 1994 1995 1994
------------------------------------------------------------------------------------------------------------------------------------------
UNITED STATES 54,704 288,473 336,385 23,595 20,290 7,893 9,423 3,123 3,370 993 1,294
NEW ENGLAND 2,653 4,979 7,199 255 247 168 280 19 127 30 69
Maine 81 69 79 27 23 7 11 - - 5 5
N.H. 77 95 95 9 16 18 23 12 9 2 -
Vt. 30 53 31 5 10 1 8 - 12 - -
Mass. 1,137 2,394 2,698 107 91 68 158 - 86 19 48
R.I. 192 441 390 31 21 8 7 7 20 4 16
Conn. 1,136 1,927 3,906 76 86 66 73 - - N N
MID. ATLANTIC 14,696 27,714 37,616 1,385 1,399 1,045 1,226 380 378 162 213
Upstate N.Y. 1,736 3,846 8,614 374 469 323 320 198 179 43 49
N.Y. City 7,624 10,058 13,984 633 541 304 285 1 1 4 7
N.J. 3,575 3,470 4,284 196 240 262 308 143 167 23 37
Pa. 1,761 10,340 10,734 182 149 156 313 38 31 92 120
E.N. CENTRAL 4,122 61,428 67,591 2,363 2,055 752 976 224 277 260 367
Ohio 852 17,515 17,830 1,535 777 91 139 13 20 127 166
Ind. 429 6,816 7,510 147 324 186 173 6 8 62 39
Ill. 1,736 17,294 20,574 217 503 94 259 33 75 13 35
Mich. 825 15,046 15,215 310 253 334 326 172 174 28 72
Wis. 280 4,757 6,462 154 198 47 79 - - 30 55
W.N. CENTRAL 1,266 16,141 18,669 1,549 1,035 495 554 107 73 98 85
Minn. 285 2,508 2,711 164 207 50 53 4 16 6 2
Iowa 71 1,295 1,270 53 56 40 24 12 9 19 29
Mo. 564 9,224 10,320 1,093 523 333 418 65 19 47 31
N. Dak. 6 24 34 23 5 4 - 8 1 4 4
S. Dak. 15 148 187 56 33 2 2 1 - 3 1
Nebr. 84 757 1,060 37 118 26 28 6 12 12 13
Kans. 241 2,185 3,087 123 93 40 29 11 16 7 5
S. ATLANTIC 14,155 87,227 89,961 1,118 1,043 1,205 1,731 293 353 165 315
Del. 241 1,874 1,624 8 21 6 14 1 1 2 31
Md. 2,250 7,471 15,525 187 153 212 296 4 18 29 68
D.C. 827 3,925 6,100 21 18 19 43 - 1 4 7
Va. 1,082 8,797 11,183 176 151 95 112 18 22 18 8
W. Va. 86 566 669 22 17 48 34 43 31 4 3
N.C. 816 20,321 23,551 93 114 253 238 49 53 31 24
S.C. 766 9,852 11,043 41 35 44 28 16 8 31 15
Ga. 1,784 17,369 U 52 28 62 519 13 174 14 106
Fla. 6,303 17,052 20,266 518 506 466 447 149 45 32 53
E.S. CENTRAL 1,763 34,531 38,995 1,632 527 676 968 810 795 43 74
Ky. 221 4,065 4,221 37 139 58 70 22 26 10 9
Tenn. 709 11,410 12,775 1,351 239 523 830 786 754 24 36
Ala. 484 13,839 12,792 73 84 95 68 2 15 6 13
Miss. 349 5,217 9,207 171 65 - - - - 3 16
W.S. CENTRAL 4,691 27,983 40,828 3,879 2,625 1,185 1,071 267 269 17 37
Ark. 209 3,201 5,514 505 158 55 22 4 7 1 6
La. 785 9,150 10,165 111 133 167 144 140 150 3 13
Okla. 206 4,627 3,935 916 303 146 117 43 52 5 11
Tex. 3,491 11,005 21,214 2,347 2,031 817 788 80 60 8 7
MOUNTAIN 1,716 6,948 8,472 3,274 4,057 650 543 348 377 101 73
Mont. 17 59 76 132 19 19 18 13 12 4 14
Idaho 38 99 74 263 301 71 68 41 65 2 1
Wyo. 12 42 75 98 24 23 23 139 141 12 4
Colo. 523 2,380 2,962 454 462 108 85 54 61 37 15
N. Mex. 137 862 859 696 933 250 174 39 45 4 3
Ariz. 545 2,591 2,688 895 1,627 92 60 37 23 9 9
Utah 112 131 240 599 484 57 64 10 16 16 6
Nev. 332 784 1,498 137 207 30 51 15 14 17 21
PACIFIC 9,642 21,522 27,054 8,140 7,302 1,717 2,074 675 721 117 61
Wash. 717 2,273 2,465 700 897 162 191 182 210 20 11
Oreg. 347 249 859 1,982 879 93 135 30 36 - -
Calif. 8,328 17,932 22,373 5,271 5,292 1,440 1,710 424 470 92 47
Alaska 60 591 754 48 186 9 13 1 - - -
Hawaii 190 477 603 139 48 13 25 38 5 5 3
Guam - 66 113 5 22 1 4 - - 1 1
P.R. 1,925 470 422 85 73 459 317 18 154 - -
V.I. 27 6 35 - 3 2 7 - 1 - -
Amer. Samoa - 27 28 6 8 - - - - - -
C.N.M.I. - 42 45 18 8 13 1 - - - -
------------------------------------------------------------------------------------------------------------------------------------------
N: Not nofifiable U: Unavailable -: no reported cases C.N.M.I.: Commonwealth of North Mariana Islands
*Updated monthly to the Division of HIV/AIDS Prevention, National Center for Prevention Services, last update September 28, 1995.
=============================================================================================================================================================================
TABLE II. (page 2) Cases of selected notifiable diseases, United States, weeks ending
October 28, 1995, and October 29, 1994 (43rd Week)
Measles (Rubeola)
------------------------------------------------------------
Lyme Malaria Indigenous Imported* Total Meningococcal Mumps
Disease Infections
---------------- --------------- --------------- --------------- --------------- --------------- ---------------
Reporting Area Cum. Cum. Cum. Cum. Cum. Cum. Cum. Cum. Cum. Cum. Cum. Cum.
1995 1994 1995 1994 1995 1995 1995 1995 1995 1994 1995 1994 1995 1994
---------------------------------------------------------------------------------------------------------------------------------------------------------------------------
UNITED STATES 7,281 10,357 1,030 903 - 250 - 27 277 875 2,487 2,245 675 1,203
NEW ENGLAND 1,678 2,429 41 65 - 7 - 2 9 27 118 106 11 19
Maine 25 18 6 6 - - - - - 5 10 19 4 3
N.H. 21 25 1 3 - - - - - 1 20 8 1 4
Vt. 8 15 1 3 - - - - - 3 9 2 - -
Mass. 170 171 14 29 - 1 - 1 2 7 41 50 2 3
R.I. 285 372 4 8 - 5 - - 5 7 - - 1 2
Conn. 1,169 1,828 15 16 - 1 - 1 2 4 38 27 3 7
MID. ATLANTIC 4,613 6,234 272 179 - 7 - 5 12 221 284 244 96 98
Upstate N.Y. 2,419 3,914 58 46 - 1 - - 1 26 88 80 24 28
N.Y. City 186 22 140 64 - 2 - 3 5 14 39 30 14 8
N.J. 980 1,234 53 40 - 4 - 2 6 173 74 52 13 13
Pa. 1,028 1,064 21 29 - - - - - 8 83 82 45 49
E.N. CENTRAL 68 504 93 93 - 7 - 4 11 102 334 333 129 212
Ohio 46 39 11 15 - 1 - 1 2 17 98 97 46 59
Ind. 14 16 15 12 - - - - - 1 61 42 4 7
Ill. 3 23 32 40 - - - 2 2 56 71 108 37 95
Mich. 5 25 22 23 - 4 - 1 5 25 65 49 42 39
Wis. - 401 13 3 - 2 - - 2 3 39 37 - 12
W.N. CENTRAL 200 272 23 41 - 2 - - 2 170 171 144 41 62
Minn. 129 148 4 13 - - - - - - 27 15 4 4
Iowa 15 15 2 5 - - - - - 7 30 18 9 15
Mo. 35 96 8 12 - 1 - - 1 160 70 68 22 38
N. Dak. - - 1 1 - - - - - - 1 1 1 4
S. Dak. - - 2 - - - - - - - 6 8 - -
Nebr. 2 3 3 4 - - - - - 2 14 13 4 1
Kans. 19 10 3 6 - 1 - - 1 1 23 21 1 -
S. ATLANTIC 470 686 216 195 - 11 - 1 12 65 461 328 91 167
Del. 23 102 1 3 - - - - - - 6 5 - -
Md. 267 218 57 73 - - - 1 1 4 33 29 20 50
D.C. 2 7 16 14 - - - - - - 6 4 - -
Va. 50 121 50 29 - - - - - 3 57 59 21 38
W. Va. 22 23 4 - - - - - - 37 8 12 - 3
N.C. 64 76 15 11 - - - - - 3 71 44 16 35
S.C. 16 7 1 4 - - - - - - 55 25 10 7
Ga. 10 117 31 31 - 2 - - 2 3 89 69 8 9
Fla. 16 15 41 30 - 9 - - 9 15 136 81 16 25
E.S. CENTRAL 41 40 21 31 - - - - - 28 152 159 15 21
Ky. 9 23 2 11 - - - - - - 49 34 - -
Tenn. 20 11 8 10 - - - - - 28 37 29 2 7
Ala. 7 6 8 9 - - - - - - 36 65 4 5
Miss. 5 - 3 1 - - - - - - 30 31 9 9
W.S. CENTRAL 101 108 48 40 - 28 - 3 31 17 305 262 48 213
Ark. 9 8 2 3 - 2 - - 2 1 26 39 9 5
La. 6 1 5 8 - 17 - 1 18 1 43 34 12 27
Okla. 43 62 1 6 - - - - - - 33 26 - 23
Tex. 43 37 40 23 - 9 - 2 11 15 203 163 27 158
MOUNTAIN 11 15 54 28 - 67 - 1 68 164 171 146 25 147
Mont. - - 3 - - - - - - - 2 6 1 -
Idaho - 3 1 2 - - - - - 1 9 16 3 7
Wyo. 3 4 - 1 - - - - - - 7 7 - 2
Colo. - 1 24 12 - 26 - - 26 19 45 29 2 4
N. Mex. 1 5 6 3 - 30 - 1 31 - 34 13 N N
Ariz. 1 - 10 4 U 10 U - 10 1 51 49 2 96
Utah 1 1 6 4 - - - - - 134 15 18 11 25
Nev. 5 1 4 2 - 1 - - 1 9 8 8 6 13
PACIFIC 99 69 262 231 - 121 - 11 132 81 491 523 219 264
Wash. 10 3 21 28 - 16 - 4 20 4 80 81 12 18
Oreg. 9 6 19 14 - - - 3 3 2 92 116 N N
Calif. 80 60 209 173 - 105 - 3 108 61 307 318 187 225
Alaska - - 3 2 - - - - - 10 8 2 13 4
Hawaii - - 10 14 - - - 1 1 4 4 6 7 17
Guam - - - - U - U - - 228 3 - 3 6
P.R. - - 1 4 - 11 - - 11 11 23 7 2 2
V.I. - - - - U - U - - - - - 2 4
Amer. Samoa - - - - - - - - - - - - - 2
C.N.M.I. - - 1 1 U - U - - 29 - - - 2
---------------------------------------------------------------------------------------------------------------------------------------------------------------------------
*For imported measles, cases include only those resulting from importation from other countries.
N: Not notifiable U: Unavailable -: no reported cases
=============================================================================================================================================================================
TABLE II. (page 3) Cases of selected notifiable diseases, United States, weeks ending
October 28, 1995, and October 29, 1994 (43rd Week)
Pertussis Rubella Syphilis Tuberculosis Rabies,
(Primary & Animal
Secondary)
--------------------------- -------------------------- ----------------- ----------------- ----------------
Reporting Area Cum. Cum. Cum. Cum. Cum. Cum. Cum. Cum. Cum. Cum.
1995 1995 1994 1995 1995 1994 1995 1994 1995 1994 1995 1994
-----------------------------------------------------------------------------------------------------------------------------------------------------
UNITED STATES 94 3,343 3,363 - 134 209 12,176 17,591 16,311 18,139 5,823 6,456
NEW ENGLAND 12 455 413 - 47 128 137 180 416 417 1,305 1,598
Maine 1 40 18 - 1 - 2 4 12 23 45 -
N.H. 1 45 68 - 1 - 1 4 18 14 129 171
Vt. - 64 40 - - - - - 2 7 155 120
Mass. 10 277 250 - 7 124 54 77 231 215 381 603
R.I. - 4 5 - - 2 3 12 40 37 286 40
Conn. - 25 32 - 38 2 77 83 113 121 309 664
MID. ATLANTIC 26 300 529 - 13 6 689 1,171 3,366 3,748 1,120 1,711
Upstate N.Y. 24 163 201 - 4 5 43 147 418 490 438 1,276
N.Y. City 2 30 133 - 8 - 332 515 1,797 2,163 - -
N.J. - 14 14 - 1 1 141 198 642 651 295 230
Pa. - 93 181 - - - 173 311 509 444 387 205
E.N. CENTRAL 13 328 500 - 5 9 2,150 2,607 1,614 1,715 73 56
Ohio 5 128 133 - - - 737 1,007 224 282 12 4
Ind. 6 52 55 - 1 - 228 206 198 153 12 12
Ill. 2 73 96 - 1 1 786 887 800 853 3 20
Mich. - 63 78 - 3 8 252 246 331 377 37 12
Wis. - 12 138 - - - 147 261 61 50 9 8
W.N. CENTRAL 5 241 184 - - 2 629 1,003 476 482 292 184
Minn. 5 127 85 - - - 34 40 107 113 20 15
Iowa - 11 18 - - - 39 56 52 51 98 75
Mo. - 53 39 - - 2 519 841 190 207 22 20
N. Dak. - 8 4 - - - - 1 3 9 25 10
S. Dak. - 11 17 - - - - 2 21 22 81 33
Nebr. - 9 9 - - - 11 11 20 17 5 -
Kans. - 22 12 - - - 26 52 83 63 41 31
S. ATLANTIC 7 299 289 - 25 15 3,139 4,587 2,687 3,211 1,827 1,707
Del. - 10 3 - - - 14 24 41 37 74 54
Md. - 35 66 - - - 137 264 241 280 265 466
D.C. - 6 8 - - - 95 189 88 99 11 2
Va. - 19 36 - - - 496 657 202 292 373 353
W. Va. - - 4 - - - 10 9 60 68 102 65
N.C. - 110 58 - 1 - 950 1,406 371 403 412 148
S.C. 2 25 13 - 1 - 497 703 271 316 109 150
Ga. 5 26 24 - - 2 622 692 319 565 243 319
Fla. - 68 77 - 23 13 318 643 1,094 1,151 238 150
E.S. CENTRAL 1 262 124 - - - 3,126 3,276 1,272 1,321 243 165
Ky. 1 20 59 - - - 172 170 250 259 26 20
Tenn. - 204 22 - - - 720 885 336 442 78 34
Ala. - 35 31 - - - 538 563 342 367 130 107
Miss. - 3 12 N N N 1,696 1,658 344 253 9 4
W.S. CENTRAL 8 264 180 - 8 13 1,618 3,810 2,160 2,327 519 586
Ark. - 34 27 - 1 - 82 400 33 204 - 28
La. - 16 10 - - - 865 1,458 6 15 41 62
Okla. - 30 26 - - 4 155 136 326 207 28 32
Tex. 8 184 117 - 7 9 516 1,816 1,795 1,901 450 464
MOUNTAIN 6 464 407 - 5 5 202 210 507 463 156 140
Mont. - 3 8 - - - 4 3 10 9 42 17
Idaho - 90 47 - - - - 1 12 11 3 3
Wyo. - 1 - - 1 - - 1 4 8 24 19
Colo. - 84 197 - - - 98 107 37 61 9 18
N. Mex. 6 105 21 - - - 33 19 66 55 6 7
Ariz. U 149 101 U 3 - 34 39 257 180 49 54
Utah - 27 30 - 1 4 4 11 37 41 15 13
Nev. - 5 3 - - 1 29 29 84 98 8 9
PACIFIC 16 730 737 - 31 31 486 747 3,813 4,455 288 309
Wash. 16 263 99 - 2 - 13 30 202 214 7 15
Oreg. - 46 91 - 2 4 7 33 36 90 - 10
Calif. - 375 530 - 24 23 465 678 3,376 3,881 277 251
Alaska - - - - - - 1 3 59 67 4 33
Hawaii - 46 17 - 3 4 - 3 140 203 - -
Guam U 1 2 U - 1 8 3 38 73 - -
P.R. - 14 2 - - - 253 275 195 167 44 68
V.I. U - - U - - 2 27 - - - -
Amer. Samoa - - 1 - - - - 1 4 4 - -
C.N.M.I. U - - U - - 12 1 16 28 - -
-----------------------------------------------------------------------------------------------------------------------------------------------------
U: Unavailable -: no reported cases
=============================================================================================================================================================================
Return to top. Table_III Note: To print large tables and graphs users may have to change their printer settings to landscape and use a small font size.
TABLE III. Deaths in 121 U.S. cities* week ending
October 28, 1995 (43rd Week)
===================================================================================================================================
All Causes, By Age (Years)
------------------------------------------------------------------------ P&I**
Reporting Area All Ages >=65 45-64 25-44 1-24 <1 Total
---------------------------------------------------------------------------------------------------------------
NEW ENGLAND 644 421 123 68 10 22 36
Boston, Mass. 205 120 41 29 1 14 9
Bridgeport, Conn. 33 24 5 4 - - 2
Cambridge, Mass. 15 12 3 - - - -
Fall River, Mass. 15 12 3 - - - 1
Hartford, Conn. 50 26 14 7 2 1 1
Lowell, Mass. 24 19 2 2 - 1 1
Lynn, Mass. 12 9 2 1 - - 2
New Bedford, Mass. 25 19 4 1 1 - -
New Haven, Conn. 44 32 4 5 - 3 1
Providence, R.I. 56 36 13 6 - 1 4
Somerville, Mass. 4 4 - - - - 1
Springfield, Mass. 54 38 10 1 3 2 8
Waterbury, Conn. 34 26 4 2 2 - 2
Worcester, Mass. 73 44 18 10 1 - 4
MID. ATLANTIC 2,449 1,619 461 267 54 48 124
Albany, N.Y. 55 39 8 5 1 2 5
Allentown, Pa. 18 14 4 - - - -
Buffalo, N.Y. 95 79 10 3 - 3 4
Camden, N.J. 25 17 1 1 3 3 2
Elizabeth, N.J. 14 7 3 3 1 - 1
Erie, Pa.*** 41 34 3 2 2 - 2
Jersey City, N.J. 33 20 7 5 - 1 1
New York City, N.Y. 1,392 894 275 175 33 15 56
Newark, N.J. 55 24 16 13 2 - 3
Paterson, N.J. 27 19 4 3 1 - 3
Philadelphia, Pa. 300 196 52 29 7 16 15
Pittsburgh, Pa.*** 70 46 14 7 1 2 2
Reading, Pa. 9 6 2 1 - - 2
Rochester, N.Y. 125 81 28 10 3 3 12
Schenectady, N.Y. 12 9 3 - - - 1
Scranton, Pa.*** 32 28 4 - - - 1
Syracuse, N.Y. 86 69 12 3 - 2 5
Trenton, N.J. 44 26 12 5 - 1 7
Utica, N.Y. 16 11 3 2 - - 2
Yonkers, N.Y. U U U U U U U
E.N. CENTRAL 2,236 1,532 392 195 60 56 124
Akron, Ohio 55 35 12 6 - 2 -
Canton, Ohio 37 28 7 2 - - 3
Chicago, Ill. 463 274 84 70 19 15 31
Cincinnati, Ohio 78 49 17 4 2 6 3
Cleveland, Ohio 147 93 36 13 3 2 2
Columbus, Ohio 181 120 39 14 6 2 15
Dayton, Ohio 112 81 21 5 2 3 8
Detroit, Mich. 280 199 42 29 8 2 8
Evansville, Ind. 53 41 6 3 2 1 3
Fort Wayne, Ind. 60 43 8 4 4 1 1
Gary, Ind. 14 8 3 3 - - -
Grand Rapids, Mich. 62 51 7 2 1 1 10
Indianapolis, Ind. 215 143 41 14 7 10 11
Madison, Wis. 71 54 10 3 1 3 7
Milwaukee, Wis. 132 102 20 7 - 3 6
Peoria, Ill. 15 11 4 - - - 3
Rockford, Ill. 52 39 6 2 2 3 4
South Bend, Ind. 44 32 6 4 2 - 3
Toledo, Ohio 106 83 13 7 1 2 4
Youngstown, Ohio 59 46 10 3 - - 2
W.N. CENTRAL 795 554 144 55 19 14 45
Des Moines, Iowa 20 11 4 3 1 1 2
Duluth, Minn. 26 20 4 - 2 - 3
Kansas City, Kans. 36 23 5 6 2 - -
Kansas City, Mo. 88 51 17 6 2 3 3
Lincoln, Nebr. 45 36 7 2 - - 2
Minneapolis, Minn. 205 151 38 12 3 1 16
Omaha, Nebr. 84 63 14 2 2 3 6
St. Louis, Mo. 122 84 23 9 2 4 3
St. Paul, Minn. 45 30 8 3 2 2 2
Wichita, Kans. 124 85 24 12 3 - 8
S. ATLANTIC 1,153 704 245 131 31 36 50
Atlanta, Ga. 153 96 34 16 3 4 2
Baltimore, Md. 140 79 34 20 3 4 9
Charlotte, N.C. 96 70 13 10 - 3 9
Jacksonville, Fla. 135 85 32 16 - 2 8
Miami, Fla. 88 44 25 13 6 - -
Norfolk, Va. 46 36 5 4 1 - 1
Richmond, Va. U U U U U U U
Savannah, Ga. 49 31 9 5 2 2 2
St. Petersburg, Fla. 49 35 3 9 1 1 5
Tampa, Fla. 164 113 36 6 4 4 7
Washington, D.C. 219 109 51 32 11 16 7
Wilmington, Del. 14 6 3 - - - -
E.S. CENTRAL 738 469 164 67 21 17 49
Birmingham, Ala. 121 83 28 5 2 3 7
Chattanooga, Tenn. 71 42 18 10 - 1 4
Knoxville, Tenn. 49 27 15 1 4 2 4
Lexington, Ky. 68 40 18 6 1 3 6
Memphis, Tenn. 173 107 41 20 3 2 14
Mobile, Ala. 62 43 11 6 1 1 3
Montgomery, Ala. 67 51 10 2 3 1 2
Nashville, Tenn. 127 76 23 17 7 4 9
W.S. CENTRAL 1,474 929 324 137 58 25 77
Austin, Tex. 67 42 10 6 8 1 2
Baton Rouge, La. 41 26 6 2 4 3 1
Corpus Christi, Tex. 72 48 17 4 3 - 3
Dallas, Tex. 216 130 51 24 8 3 4
El Paso, Tex. 66 42 14 4 4 2 2
Ft. Worth, Tex. 113 65 29 15 2 2 13
Houston, Tex. 347 196 83 49 12 7 29
Little Rock, Ark. 81 49 17 8 6 1 3
New Orleans, La. 116 78 29 2 6 1 -
San Antonio, Tex. 210 151 39 13 4 2 13
Shreveport, La. 73 56 9 7 - 1 5
Tulsa, Okla. 72 46 20 3 1 2 2
MOUNTAIN 889 572 172 87 40 18 49
Albuquerque, N.M. 109 77 17 6 8 1 2
Colo. Springs, Colo. 45 31 5 7 2 - 2
Denver, Colo. 140 90 29 16 4 1 7
Las Vegas, Nev. 197 125 44 15 9 4 4
Ogden, Utah 25 15 7 1 1 1 2
Phoenix, Ariz. 156 94 28 19 8 7 14
Pueblo, Colo. 11 10 1 - - - -
Salt Lake City, Utah 95 59 18 11 4 3 9
Tucson, Ariz. 111 71 23 12 4 1 9
PACIFIC 1,274 876 217 125 34 22 112
Berkeley, Calif. 16 7 4 5 - - 3
Fresno, Calif. 68 54 8 1 3 2 3
Glendale, Calif. U U U U U U U
Honolulu, Hawaii 61 37 16 6 2 - 4
Long Beach, Calif. 68 38 21 8 1 - 7
Los Angeles, Calif. U U U U U U U
Pasadena, Calif. 30 25 2 2 1 - 6
Portland, Oreg. 124 89 23 7 1 4 10
Sacramento, Calif. 166 115 33 10 6 2 17
San Diego, Calif. 122 77 24 12 2 7 23
San Francisco, Calif. 161 103 26 23 5 4 15
San Jose, Calif. 150 112 22 11 4 1 9
Santa Cruz, Calif. 32 28 2 2 - - 3
Seattle, Wash. 142 94 18 21 7 2 5
Spokane, Wash. 45 32 4 7 2 - 1
Tacoma, Wash. 89 65 14 10 - - 6
TOTAL 11,652**** 7,676 2,242 1,132 327 258 666
---------------------------------------------------------------------------------------------------------------
* Mortality data in this table are voluntarily reported from 121 cities in the United States, most of which have populations
of 100,000 or more. A death is reported by the place of its occurrence and by the week that the death certificate was
filed. Fetal deaths are not included.
** Pneumonia and influenza.
*** Because of changes in reporting methods in these 3 Pennsylvania cities, these numbers are partial counts for the current
week. Complete counts will be available in 4 to 6 weeks.
**** Total includes unknown ages.
U: Unavailable -: no reported cases
===================================================================================================================================
Return to top. Disclaimer All MMWR HTML versions of articles are electronic conversions from ASCII text into HTML. This conversion may have resulted in character translation or format errors in the HTML version. Users should not rely on this HTML document, but are referred to the electronic PDF version and/or the original MMWR paper copy for the official text, figures, and tables. An original paper copy of this issue can be obtained from the Superintendent of Documents, U.S. Government Printing Office (GPO), Washington, DC 20402-9371; telephone: (202) 512-1800. Contact GPO for current prices. **Questions or messages regarding errors in formatting should be addressed to mmwrq@cdc.gov.Page converted: 09/19/98 |
|||||||||
This page last reviewed 5/2/01
|