Skip Navigation LinksSkip Navigation Links
Centers for Disease Control and Prevention
Safer Healthier People
Blue White
Blue White
bottom curve
CDC Home Search Health Topics A-Z spacer spacer
spacer
Blue curve MMWR spacer
spacer
spacer

Notifiable Diseases/Deaths in Selected Cities Weekly Information

Figure_I Notifiable disease reports, comparison of 4-week totals ending October 21, 1995, with historical data -- United States

Table_I Summary -- cases of specified notifiable diseases, United States, cumulative, week ending October 21, 1995 (42th Week)

Table_II Cases of selected notifiable diseases, United States, weeks ending October 21, 1995 and October 22, 1994 (42th Week)

Table_III Deaths in 121 U.S. cities, week ending October 21, 1995 (42th Week)
Table_I
Note: To print large tables and graphs users may have to change their printer settings to landscape and use a small font size.


TABLE I. Summary -- cases of specified notifiable diseases, United States,
cumulative, week ending October 21, 1995 (42nd Week)
============================================================================
                                             Cum. 1995
------------------------------------------------------
Anthrax                                              -
Brucellosis                                         73
Cholera                                             14
Congenital rubella syndrome                          6
Diphtheria                                           -
Haemophilus influenzae*                            941
Hansen Disease                                     109
Plague                                               7
Poliomyelitis, Paralytic                             -
Psittacosis                                         54
Rabies, human                                        2
Rocky Mountain Spotted Fever                       472
Syphilis, congenital, age less than 1 year**       280
Tetanus                                             26
Toxic shock syndrome                               146
Trichinosis                                         25
Typhoid fever                                      286
------------------------------------------------------
 * Of 922 cases of known age, 223 (24) were reported among children
   less than 5 years of age.
** Updated quarterly from reports to the Division of STD Prevention,
   National Center for Prevention Services. This total through second
   quarter 1995.
-: no reported cases
============================================================================

Return to top.

Figure_I

Figure_I
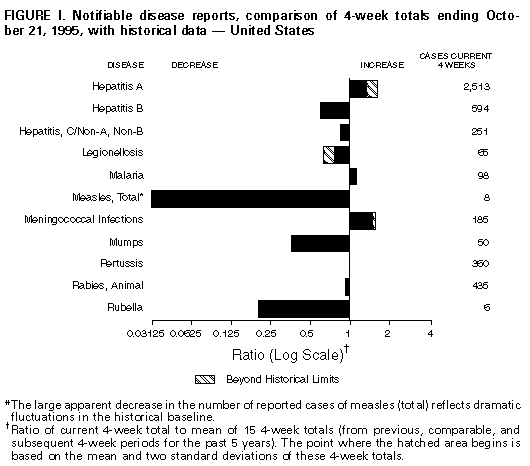
Return to top.

Table_II
Note: To print large tables and graphs users may have to change their printer settings to landscape and use a small font size.

TABLE II. (page 1) Cases of selected notifiable diseases, United States, weeks ending
October 21, 1995, and October 22, 1994 (42nd Week)

                                                                        Hepatitis (Viral), by type
                                                     --------------------------------------------------------------
                   AIDS*          Gonorrhea                  A                     B                   C/NA,NB             Legionellosis
                   ------    -------------------     -----------------      -----------------      ----------------       ----------------
Reporting Area       Cum.       Cum.        Cum.       Cum.       Cum.       Cum.        Cum.       Cum.       Cum.       Cum.      Cum.
                     1995       1995        1994       1995       1994       1995        1994       1995       1994       1995      1994
------------------------------------------------------------------------------------------------------------------------------------------
UNITED STATES      54,704    277,338     328,217     23,110     19,803      7,702       9,195      3,135      3,295        979       1,265

NEW ENGLAND         2,653      4,810       7,000        245        241        168         275         93        124         30          67
Maine                  81         67          74         26         21          7          11          -          -          5           5
N.H.                   77         93          93          9         16         18          23         12          9          2           -
Vt.                    30         49          29          5         10          1           6          1         12          -           -
Mass.               1,137      2,334       2,604        106         90         68         157         73         83         19          46
R.I.                  192        427         380         28         20          8           7          7         20          4          16
Conn.               1,136      1,840       3,820         71         84         66          71          -          -          N           N

MID. ATLANTIC      14,696     27,072      37,214      1,366      1,369      1,026       1,195        369        376        157         205
Upstate N.Y.        1,736      3,846       8,482        361        464        320         317        188        178         42          47
N.Y. City           7,624      9,775      13,984        633        527        304         270          1          1          4           7
N.J.                3,575      3,326       4,229        196        233        249         303        143        166         23          37
Pa.                 1,761     10,125      10,519        176        145        153         305         37         31         88         114

E.N. CENTRAL        4,122     60,753      65,415      2,326      1,992        746         956        223        274        259         359
Ohio                  852     17,515      17,406      1,513        744         91         137         12         20        127         164
Ind.                  429      6,606       7,186        145        324        186         169          6          8         62          36
Ill.                1,736     17,294      20,033        217        491         94         252         33         74         13          33
Mich.                 825     14,660      14,500        304        241        330         320        172        172         27          71
Wis.                  280      4,678       6,290        147        192         45          78          -          -         30          55

W.N. CENTRAL        1,266     15,832      18,142      1,520      1,000        481         539        106         69         98          84
Minn.                 285      2,390       2,620        163        188         50          48          4         14          6           2
Iowa                   71      1,295       1,253         53         55         39          24         12          9         19          28
Mo.                   564      9,104       9,995      1,082        515        325         408         63         18         47          31
N. Dak.                 6         24          34         23          5          4           -          8          1          4           4
S. Dak.                15        141         180         54         31          2           2          1          -          3           1
Nebr.                  84        757       1,060         35        113         23          28          6         11         12          13
Kans.                 241      2,121       3,000        110         93         38          29         12         16          7           5

S. ATLANTIC        14,155     81,821      87,723      1,090      1,014      1,155       1,663        281        345        163         309
Del.                  241      1,828       1,577          7         21          2          13          1          1          2          31
Md.                 2,250      7,471      15,124        180        149        212         289          4         17         27          68
D.C.                  827      3,809       5,906         21         18         19          43          -          1          4           7
Va.                 1,082      8,407      10,866        175        143         93         106         17         21         18           8
W. Va.                 86        544         659         21         17         45          33         43         25          4           3
N.C.                  816     19,681      23,060         89        112        224         233         47         53         31          24
S.C.                  766      9,852      10,918         40         33         43          25         16          8         31          15
Ga.                 1,784     13,509           U         52         27         62         517         13        174         14         106
Fla.                6,303     16,720      19,613        505        494        455         404        140         45         32          47

E.S. CENTRAL        1,763     33,861      37,991      1,613        511        664         947        789        764         43          73
Ky.                   221      3,974       4,120         36        133         56          69         22         25         10           8
Tenn.                 709     11,206      12,365      1,341        230        523         811        765        724         24          36
Ala.                  484     13,578      12,573         72         83         85          67          2         15          6          13
Miss.                 349      5,103       8,933        164         65          -           -          -          -          3          16

W.S. CENTRAL        4,691     25,285      39,896      3,735      2,575      1,142       1,039        259        263         16          36
Ark.                  209        792       5,369        483        158         52          22          4          7          1           6
La.                   785      8,938       9,931        110        131        160         142        140        147          3          12
Okla.                 206      4,550       3,799        852        293        139         116         37         49          5          11
Tex.                3,491     11,005      20,797      2,290      1,993        791         759         78         60          7           7

MOUNTAIN            1,716      6,909       8,179      3,218      3,953        641         536        344        371         97          73
Mont.                  17         59          72        124         18         19          18         13         12          4          14
Idaho                  38         99          73        263        294         71          68         41         65          2           1
Wyo.                   12         85          68         98         24         20          23        136        138         12           4
Colo.                 523      2,329       2,852        449        447        108          85         54         59         35          15
N. Mex.               137        832         823        684        915        248         170         39         45          4           3
Ariz.                 545      2,591       2,598        895      1,575         92          59         37         22          9           9
Utah                  112        131         227        576        476         54          64         10         16         15           6
Nev.                  332        783       1,466        129        204         29          49         14         14         16          21

PACIFIC             9,642     20,995      26,657      7,997      7,148      1,679       2,045        671        709        116          59
Wash.                 717      2,227       2,398        682        892        152         190        181        207         20          11
Oreg.                 347        249         839      1,982        839         93         131         30         35          -           -
Calif.              8,328     17,809      22,092      5,156      5,184      1,412       1,687        421        462         91          45
Alaska                 60        577         736         46        186          9          12          1          -          -           -
Hawaii                190        133         592        131         47         13          25         38          5          5           3

Guam                    -         66         111          5         22          1           4          -          -          1           1
P.R.                1,925        470         408         81         53        455         304         18        143          -           -
V.I.                   27          6          33          -          3          2           7          -          1          -           -
Amer. Samoa             -         25          25          6          8          -           -          -          -          -           -
C.N.M.I.                -         23          45         15          8          7           1          -          -          -           -
------------------------------------------------------------------------------------------------------------------------------------------
N: Not nofifiable    U: Unavailable    -: no reported cases    C.N.M.I.: Commonwealth of North Mariana Islands

*Updated monthly to the Division of HIV/AIDS Prevention, National Center for Prevention Services, last update September 28, 1995.

=============================================================================================================================================================================

TABLE II. (page 2) Cases of selected notifiable diseases, United States, weeks ending
October 21, 1995, and October 22, 1994 (42nd Week)

                                                                                        Measles (Rubeola)
                                                                  ------------------------------------------------------------
                          Lyme                  Malaria             Indigenous              Imported*               Total              Meningococcal             Mumps
                        Disease                                                                                                         Infections
                    ----------------        ---------------       ---------------        ---------------       ---------------        ---------------       ---------------
Reporting Area       Cum.       Cum.        Cum.       Cum.                  Cum.                   Cum.       Cum.       Cum.        Cum.       Cum.       Cum.       Cum.
                     1995       1994        1995       1994       1995       1995        1995       1995       1995       1994        1995       1994       1995       1994
---------------------------------------------------------------------------------------------------------------------------------------------------------------------------
UNITED STATES       7,023     10,135       1,007        881          2        250           2         27        277        874       2,428      2,205        662      1,178

NEW ENGLAND         1,657      2,352          41         64          -          7           -          2          9         27         114        104         11         19
Maine                  25         18           6          5          -          -           -          -          -          5           9         19          4          3
N.H.                   19         25           1          3          -          -           -          -          -          1          20          8          1          4
Vt.                     8         15           1          3          -          -           -          -          -          3           8          2          -          -
Mass.                 162        157          14         29          -          1           -          1          2          7          40         48          2          3
R.I.                  285        347           4          8          -          5           -          -          5          7           -          -          1          2
Conn.               1,158      1,790          15         16          -          1           -          1          2          4          37         27          3          7

MID. ATLANTIC       4,424      6,152         265        171          -          7           -          5         12        221         278        243         94         94
Upstate N.Y.        2,289      3,891          54         44          -          1           -          -          1         26          87         80         24         28
N.Y. City             186         21         140         62          -          2           -          3          5         14          39         30         13          7
N.J.                  944      1,211          53         38          -          4           -          2          6        173          73         52         12         13
Pa.                 1,005      1,029          18         27          -          -           -          -          -          8          79         81         45         46

E.N. CENTRAL           68        480          92         93          -          7           -          4         11        102         331        325        121        206
Ohio                   46         37          11         15          -          1           -          1          2         17          97         95         42         57
Ind.                   14         15          15         12          -          -           -          -          -          1          61         41          4          7
Ill.                    3         23          32         40          -          -           -          2          2         56          71        107         34         93
Mich.                   5          7          21         23          -          4           -          1          5         25          64         47         41         37
Wis.                    -        398          13          3          -          2           -          -          2          3          38         35          -         12

W.N. CENTRAL          197        252          23         40          -          2           -          -          2        170         163        140         41         62
Minn.                 129        129           4         12          -          -           -          -          -          -          27         13          4          4
Iowa                   15         14           2          5          -          -           -          -          -          7          29         18          9         15
Mo.                    34         96           8         12          -          1           -          -          1        160          66         68         22         38
N. Dak.                 -          -           1          1          -          -           -          -          -          -           1          1          1          4
S. Dak.                 -          -           2          -          -          -           -          -          -          -           6          8          -          -
Nebr.                   1          3           3          4          -          -           -          -          -          2          14         12          4          1
Kans.                  18         10           3          6          -          1           -          -          1          1          20         20          1          -

S. ATLANTIC           435        678         210        188          -         11           -          1         12         65         439        320         89        166
Del.                    7        102           1          3          -          -           -          -          -          -           6          5          -          -
Md.                   267        216          55         69          -          -           -          1          1          4          33         29         20         50
D.C.                    2          7          16         14          -          -           -          -          -          -           5          4          -          -
Va.                    48        119          50         29          -          -           -          -          -          3          56         58         21         38
W. Va.                 22         21           4          -          -          -           -          -          -         37           8         12          -          3
N.C.                   49         75          15         11          -          -           -          -          -          3          68         44         16         35
S.C.                   16          7           1          4          -          -           -          -          -          -          53         22         10          7
Ga.                    10        116          27         29          -          2           -          -          2          3          79         68          6          9
Fla.                   14         15          41         29          -          9           -          -          9         15         131         78         16         24

E.S. CENTRAL           41         39          21         31          -          -           -          -          -         28         150        156         15         20
Ky.                     9         22           2         11          -          -           -          -          -          -          48         34          -          -
Tenn.                  20         11           8         10          -          -           -          -          -         28          37         29          2          7
Ala.                    7          6           8          9          -          -           -          -          -          -          35         62          4          5
Miss.                   5          -           3          1          -          -           -          -          -          -          30         31          9          8

W.S. CENTRAL          101        101          48         40          2         28           -          3         31         17         301        260         48        210
Ark.                    9          8           2          3          -          2           -          -          2          1          26         39          9          5
La.                     6          1           5          8          -         17           -          1         18          1          43         34         12         25
Okla.                  43         56           1          6          -          -           -          -          -          -          30         26          -         23
Tex.                   43         36          40         23          2          9           -          2         11         15         202        161         27        157

MOUNTAIN                8         14          52         27          -         67           -          1         68        164         167        145         25        146
Mont.                   -          -           3          -          -          -           -          -          -          -           2          6          1          -
Idaho                   -          3           1          2          -          -           -          -          -          1           9         16          3          7
Wyo.                    3          3           -          1          -          -           -          -          -          -           7          7          -          2
Colo.                   -          1          23         11          -         26           -          -         26         19          44         28          2          4
N. Mex.                 1          5           5          3          -         30           -          1         31          -          32         13          N          N
Ariz.                   1          -          10          4          U         10           U          -         10          1          51         49          2         95
Utah                    1          1           6          4          -          -           -          -          -        134          15         18         11         25
Nev.                    2          1           4          2          -          1           -          -          1          9           7          8          6         13

PACIFIC                92         67         255        227          -        121           2         11        132         80         485        512        218        255
Wash.                  10          3          21         28          -         16           -          4         20          3          77         77         12         16
Oreg.                   9          6          19         14          -          -           2          3          3          2          92        115          N          N
Calif.                 73         58         202        169          -        105           -          3        108         61         304        312        186        218
Alaska                  -          -           3          2          -          -           -          -          -         10           8          2         13          4
Hawaii                  -          -          10         14          -          -           -          1          1          4           4          6          7         17

Guam                    -          -           -          -          U          -           U          -          -        228           3          -          3          6
P.R.                    -          -           1          4          -         11           -          -         11         11          23          7          2          2
V.I.                    -          -           -          -          U          -           U          -          -          -           -          -          2          4
Amer. Samoa             -          -           -          -          -          -           -          -          -          -           -          -          -          2
C.N.M.I.                -          -           1          1          U          -           U          -          -         29           -          -          -          2
---------------------------------------------------------------------------------------------------------------------------------------------------------------------------
*For imported measles, cases include only those resulting from importation from other countries.

N: Not notifiable    U: Unavailable     -: no reported cases

=============================================================================================================================================================================

TABLE II. (page 3) Cases of selected notifiable diseases, United States, weeks ending
October 21, 1995, and October 22, 1994 (42nd Week)

                             Pertussis                          Rubella                    Syphilis            Tuberculosis               Rabies,
                                                                                          (Primary &                                      Animal
                                                                                          Secondary)
                     ---------------------------       --------------------------      -----------------     -----------------       ----------------
Reporting Area                  Cum.        Cum.                  Cum.       Cum.        Cum.       Cum.       Cum.       Cum.        Cum.       Cum.
                     1995       1995        1994       1995       1995       1994        1995       1994       1995       1994        1995       1994
-----------------------------------------------------------------------------------------------------------------------------------------------------
UNITED STATES          97      3,237       3,187          3        133        208      11,862     17,189     15,892     17,663       5,677      6,261

NEW ENGLAND            18        441         352          2         47        128         134        178        407        401       1,283      1,570
Maine                  11         39          18          -          1          -           2          4         12         23          45          -
N.H.                    -         44          68          -          1          -           1          4         18         14         129        171
Vt.                     -         62          40          -          -          -           -          -          3          7         150        115
Mass.                   3        267         190          -          7        124          51         77        225        206         378        590
R.I.                    1          4           5          -          -          2           3         12         40         35         282         40
Conn.                   3         25          31          2         38          2          77         81        109        116         299        654

MID. ATLANTIC           2        271         492          -         12          6         668      1,148      3,277      3,643       1,063      1,674
Upstate N.Y.            2        139         201          -          4          5          43        143        405        465         392      1,248
N.Y. City               -         26         107          -          7          -         318        506      1,745      2,104           -          -
N.J.                    -         13          13          -          1          1         136        193        627        633         289        226
Pa.                     -         93         171          -          -          -         171        306        500        441         382        200

E.N. CENTRAL            2        315         486          -          5          9       2,105      2,521      1,564      1,664          72         55
Ohio                    2        123         132          -          -          -         716        955        218        278          12          4
Ind.                    -         46          53          -          1          -         224        203        192        147          12         12
Ill.                    -         71          93          -          1          1         786        873        770        830           3         19
Mich.                   -         63          71          -          3          8         238        232        324        363          37         12
Wis.                    -         12         137          -          -          -         141        258         60         46           8          8

W.N. CENTRAL            3        232         148          -          -          2         622        987        464        465         288        182
Minn.                   -        122          51          -          -          -          34         39        107        106          20         15
Iowa                    3         11          18          -          -          -          39         51         52         48          98         73
Mo.                     -         49          39          -          -          2         512        832        180        203          21         20
N. Dak.                 -          8           4          -          -          -           -          1          3          9          25         10
S. Dak.                 -         11          17          -          -          -           -          1         20         21          81         33
Nebr.                   -          9           9          -          -          -          11         11         20         17           5          -
Kans.                   -         22          10          -          -          -          26         52         82         61          38         31

S. ATLANTIC             3        291         288          -         25         15       3,057      4,486      2,641      3,106       1,796      1,637
Del.                    -         10           3          -          -          -          14         22         41         36          74         52
Md.                     1         34          65          -          -          -         137        257        241        272         265        450
D.C.                    -          6           8          -          -          -          92        179         87         99          11          2
Va.                     -         19          36          -          -          -         486        652        202        255         366        332
W. Va.                  -          -           4          -          -          -           9          8         59         68         100         64
N.C.                    -        110          58          -          1          -         926      1,386        357        397         396        138
S.C.                    1         23          13          -          1          -         485        674        263        311         107        149
Ga.                     1         21          24          -          -          2         597        686        322        555         239        314
Fla.                    -         68          77          -         23         13         311        622      1,069      1,113         238        136

E.S. CENTRAL            -        261         124          -          -          -       3,092      3,174      1,249      1,290         239        161
Ky.                     -         19          59          -          -          -         168        167        240        257          25         20
Tenn.                   -        204          22          -          -          -         720        854        336        442          78         34
Ala.                    -         35          31          -          -          -         530        551        338        353         127        103
Miss.                   -          3          12          N          N          N       1,674      1,602        335        238           9          4

W.S. CENTRAL            6        255         179          -          8         13       1,497      3,741      2,057      2,281         503        551
Ark.                    2         34          27          -          1          -           -        390         33        204           -         28
La.                     1         16          10          -          -          -         830      1,430          6         15          25         62
Okla.                   3         30          25          -          -          4         151        134        321        202          28         31
Tex.                    -        175         117          -          7          9         516      1,787      1,697      1,860         450        430

MOUNTAIN               13        457         394          -          5          5         202        209        513        440         152        131
Mont.                   -          3           8          -          -          -           4          3         10          9          41         15
Idaho                   2         90          45          -          -          -           -          1         12         11           3          3
Wyo.                    -          1           -          -          1          -           -          1         11          8          22         19
Colo.                   -         84         191          -          -          -          98        107         37         54           9         14
N. Mex.                 6         98          20          -          -          -          33         18         66         43           5          6
Ariz.                   U        149          98          U          3          -          34         39        257        180          49         52
Utah                    5         27          29          -          1          4           4         11         37         41          15         13
Nev.                    -          5           3          -          -          1          29         29         83         94           8          9

PACIFIC                50        714         724          1         31         30         485        745      3,720      4,373         281        300
Wash.                  31        247          98          -          2          -          12         30        197        213           7         15
Oreg.                  16         46          91          1          2          4           7         31         36         90           -         10
Calif.                  3        375         518          -         24         22         465        678      3,290      3,811         270        242
Alaska                  -          -           -          -          -          -           1          3         59         61           4         33
Hawaii                  -         46          17          -          3          4           -          3        138        198           -          -

Guam                    U          1           2          U          -          1           8          3         38         69           -          -
P.R.                    -         12           2          -          -          -         245        267        195        167          44         68
V.I.                    U          -           -          U          -          -           2         26          -          -           -          -
Amer. Samoa             -          -           1          -          -          -           -          1          4          4           -          -
C.N.M.I.                U          -           -          U          -          -           4          1         13         28           -          -

-----------------------------------------------------------------------------------------------------------------------------------------------------
U: Unavailable   -: no reported cases

=============================================================================================================================================================================

Return to top.

Table_III
Note: To print large tables and graphs users may have to change their printer settings to landscape and use a small font size.

TABLE III. Deaths in 121 U.S. cities* week ending
October 21, 1995 (42nd Week)
======================================================================================================================================
                                           All Causes, By Age (Years)
                        ------------------------------------------------------------      P&I**
Reporting Area          All Ages      >=65      45-64     25-44       1-24        <1      Total
-----------------------------------------------------------------------------------------------
NEW ENGLAND                  574       381        108        51         18        16         30
Boston, Mass.                156        89         40        14          7         6          3
Bridgeport, Conn.             32        24          6         2          -         -          -
Cambridge, Mass.              15         7          6         2          -         -          -
Fall River, Mass.             29        25          3         1          -         -          1
Hartford, Conn.               37        20          7         4          3         3          2
Lowell, Mass.                 15         9          2         3          1         -          2
Lynn, Mass.                   20        15          3         1          1         -          1
New Bedford, Mass.            24        21          2         1          -         -          1
New Haven, Conn.              39        28          5         2          1         3          1
Providence, R.I.              54        37          9         6          1         1          3
Somerville, Mass.              9         5          3         1          -         -          -
Springfield, Mass.            57        35         10         8          1         3         11
Waterbury, Conn.              26        23          1         1          1         -          2
Worcester, Mass.              61        43         11         5          2         -          3

MID. ATLANTIC              2,373     1,535        479       252         57        50        112
Albany, N.Y.                  46        30          7         4          4         1          4
Allentown, Pa.                16        12          4         -          -         -          -
Buffalo, N.Y.                104        80         16         6          1         1          5
Camden, N.J.                  20         9          4         3          2         2          2
Elizabeth, N.J.               12         6          2         3          -         1          -
Erie, Pa.***                  35        32          2         1          -         -          -
Jersey City, N.J.             44        30          8         4          -         2          1
New York City, N.Y.        1,250       783        254       152         32        29         40
Newark, N.J.                  71        27         26        12          5         1          7
Paterson, N.J.                17        10          4         3          -         -          -
Philadelphia, Pa.            300       191         67        30         10         2         17
Pittsburgh, Pa.***            95        71         16         6          -         2          3
Reading, Pa.                  10         6          2         2          -         -          3
Rochester, N.Y.              119        84         18         9          2         6         16
Schenectady, N.Y.             30        26          1         1          1         1          -
Scranton, Pa.***              24        21          3         -          -         -          1
Syracuse, N.Y.                85        52         26         6          -         1          7
Trenton, N.J.                 48        29         12         6          -         1          3
Utica, N.Y.                   18        14          3         1          -         -          -
Yonkers, N.Y.                 29        22          4         3          -         -          3

E.N. CENTRAL               2,428     1,705        395       192         59        75        112
Akron, Ohio                   52        38          7         1          1         5          -
Canton, Ohio                  34        28          2         4          -         -          3
Chicago, Ill.                462       277         97        61         13        12         39
Cincinnati, Ohio             169       117         31         9          3         9         15
Cleveland, Ohio              141        81         30        20          5         5          2
Columbus, Ohio               152       109         23        11          3         6         10
Dayton, Ohio                  96        75         13         5          1         2          2
Detroit, Mich.               230       134         52        25          8        11          3
Evansville, Ind.              37        23          8         3          2         1          3
Fort Wayne, Ind.              61        51          7         2          -         1          4
Gary, Ind.                    14         6          3         1          3         1          -
Grand Rapids, Mich.           57        40          8         5          4         -          3
Indianapolis, Ind.           466       381         54        19          6         6          -
Madison, Wis.                 58        41          9         6          -         2          6
Milwaukee, Wis.              105        77         16         3          -         9          6
Peoria, Ill.                  38        31          5         2          -         -          1
Rockford, Ill.                49        32          6         7          2         2          6
South Bend, Ind.              51        39          5         1          5         1          2
Toledo, Ohio                  90        71         10         5          2         2          3
Youngstown, Ohio              66        54          9         2          1         -          4

W.N. CENTRAL                 695       505        110        37         16        16         34
Des Moines, Iowa              40        26         10         1          1         2          4
Duluth, Minn.                 41        35          4         2          -         -          3
Kansas City, Kans.            13         7          1         3          1         1          -
Kansas City, Mo.              89        63          8         5          2         -          6
Lincoln, Nebr.                37        30          5         1          1         -          2
Minneapolis, Minn.           203       152         35         8          4         4          8
Omaha, Nebr.                  91        61         15         7          3         5          4
St. Louis, Mo.               101        69         17         7          4         4          3
St. Paul, Minn.               53        40         10         3          -         -          4
Wichita, Kans.                27        22          5         -          -         -          -

S. ATLANTIC                1,407       873        280       167         46        38         98
Atlanta, Ga.                 190       116         36        27          6         5          8
Baltimore, Md.               250       145         61        36          4         4         25
Charlotte, N.C.               80        53         18         8          1         -          4
Jacksonville, Fla.           158        85         34        18         11        10         18
Miami, Fla.                   95        62         19        10          3         1          1
Norfolk, Va.                  56        30          9         9          4         4          4
Richmond, Va.                 89        57         17         9          2         2          5
Savannah, Ga.                 67        46          7        10          2         2          9
St. Petersburg, Fla.          57        45          6         3          3         -          4
Tampa, Fla.                  172       126         27        12          3         3         16
Washington, D.C.             181       102         46        20          6         7          4
Wilmington, Del.              12         6          -         5          1         -          -

E.S. CENTRAL                 748       503        138        50         28        26         56
Birmingham, Ala.             132        89         29        12          -         2          6
Chattanooga, Tenn.            74        51         14         4          3         2          3
Knoxville, Tenn.              95        65         16         3          6         5          6
Lexington, Ky.                95        65         16         3          6         5          6
Memphis, Tenn.               141        98         22        11          6         4         19
Mobile, Ala.                  40        19         11         6          2         2          1
Montgomery, Ala.              41        30          6         4          -         1          1
Nashville, Tenn.             130        86         24         7          5         5         14

W.S. CENTRAL               1,449       897        288       145         70        47         87
Austin, Tex.                  87        59         15         7          2         4          5
Baton Rouge, La.              35        22          4         6          2         1          1
Corpus Christi, Tex.          49        28          9         3          3         6          2
Dallas, Tex.                 194       116         41        23          7         7          5
El Paso, Tex.                 74        46         13         5          2         7          4
Ft. Worth, Tex.              101        42         23        17         16         3          3
Houston, Tex.                364       221         82        42         14         5         31
Little Rock, Ark.             92        61         18         6          5         2         10
New Orleans, La.             110        56         27        14          9         4          -
San Antonio, Tex.            203       141         33        14          8         6         12
Shreveport, La.               51        40          7         3          -         1          5
Tulsa, Okla.                  89        65         16         5          2         1          9
@TABLE3 REG.               1,027       689        184        97         30        26         70
=MOUNTAIN
Albuquerque, N.M.             97        74         13         8          1         1          5
Colo. Springs, Colo.          46        24         13         6          2         1          5
Denver, Colo.                109        64         19        17          4         5          7
Las Vegas, Nev.              271       177         59        28          3         4         20
Ogden, Utah                   29        23          4         2          -         -          1
Phoenix, Ariz.               184       109         34        21          9        10         19
Pueblo, Colo.                 39        28          9         2          -         -          1
Salt Lake City, Utah         118        85         15         8          6         4          8
Tucson, Ariz.                134       105         18         5          5         1          4
@TABLE3 REG. =PACIFIC      1,392       935        230       149         41        35        116
Berkeley, Calif.              19        13          2         4          -         -          1
Fresno, Calif.                77        48         12        10          4         3          5
Glendale, Calif.               U         U          U         U          U         U          U
Honolulu, Hawaii              64        45         13         1          4         1          6
Long Beach, Calif.            64        45         12         5          1         1          5
Los Angeles, Calif.            U         U          U         U          U         U          U
Pasadena, Calif.              30        20          5         1          1         3          3
Portland, Oreg.              127        82         18        16          7         4          3
Sacramento, Calif.           157       105         25        18          7         2         13
San Diego, Calif.            169       116         29        19          3         2         20
San Francisco, Calif.        164       102         31        27          1         3         18
San Jose, Calif.             223       147         43        18          6         9         20
Santa Cruz, Calif.            30        24          3         2          1         -          5
Seattle, Wash.               112        78         15        13          3         3          4
Spokane, Wash.                51        42          4         4          1         -          2
Tacoma, Wash.                105        68         18        11          2         4         11

TOTAL                 12,093****     8,023      2,212     1,140        365       329        715

-----------------------------------------------------------------------------------------------
   * Mortality data in this table are voluntarily reported from 121 cities in the United States, most of which have populations of
     100,000 or more. A death is reported by the place of its occurrence and by the week that the death certificate was filed. Fetal
     deaths are not included.
  ** Pneumonia and influenza.
 *** Because of changes in reporting methods in these 3 Pennsylvania cities, these numbers are partial counts for the current week.
     Complete counts will be available in 4 to 6 weeks.
**** Total includes unknown ages.

U: Unavailable    -: no reported cases
======================================================================================================================================

Return to top.

Disclaimer   All MMWR HTML versions of articles are electronic conversions from ASCII text into HTML. This conversion may have resulted in character translation or format errors in the HTML version. Users should not rely on this HTML document, but are referred to the electronic PDF version and/or the original MMWR paper copy for the official text, figures, and tables. An original paper copy of this issue can be obtained from the Superintendent of Documents, U.S. Government Printing Office (GPO), Washington, DC 20402-9371; telephone: (202) 512-1800. Contact GPO for current prices.

**Questions or messages regarding errors in formatting should be addressed to mmwrq@cdc.gov.

Page converted: 09/19/98

HOME  |  ABOUT MMWR  |  MMWR SEARCH  |  DOWNLOADS  |  RSSCONTACT
POLICY  |  DISCLAIMER  |  ACCESSIBILITY

Safer, Healthier People

Morbidity and Mortality Weekly Report
Centers for Disease Control and Prevention
1600 Clifton Rd, MailStop E-90, Atlanta, GA 30333, U.S.A

USA.GovDHHS

Department of Health
and Human Services

This page last reviewed 5/2/01