 |
|
|
|
|
|
|
| ||||||||||
|
|
|
|
|
|
|
||||
| ||||||||||
|
|
|
|
|
Persons using assistive technology might not be able to fully access information in this file. For assistance, please send e-mail to: mmwrq@cdc.gov. Type 508 Accommodation and the title of the report in the subject line of e-mail. Increasing Incidence of Gonorrhea -- Minnesota, 1994In the United States, gonorrhea is an important cause of urethritis in men and cervicitis in women; reproductive complications include infertility and ectopic pregnancy. During 1981-1993, the annual incidence rate of gonorrhea in Minnesota declined; the average annual change in the rate of infection was - 8.5% Figure_1. However, in 1994, the incidence rate increased 32% (from 56 cases per 100,000 persons in 1993 to 74 cases per 100,000 in 1994). No corresponding increases occurred in rates of other reportable sexually transmitted diseases (STDs), including chlamydial infection and early syphilis. To elucidate possible explanations for the increased rate of gonorrhea in Minnesota in 1994, the Minnesota Department of Health (MDH) analyzed surveillance data for 1994 and compared it with data for 1993. This report presents the findings of the analysis. In 1994, a total of 3346 gonorrhea cases * were reported to MDH, compared with 2543 cases in 1993. From 1993 to 1994, the incidence rate of gonorrhea increased at least 30% in Minneapolis and St. Paul and in the remainder of the seven-county Minneapolis-St. Paul metropolitan area; in rural areas of the state, the rate increased 17% but remained low (i.e., less than 10 cases per 100,000) Table_1. Six urban zip code areas accounted for 49% of all gonorrhea cases but represented only 5% of the state's population. From 1993 to 1994, the rate of gonorrhea in Minnesota increased 14%-44% for all racial/ethnic groups; the rate was highest for non-Hispanic blacks Table_1. Sex-specific rates increased approximately 30% and were similar for men and women. Age-specific rates increased 20%-86% for all age groups except 10- 14-year-olds; rates were highest among adolescents (i.e., 15- 19-year-olds). From 1993 to 1994, the increase in reported cases varied by reporting source. During this period, the number of gonorrhea cases reported by STD clinics increased 28% (from 1120 to 1430, respectively) and by all other sources increased 34% (from 1423 to 1916, respectively). In addition, the related increase in positive cultures for gonorrhea varied by laboratory testing source. At the two STD clinics in Minneapolis and St. Paul that accounted for most (43%) cases during 1993 and 1994, all clients were tested for gonorrhea. These clinics submitted 18,032 culture specimens to the Minnesota Public Health Laboratory (MPHL) in 1994. Although specimen collection, handling procedures, and volume of tests were unchanged at the two clinics, the percentage of cultures in 1994 that were positive for Neisseria gonorrhoeae increased 24% (from 6.7% to 8.3%) and 28% (from 6.0% to 7.7%). Of the five clinics that each submitted greater than or equal to 1500 gonorrhea cultures to the MPHL in 1994, the proportion of positive cultures increased substantially for only one clinic. For 16 private and hospital-based laboratories, the proportion of all tests (i.e., culture and nonculture) that were positive increased from 1.7% (409 of 24,531) during the fourth quarter of 1993 to 1.9% (491 of 26,231) during the fourth quarter of 1994. From 1993 to 1994, the proportion of gonorrhea patients who were interviewed by health department staff (30%) to identify and treat sex partners remained constant. Testing for antimicrobial resistance was performed on every fourth N. gonorrhoeae isolate identified at the MPHL; in 1994, a total of 433 isolates were tested. All were susceptible to ceftriaxone and ciprofloxacin, two of the recommended therapies for gonorrhea (1). Reported by: EA Belongia, MD, J Besser-Wiek, J DeBoer, KL MacDonald, MD, MT Osterholm, PhD, State Epidemiologist, Minnesota Dept of Health; K Henry, MD, St. Paul Public Health, St. Paul; M Simpson, MD, Hennepin County Medical Center, Minneapolis. Epidemiology Research Br, and Surveillance and Information System Br, Div of Sexually Transmitted Diseases and HIV Prevention, National Center for Prevention Svcs, CDC. Editorial NoteEditorial Note: Gonorrhea is a major cause of pelvic inflammatory disease and may play a role as a cofactor in human immunodeficiency virus transmission (2,3). During 1975-1993, the rate of reported gonorrhea decreased 65% in the United States, from a peak of 467.7 cases per 100,000 persons to 165.8 per 100,000 (4). Despite the decline, gonorrhea rates in the United States remain the highest among developed countries (5). The surveillance findings in Minnesota probably reflect a real increase in the incidence of gonorrhea because reported cases increased in all age and race groups without apparent change in program activities, reporting practices, or laboratory procedures. In addition, the proportion of positive cultures increased at the MPHL. Rates remained highest for adolescents, non-Hispanic blacks, and residents of urban areas. National surveillance data also indicate high incidence in these groups (4). Adolescents and young adults are at increased risk for gonorrhea because they are more likely to have multiple sex partners, to have unprotected sex, and to select partners at increased risk (6). In 1993, 81% of the total reported cases of gonorrhea in the United States occurred among blacks (4); although explanations for the high rates among blacks are undetermined, race may be a marker strongly associated with risk factors for STDs, such as low socioeconomic status, access to health care, health-care seeking behavior, illicit drug use, and residence in communities with high prevalences of STDs. In Minnesota, the concentration of gonorrhea cases in some zip code areas suggests the disease is highly focal, and intervention should be targeted geographically. Preliminary national surveillance data suggest that rates of gonorrhea may have increased in other states during 1994. Following the implementation of national gonorrhea screening programs in 1975, the national incidence of gonorrhea had decreased every year except two (1978 and 1985) (4). From 1990 to 1993, the national incidence decreased an average of 14.4% annually. However, during the first three quarters of 1994, the rate decreased only 0.9% compared with the same period in 1993. Of the 35 states reporting greater than or equal to 1000 gonorrhea cases annually, 18 states (including Minnesota) reported an increase during the first three quarters of 1994 Figure_2; only three states reported increases in 1992 and 1993. The increases in reported cases in many states may reflect stabilization or slowing of the long-term decline in gonorrhea in the United States. Although sporadic cases of fluoroquinolone resistance have been reported, there is no evidence of widespread clinical resistance in the United States to currently recommended gonorrhea therapies (7); therefore, treatment failure probably is not a cause of the slowing decline in rates of gonorrhea. In response to the recent increased incidence of gonorrhea in Minnesota, MDH is collecting standardized information from a sample of patients with STDs to assess demographic, behavioral, and geographic factors contributing to transmission. Other state health departments, especially those in areas with increasing rates in 1994, should assess trends in the occurrence of gonorrhea in local areas and communities with an emphasis on groups that have traditionally been at highest risk for gonorrhea. References
* A written report of gonorrhea submitted by a physician and confirmed by a positive laboratory test for Neisseria gonorrhoeae. Figure_1 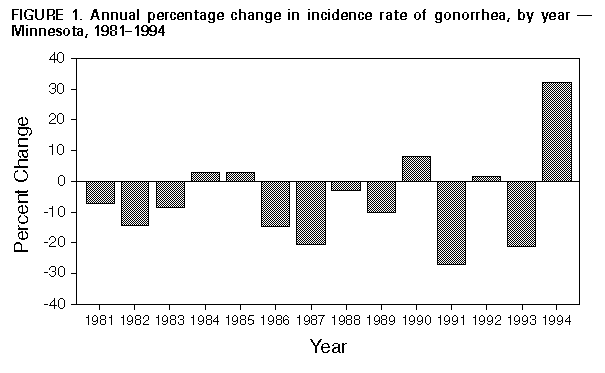 Return to top. Table_1 Note: To print large tables and graphs users may have to change their printer settings to landscape and use a small font size.
TABLE 1. Reported number of persons with gonorrhea and rate * of gonorrhea,
by sex, age group, race/ethnicity, and area of residence -- Minnesota, 1993
and 1994, and percentage change in rate of gonorrhea
============================================================================

                              1993                1994          % Change
                        ----------------    ----------------       from
Characteristic          No. cases   Rate    No. cases   Rate  1993 to 1994
----------------------------------------------------------------------------
Sex
  Male                    1272        57      1663        75      +32
  Female                  1271        55      1683        73      +33

Age group (yrs) +
  10-14                    82        25        77        24      - 4
  15-19                   901       293      1166       379      +29
  20-24                   766       235       923       283      +20
  25-34                   600        74       834       103      +39
  35-44                   149        22       280        41      +86
   >=45                    44         3        63         5      +67

Race/ethnicity &
  White, non-Hispanic      546        13       770        18      +39
  Black, non-Hispanic     1683      1515      2137      1924      +27
  American Indian           51        94        59       109      +16
  Asian/Pacific Islander    27        29        30        33      +14
  Hispanic @                53        86        76       124      +44

Area of residence
  Minneapolis             1481       403      1933       525      +30
  St. Paul                 493       181       656       241      +33
  Seven-county
    metropolitan area **   435        25       604        35      +40
  Rural Minnesota ++       134         6       153         7      +17
----------------------------------------------------------------------------
 * Per 100,000 persons (based on 1993 population estimates).
 + Data were excluded from this analysis for persons aged <10 years (for
   1993, one person and, for 1994, three persons).
 & Data were excluded from this analysis for persons aged of other races
   and for whom race was unknown (for 1993, a total of 183 persons and,
   for 1994, a total of 274 persons).
 @ Persons of Hispanic origin can be of any race.
** Comprises counties of Anoka, Carver, Dakota, Hennepin, Ramsey, Scott,
   and Washington, excluding cities of Minneapolis and St. Paul.
++ Comprises 80 counties outside the Minneapolis-St. Paul metropolitan
   area.
============================================================================
Return to top. Figure_2 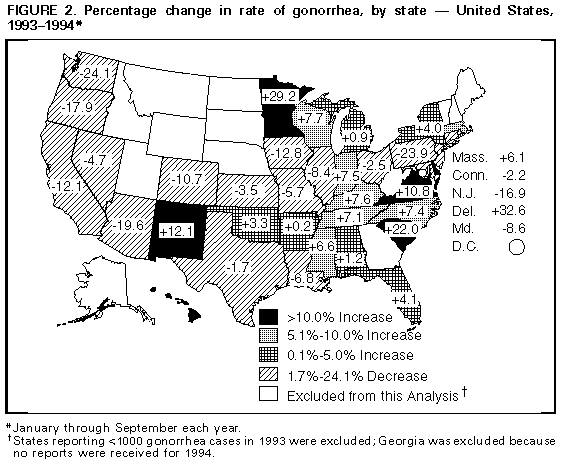 Return to top. Disclaimer All MMWR HTML versions of articles are electronic conversions from ASCII text into HTML. This conversion may have resulted in character translation or format errors in the HTML version. Users should not rely on this HTML document, but are referred to the electronic PDF version and/or the original MMWR paper copy for the official text, figures, and tables. An original paper copy of this issue can be obtained from the Superintendent of Documents, U.S. Government Printing Office (GPO), Washington, DC 20402-9371; telephone: (202) 512-1800. Contact GPO for current prices. **Questions or messages regarding errors in formatting should be addressed to mmwrq@cdc.gov.Page converted: 09/19/98 |
|||||||||
This page last reviewed 5/2/01
|