 |
|
|
|
|
|
|
| ||||||||||
|
|
|
|
|
|
|
||||
| ||||||||||
|
|
|
|
|
Persons using assistive technology might not be able to fully access information in this file. For assistance, please send e-mail to: mmwrq@cdc.gov. Type 508 Accommodation and the title of the report in the subject line of e-mail. Surveillance for Pregnancy and Birth Rates Among Teenagers, by State -- United States, 1980 and 1990Alison M. Spitz, M.S., M.P.H. (1) Stephanie J. Ventura, A.M. (2) Lisa M. Koonin, M.N., M.P.H. (1) Lilo T. Strauss, M.A. (1) Alice Frye, M.P.H. (1) Robert L. Heuser, M.A. (2) Jack C. Smith, M.S. (1) Leo Morris, Ph.D., M.P.H. (1) Sandra Smith, M.P.H. (2) Phyllis Wingo, Ph.D., M.S. (1) James S. Marks, M.D. (1) Abstract Problem/Condition: In the United States in 1990, there were an estimated 1 million pregnancies and 521,826 births among women ages 15-19 years. Rates of teenage pregnancy and birth rates by state in 1990 exceeded those in most developed countries. An estimated 95% of teenage pregnancies are unintended (i.e., they occur sooner than desired or are not wanted at any time). Reporting Period Covered: This report summarizes and reviews surveillance data for pregnancies, abortions, and births among women ages 15-19, 15-17, and 18-19 years reported by CDC for 1980 and 1990. Description of System: Data for births and abortions were reported to state health departments and other health agencies and sent to CDC. The data from each state included the total number of births and abortions by age and race/ethnicity. Results: Data in this report indicate that pregnancy rates by state among U.S. teenagers ages 15-19 years have changed little since 1980. Moreover, many states have reported increases in birth rates that are probably related to concurrent decreases in abortion rates. Pregnancy rates range from 25 to 75 per 1,000 for 15- to 17-year-olds and from 92 to 165 per 1,000 for 18- to 19-year-olds. Interpretation: States with low rates of teenage pregnancy or birth may have developed and used prevention strategies directed at the needs of both younger and older teenagers; these programs may serve as models for other states where birth rates have remained high or have increased since 1980. Actions Taken: CDC will continue to conduct surveillance of and analyze data for pregnancies, abortions, and births among teenagers to monitor progress toward national goals and to assist in targeting program efforts for reducing teenage pregnancy. INTRODUCTION An estimated 1 million pregnancies and 521,826 live births among U.S. women ages 15-19 years were reported for 1990 (1,2). Because of the adverse health, social, and economic consequences of teenage childbearing, CDC analyzed data for pregnancies and births among teenagers (3). These data will be used to monitor progress toward national goals and to assist in targeting program efforts to reduce teenage pregnancy (4). An earlier report presented 1990 pregnancy and birth rates for teenagers ages 15-19 by state and race/ethnicity and compared those rates with those for 1980 (5); this report makes the same comparisons with more detailed age groups for the 15- through 19-year-old population (6,7). Data for teenagers less than 15 years of age will be presented in a future report. METHODS For this report, rates of teenage pregnancy were defined as the sum of live births and legal induced abortions per 1,000 women ages 15-19, 15-17, and 18-19 years; rates were also analyzed by racial/ethnic group. These rates do not include estimates of spontaneous abortions or stillbirths, primarily because fetal losses are substantially underreported to state health departments. Although national estimates indicate that approximately 12% of pregnancies among U.S. teenagers end in fetal loss (2), no comparable data are available at the state level. Birth rates among teenagers were defined as the number of live births per 1,000 women ages 15-19, 15-17, and 18-19 years in their respective racial/ethnic group. Abortion rates were defined as the number of legal induced abortions per 1,000 women in those age and racial/ethnic groups. Information about births was obtained from birth certificates; state reports to CDC provided information on abortions. Numbers of women used to calculate rates were obtained from unpublished tabulations provided by the U.S. Bureau of the Census. Births were reported by state of residence; since abortion data by residence were not available for all states, abortions were reported by state of occurrence. Thus, pregnancy and abortion rates for states with substantial numbers of abortions among nonresident women may be somewhat higher than rates based on abortions by residence. Because the numbers of abortions by age were not available for all states in 1990, pregnancy rates for all women ages 15-19 years in 1990 were calculated for the District of Columbia (DC) and for the 40 states from which information for age was available. * Pregnancy rates for detailed age groups and for race/ethnicity were calculated for states reporting data by those categories. Birth rates were calculated for all 50 states and DC for all three age groups. Detailed information has been tabulated on the states reporting data for abortions and births by various age and racial/ethnic categories (Appendix). Rates by race/ethnicity were not reported if there were less than or equal to 20 abortions or births or less than or equal to 1,000 women in the specified group or if greater than or equal to 15% of abortions were among women of unknown race/ethnicity. These exclusions are noted in the tables. ** Furthermore, rates for racial/ethnic groups other than white, black, and Hispanic were not calculated because abortion data were not available or because the numbers of births were too small at the state level for reliable rates to be computed. Data analyzed by race/ethnicity may be useful for targeting educational and family planning programs for reducing pregnancy among teenagers. Hispanic women and infants born to Hispanic women may be of any race. Although both race and Hispanic origin were reported separately on 1990 state birth certificates and in the census, information for abortions in 1990 (reported by states to CDC) did not designate race independently of Hispanic ethnicity. Thus, for this analysis, pregnancy and abortion rates for whites include all abortions for Hispanics. *** For most states, rates will be affected minimally because the majority of states have small numbers of Hispanic women. However, for states with relatively large Hispanic populations, such as Texas, the rate for white women may reflect to a considerable degree the rate for Hispanics. Differences mentioned in the text in rates in 1990 compared with 1980 are statistically significant at the 0.05 level. The categories of percent changes in rates from 1980 to 1990 are based on rounded numbers. RESULTS Rates of Pregnancy, Abortion, and Birth by Age Group In 1990, pregnancy rates by state among women ages 15-19 years ranged from 56 to 111 per 1,000 women **** (Table_1). Rates for the younger teenagers in this age group (15-17 years) showed proportionately greater variation, ranging from 25 to 75 per 1,000. Rates for older teenagers (18- 19 years) were much higher than those for younger teenagers, ranging from 92 to 165 per 1,000. Abortion rates reported by states **** for women ages 15-19 years varied more than pregnancy rates, ranging from 6 to 49 abortions per 1,000 women (Table_2). Rates for women ages 15-17 ranged from 3 to 34 per 1,000, while abortion rates for women ages 18-19 ranged from 10 to 68 per 1,000 (Table_2). Birth rates among women ages 15-19 years ranged from 33 to 81 per 1,000 women **** (Table_3). For young teenagers ages 15-17, rates ranged from 16 to 57 per 1,000 women. Again, rates for older teenagers were higher than those for younger teenagers, ranging from 47 to 124 per 1,000 women ages 18-19. Rates of Pregnancy, Abortion, and Birth by Race/Ethnicity Pregnancy and birth rates for blacks were generally higher than rates for Hispanics and whites (Table_4 and Table_5). However, data were not available to permit adjustments for socioeconomic or educational status of mothers. Pregnancy rates for teenagers ages 15-19 years ranged from 104 to 219 per 1,000 for blacks in the 24 states for which rates could be calculated; from 56 to 145 per 1,000 for Hispanics (19 states); and from 46 to 106 per 1,000 for whites (30 states). In 1990, pregnancy rates for black teenagers ages 15-17 years were generally 2 to 3 times the rates for white teenagers in that age group (Table_4). Rates for Hispanic teenagers generally were between those for white and black women. These differentials were observed for older teenagers as well. Abortion rates for black teenagers were generally 1.5 to 3 times the rates for white teenagers, but in some states the rates were similar. Abortion rates for Hispanic teenagers generally were lower than those for either white or black women. Patterns in birth rates by racial/ethnic group for women ages 15-19 years were similar to patterns in pregnancy rates, although rates for Hispanics were closer to those for blacks. For some states, birth rates for blacks were 2-5 times the rates for whites (Table_5). These patterns were also observed for women ages 15-17 and 18-19. Rates of Pregnancy, Abortion, and Birth by Age Group, 1990 Compared with 1980 For 1990 compared with 1980, pregnancy rates for women ages 15-19 years showed a statistically significant decline in 20 of the 40 states and in DC (Table_6 and Figure_1). However, rates in 14 of these 21 areas declined by less than or equal to 10%. Over the decade, pregnancy rates increased in 13 states, and six of these states reported increases greater than 10%. Pregnancy rates for teenagers ages 15-17 years declined in 18 of the 40 states for which rates were computed (Table_7). Trends in rates for teenagers ages 18-19 were remarkably similar to those for the younger teenagers, except that the range of the percent changes was smaller for the older teenagers (Table_8). Abortion rates reported for states were more likely to show declines than were pregnancy rates, and those declines were proportionately larger (Table_6). Declines in abortion rates for women ages 15-19 years were observed in 26 of the 40 states and in DC. In 24 of these 27 areas, the declines were greater than 10%; 15 states reported declines of greater than 20%. Abortion rates increased in nine states, with increases of greater than 10% in six of these states. Abortion rates for teenagers ages 15-17 years showed the same patterns as pregnancy rates. Rates decreased in 26 of the 40 states; in 22 of these states, the declines exceeded 20%. Abortion rates for the older teenagers also declined in 26 of the 40 states; the declines exceeded 20% in 11 of these states. Unlike pregnancy and abortion rates, birth rates in most states increased in 1990 compared with 1980. Because the declines in abortion rates generally exceeded those in pregnancy rates, birth rates for women ages 15-19 years increased in 29 states and in DC (Table_6 and Figure_2). Rates in 18 of the 30 areas increased by greater than 10%; in 10 areas, rates increased by greater than 20%. Birth rates declined in only 13 states; in seven of these, declines exceeded 10%. Birth rates by state for younger teenagers (ages 15-17 years) were also more likely to increase (23 states and DC) than to decline (nine states) (Table_7). This increase also was noted for the older teenagers (ages 18-19 years); rates increased in 24 states and DC and declined in 14 states (Table_8). Increases tended to be smaller for the older age group than for the younger. Pregnancy and abortion rates and relative changes over time in these rates affect the birth rates and the percent change in these birth rates in a given area. To illustrate how the varying patterns of change in pregnancy and abortion rates affect changes in the birth rate in a given state, we discuss these rates for 15- to 19-year-olds in three states: Nevada, North Dakota, and Rhode Island (Figure_3). The pregnancy rate in Nevada declined by 9% in 1990 compared with 1980, but the abortion rate decreased by much more (43%); the net result was a 25% increase in Nevada's birth rate. In North Dakota, changes in pregnancy, abortion, and birth rates were more consistent; the pregnancy rate declined by 23% and the abortion rate decreased by 34%. The birth rate in this state also declined, but to a lesser extent (15%). A different pattern is illustrated by Rhode Island, where the pregnancy rate increased by 17%, but the abortion rate did not change. As a result, the birth rate increased by 33%. These illustrations demonstrate that a change in either the pregnancy or abortion rate can change the overall birth rate in any state. Rates of Pregnancy, Abortion, and Birth by Race/Ethnicity, 1990 Compared with 1980 Pregnancy, abortion, and birth rates for white and black teenagers for 1990 compared with 1980 differ considerably (Table_9 and Table_10). Data for 1990 and 1980 for Hispanic women were not examined because only 22 states reported Hispanic origin on the 1980 birth certificates and because abortions were not classified by Hispanic origin in 1980. Generally, pregnancy and abortion rates for white teenagers ages 15-19 years were more likely to decline than to increase; the opposite was true for black women. Birth rates for both white and black women were more likely to increase than decline, but for white women the increases occurred in relatively fewer states. Pregnancy rates for white teenagers ages 15-19 years decreased in 15 of 25 states; in eight states, declines were greater than 10% (Table_9). Abortion rates for white teenagers decreased in 16 of the 25 states; the rates decreased by greater than 10% in all of these 16 states; rates for 14 states declined by greater than 20%. Birth rates for white teenagers increased in 25 states (by greater than 10% in 15 states) and decreased in 16 states and DC. Among black teenagers ages 15-19 years, pregnancy rates increased in 13 of 19 states and declined in one state (Table_10); the increase was greater than 10% in 10 states. Abortion rates for black teenagers were also more likely to increase (10 states) than to decline (four states). Birth rates for black teenagers increased (for the most part, substantially) for DC and for 28 of the 39 states for which rates were computed for both 1980 and 1990. Birth rates rose by greater than 10% in 22 of the states and in DC; 14 states and DC reported increases of greater than 20%. DISCUSSION Trends in Pregnancy, Abortion, and Birth Pregnancy and birth rates among teenagers in the United States exceed those in most developed countries (8; Alan Guttmacher Institute, unpub- lished data, 1988). Small declines in pregnancy and birth rates among teenagers during the early 1980s subsequently reversed, resulting in relatively little net change in the U.S. pregnancy rate in this age group over the decade (1,2). ***** Recent data indicate that the teenage birth rate increased almost 20% from 1986 through 1990, whereas the abortion-to- live-birth ratio among teenagers decreased by about 21% during the same period. These trends suggest that a larger proportion of pregnancies among teenagers ended in live births (1,9). Although pregnancy rates among U.S. teenagers did not decline during the 1980s and may have increased in recent years, the actual number of pregnancies among teenagers declined by about 14% from 1980 through 1988, as the number of teenage women declined (2). Women who were teenagers in the late 1980s were born during the early 1970s, after the baby boom and during a period when birth rates dropped to historic low levels. Age This report demonstrates wide state-to-state variation in pregnancy, abortion, and birth rates among teenagers in 1990 as well as in 1980. The variation in these rates for 15- to 19-year-olds reflects the proportion- ately wider range of such rates among younger teenagers (ages 15-17 years) compared with older teenagers (ages 18-19 years). This diversity, evident among all women and subgroups, may partly reflect higher levels of unintended pregnancy among women ages 15-17 than among women ages 18-19. National health objectives for the year 2000 include reducing the pregnancy rate for teenagers ages less than or equal to 17 years to less than or equal to 50 per 1,000 women (4). Nearly half the states that have these data available have reached this goal. In some states, teenagers ages 15-19 have pregnancy or birth rates as low as those in several developed countries (8; Alan Guttmacher Institute, unpublished data, 1988). Such states may have developed and used prevention strategies directed at the needs of both younger and older teenagers; these programs may serve as models for other states. Race/Ethnicity Factors that affect pregnancy and birth rates for all women and for women by racial/ethnic groups include trends in sexual experience among teenagers, socioeconomic status, access to family planning and abortion services, and the use of contraception. For example, a recent study indicated that, although sexual activity among white teenagers increased considerably during the 1980s, the use of condoms at first intercourse rose sharply as well; sexually experienced white teenagers were thus less likely to become pregnant in 1988 than in 1980 (2). However, during 1983-1988, Hispanic and black women were less likely than white women to use contra- ception during their first reported premarital sexual intercourse (32% and 58%, compared with 70%) (10). Trends in these factors bear further analysis. An important factor in the rapid increase in birth rates for white teenagers during the 1980s is the growing proportion of these women who are Hispanic (11). Hispanic women have much higher birth rates at all ages than do non-Hispanic white women, but particularly at ages less than 20 years (1). For example, the birth rate among teenagers for 1990 was 100 per 1,000 for Hispanics, compared with 43 per 1,000 for non-Hispanic whites. Moreover, the Hispanic teenage population increased 12% from 1986 through 1990, while the non-Hispanic white teenage population declined 10%. Thus, the sustained increase in the birth rate among white teenagers since the mid-1980s partly reflects the combined impact of the higher fertility of Hispanic white teenagers and the growing proportion of the white teenage population that is Hispanic. Data Limitations We could not calculate pregnancy rates among teenagers for 1990 in 10 states because those states did not collect data on the age of women obtaining abortions. These 10 states accounted for approximately 39% of all U.S. abortions in 1990. Because so many pregnancies among teenagers -- more than a third -- end in abortion and because the rates vary widely by state, complete abortion reporting from each state by age and race/ethnicity is essential for monitoring national and state-specific pregnancy trends among teenagers. Consequences The personal and social impact of pregnancy among teenagers in the United States is enormous; an estimated 95% of such pregnancies are unintended (i.e., they occur sooner than desired or are not wanted at any time) (2,12). From 1985 through 1990, the public costs (e.g., through Aid to Families with Dependent Children, Medicaid, and food stamps) related to teenage childbearing totaled $120.3 billion (13). Of this amount, an estimated $48.1 billion could have been saved if each birth had been postponed until the mother was at least 20 years old. Although the cost- benefits of family planning services have not been estimated specifically for teenagers, it is estimated that for every public dollar spent on family planning services for all women, an average of $4.40 is saved by averting expenditures for medical services, welfare, and nutritional services (14). These expenses are likely even greater for teenagers, who are at increased risk for pregnancy complications and whose financial resources are usually more limited than those of older women. Public Health Implications More than 70 national health and social welfare organizations support age-appropriate, comprehensive school health education programs to reduce pregnancy among teenagers (15). These programs counsel abstinence as well as provide teenagers with the knowledge and skills they need to avoid unplanned pregnancy. In addition to health education efforts, family planning services for sexually active teenagers are important for reducing pregnancy among teenagers (4). References
(1) Division of Reproductive Health, National Center for Chronic Disease Prevention and Health Promotion (2) Division of Vital Statistics, National Center for Health Statistics * For states with <15% unknown information on age or race, unknowns were redistributed based on known distributions. Thus, many numbers and rates that resulted from these redistributions differ slightly from those published in recent reports (5,9). ** When rates are not reported, the reason for their exclusion is listed in the table according to the following hierarchy: a) abortion data not available; b) less than or equal to 20 births or abortions or less than or equal to 1,000 women; and c) greater than or equal to 15% unknown race/ethnicity in abortion data. *** Ninety-seven percent of Hispanic women who had a live birth in 1990 were white (1). **** DC is not included in these comparisons. Its pregnancy and abortion rates were higher than those of any state, in part because large numbers of nonresidents had abortions there in 1980 and 1990. ***** The National Center for Health Statistics used abortion estimates reported by the Alan Guttmacher Institute (AGI) to calculate national teenage pregnancy rates through 1988 (2). For that report, because age-specific data were not available from AGI, abortion estimates by age were derived from abortion data compiled by CDC's National Center for Chronic Disease Prevention and Health Promotion on the characteristics of women obtaining abortions. APPENDIX Information presented in this report is based on abortion and birth data compiled by state health departments and reported to CDC. Pregnancies are computed as the sum of abortions and live births in a specified group. Pregnancy rates could not be calculated for all states because of missing abortion data. Table_1A An additional statistical limitation on the data shown in Tables 1-10 in the text is based on the available numbers of events and the numbers of women in a specified group. That is, rates were not computed if there were less than or equal to 20 abortions or births, if there were less than or equal to 1,000 women in the specified group, or if greater than or equal to 15% of abortions were obtained by women of unknown race/ethnicity. These statistical limitations are indicated in the tables. Table_1 Note: To print large tables and graphs users may have to change their printer settings to landscape and use a small font size.
TABLE 1. Number of pregnancies * and pregnancy rates + for 15- to 19-year-olds, by age
group and state -- United States, 1990
===============================================================================================
                          Number of pregnancies          Pregnancy rates
                         ------------------------     ---------------------
                             Age group (yrs)             Age group (yrs)
                         ------------------------     ---------------------
State                    15-19    15-17    18-19      15-19   15-17   15-19
---------------------------------------------------------------------------
Alabama                     &        &        &         &       &       &
Alaska                      &        &        &         &       &       &
Arizona                  12,961    4,583    8,378     101.8    63.7   151.4
Arkansas                  8,614    3,057    5,557      98.4    60.4   150.3
California                  &        &        &         &       &       &
Colorado                  9,010    3,351    5,659      82.3    53.8   119.8
Connecticut                 &        &        &         &       &       &
Delaware                    &        &        &         &       &       &
District of Columbia      5,566      &        &       255.2     &       &
Florida                     &        &        &         &       &       &
Georgia                  26,963   10,275   16,688     110.8    74.8   157.5
Hawaii                    3,059    1,085    1,974      88.2    53.3   137.8
Idaho                     2,334      737    1,597      58.8    31.8    96.8
Illinois                    &        &        &         &       &       &
Indiana                  15,648    5,144   10,504      74.3    43.9   112.4
Iowa                        &        &        &         &       &       &
Kansas                    6,825    2,379    4,446      81.1    49.8   122.1
Kentucky                 12,583    4,573    8,010      91.0    58.2   134.3
Louisiana                15,214    5,551    9,663      92.1    59.1   135.6
Maine                     2,953    1,016    1,937      68.4    41.5   103.5
Maryland                 12,953    4,728    8,225      84.7    55.2   122.2
Massachusetts            14,705    4,766    9,939      71.1    45.2    98.0
Michigan                 29,313   10,523   18,790      85.2    54.1   125.4
Minnesota                 9,127    2,974    6,153      62.0    35.8    96.0
Mississippi              10,758    4,346    6,412      97.8    70.5   132.7
Missouri                 14,755    5,054    9,701      82.6    50.3   123.8
Montana                   2,245      770    1,475      81.7    46.3   135.8
Nebraska                  4,124    1,395    2,729      74.2    44.0   114.3
Nevada                    3,906    1,366    2,540     107.5    65.3   164.8
New Hampshire               &        &        &         &       &       &
New Jersey               18,704    6,715   11,989      75.3    46.9   113.8
New Mexico                5,612    2,062    3,550     100.4    62.0   157.1
New York                 56,677   20,698   35,979      92.9    61.5   131.5
North Carolina           25,979    9,665   16,314     106.4    73.0   145.9
North Dakota              1,265      320      945      56.4    24.8    99.5
Ohio                     29,182    9,643   19,539      74.5    43.8   113.7
Oklahoma                    &        &        &         &       &       &
Oregon                    8,301    2,952    5,349      89.2    54.6   137.3
Pennsylvania             30,268   10,787   19,481      74.6    48.6   106.1
Rhode Island              3,124      982    2,142      87.7    56.2   118.0
South Carolina           12,943    4,723    8,220      95.0    62.7   134.9
South Dakota              1,425      460      965      56.9    31.6    92.1
Tennessee                18,199    6,583   11,616     101.8    65.5   148.2
Texas                    65,882   23,765   42,117     102.8    64.5   154.4
Utah                      4,816    1,534    3,282      63.0    34.8   101.4
Vermont                   1,487      509      978      72.1    47.6    98.4
Virginia                 18,567    6,424   12,143      86.5    55.0   124.0
Washington               15,073    5,267    9,806      95.4    58.3   144.8
West Virginia             4,673    1,561    3,112      67.4    39.3   105.0
Wisconsin                11,389    3,832    7,557      66.6    39.9   100.8
Wyoming                   1,042      335      707      62.2    32.7   108.5
---------------------------------------------------------------------------
* The sum of live births and legal induced abortions. Abortions obtained by women of unknown
  age in each state were distributed according to distribution of known age in that state (for
  states reporting age).
+ Pregnancies per 1,000 women.
& Because abortion data were not available, numbers and rates of pregnancies could not be
  calculated.
================================================================================================
Return to top. Table_2 Note: To print large tables and graphs users may have to change their printer settings to landscape and use a small font size.
TABLE 2. Number of abortions and abortion rates * for 15- to 19-year-olds, by age group
and state -- United States, 1990
================================================================================================
                           Number of abortions           Abortion rates
                         ------------------------     ---------------------
                             Age group (yrs)             Age group (yrs)
                         ------------------------     ---------------------
State                    15-19    15-17    18-19      15-19   15-17   18-19
---------------------------------------------------------------------------
Alabama                     +        +        +         +       +       +
Alaska                      +        +        +         +       +       +
Arizona                   3,349    1,147    2,202      26.3    15.9    39.8
Arkansas                  1,603      508    1,095      18.3    10.0    29.6
California                  +        +        +         +       +       +
Colorado                  3,035    1,290    1,745      27.7    20.7    37.0
Connecticut                 +        +        +         +       +       +
Delaware                    +        +        +         +       +       +
District of Columbia      3,536      +        +       162.1     +       +
Florida                     +        +        +         +       +       +
Georgia                   8,594    3,397    5,197      35.3    24.7    49.1
Hawaii                      937      424      513      27.0    20.8    35.8
Idaho                       325      126      199       8.2     5.4    12.1
Illinois                    +        +        +         +       +       +
Indiana                   3,313    1,014    2,299      15.7     8.7    24.6
Iowa                        +        +        +         +       +       +
Kansas                    2,103      930    1,173      25.0    19.5    32.2
Kentucky                  3,234    1,369    1,865      23.4    17.4    31.3
Louisiana                 2,944      898    2,046      17.8     9.6    28.7
Maine                     1,096      446      650      25.4    18.2    34.7
Maryland                  4,810    1,862    2,948      31.4    21.7    43.8
Massachusetts             7,439    2,264    5,175      36.0    21.5    51.0
Michigan                  9,001    3,516    5,485      26.1    18.1    36.6
Minnesota                 3,785    1,324    2,461      25.7    15.9    38.4
Mississippi               1,849      802    1,047      16.8    13.0    21.7
Missouri                  3,528    1,113    2,415      19.7    11.1    30.8
Montana                     914      371      543      33.3    22.3    50.0
Nebraska                  1,772      667    1,105      31.9    21.0    46.3
Nevada                    1,243      477      766      34.2    22.8    49.7
New Hampshire               +        +        +         +       +       +
New Jersey                8,636    3,221    5,415      34.8    22.5    51.4
New Mexico                1,245      502      743      22.3    15.1    32.9
New York                 30,069   11,438   18,631      49.3    34.0    68.1
North Carolina            9,473    3,719    5,754      38.8    28.1    51.4
North Dakota                472      119      353      21.0     9.2    37.2
Ohio                      6,492    2,088    4,404      16.6     9.5    25.6
Oklahoma                    +        +        +         +       +       +
Oregon                    3,217    1,293    1,924      34.6    23.9    49.4
Pennsylvania             12,052    4,490    7,562      29.7    20.2    41.2
Rhode Island              1,560      430    1,130      43.8    24.6    62.2
South Carolina            3,222    1,183    2,039      23.6    15.7    33.5
South Dakota                253      112      141      10.1     7.7    13.5
Tennessee                 5,271    2,068    3,203      29.5    20.6    40.9
Texas                    17,580    6,072   11,508      27.4    16.5    42.2
Utah                      1,109      373      736      14.5     8.5    22.7
Vermont                     785      300      485      38.0    28.0    48.8
Virginia                  7,214    2,678    4,536      33.6    22.9    46.3
Washington                6,676    2,590    4,086      42.2    28.7    60.3
West Virginia               697      248      449      10.0     6.2    15.2
Wisconsin                 4,108    1,503    2,605      24.0    15.6    34.8
Wyoming                      99       31       68       5.9     3.0    10.4
---------------------------------------------------------------------------
* Legal induced abortions per 1,000 women. Abortions obtained by women of unknown age in
  each state were distributed according to distribution of known age in that state (for states
  reporting age).
+ Because abortion data were not available, rates could not be calculated.
================================================================================================
Return to top. Table_3 Note: To print large tables and graphs users may have to change their printer settings to landscape and use a small font size.
TABLE 3. Number of births and birth rates * for 15- to 19-year-olds, by age group and
state -- United States, 1990
=======================================================================================
                             Number of births              Birth rates
                         ------------------------     ---------------------
                             Age group (yrs)             Age group (yrs)
                         ------------------------     ---------------------
State                    15-19    15-17    18-19      15-19   15-17   18-19
---------------------------------------------------------------------------
Alabama                  11,252    4,222    7,030      71.0    47.4   101.4
Alaska                    1,142      335      807      65.3    31.2   120.0
Arizona                   9,612    3,436    6,176      75.5    47.7   111.6
Arkansas                  7,011    2,549    4,462      80.1    50.4   120.7
California               69,712   24,880   44,832      70.6    44.6   104.3
Colorado                  5,975    2,061    3,914      54.5    33.1    82.9
Connecticut               4,038    1,519    2,519      38.8    26.4    53.9
Delaware                  1,277      462      815      54.5    38.4    71.4
District of Columbia      2,030      841    1,189      93.1    88.4    96.7
Florida                  27,017    9,918   17,099      69.1    44.9   100.6
Georgia                  18,369    6,878   11,491      75.5    50.1   108.5
Hawaii                    2,122      661    1,461      61.2    32.5   102.0
Idaho                     2,009      611    1,398      50.6    26.3    84.8
Illinois                 24,967    9,067   15,900      62.9    40.1    93.3
Indiana                  12,335    4,130    8,205      58.6    35.3    87.8
Iowa                      3,989    1,120    2,869      40.5    20.4    65.7
Kansas                    4,722    1,449    3,273      56.1    30.4    89.9
Kentucky                  9,349    3,204    6,145      67.6    40.8   103.0
Louisiana                12,270    4,653    7,617      74.2    49.5   106.9
Maine                     1,857      570    1,287      43.0    23.3    68.8
Maryland                  8,143    2,866    5,277      53.2    33.5    78.4
Massachusetts             7,266    2,502    4,764      35.1    23.7    47.0
Michigan                 20,312    7,007   13,305      59.0    36.0    88.8
Minnesota                 5,342    1,650    3,692      36.3    19.9    57.6
Mississippi               8,909    3,544    5,365      81.0    57.5   111.0
Missouri                 11,227    3,941    7,286      62.8    39.3    93.0
Montana                   1,331      399      932      48.4    24.0    85.8
Nebraska                  2,352      728    1,624      42.3    23.0    68.0
Nevada                    2,663      889    1,774      73.3    42.5   115.1
New Hampshire             1,258      348      910      33.0    17.1    51.3
New Jersey               10,068    3,494    6,574      40.5    24.4    62.4
New Mexico                4,367    1,560    2,807      78.2    46.9   124.2
New York                 26,608    9,260   17,348      43.6    27.5    63.4
North Carolina           16,506    5,946   10,560      67.6    44.9    94.4
North Dakota                793      201      592      35.4    15.6    62.3
Ohio                     22,690    7,555   15,135      57.9    34.3    88.1
Oklahoma                  7,590    2,528    5,062      66.8    38.8   104.3
Oregon                    5,084    1,659    3,425      54.6    30.7    87.9
Pennsylvania             18,216    6,297   11,919      44.9    28.4    64.9
Rhode Island              1,564      552    1,012      43.9    31.6    55.7
South Carolina            9,721    3,540    6,181      71.3    47.0   101.4
South Dakota              1,172      348      824      46.8    23.9    78.7
Tennessee                12,928    4,515    8,413      72.3    45.0   107.3
Texas                    48,302   17,693   30,609      75.3    48.0   112.2
Utah                      3,707    1,161    2,546      48.5    26.3    78.7
Vermont                     702      209      493      34.0    19.5    49.6
Virginia                 11,353    3,746    7,607      52.9    32.1    77.7
Washington                8,397    2,677    5,720      53.1    29.6    84.4
West Virginia             3,976    1,313    2,663      57.3    33.0    89.9
Wisconsin                 7,281    2,329    4,952      42.6    24.2    66.1
Wyoming                     943      304      639      56.3    29.7    98.1
---------------------------------------------------------------------------
* Live births per 1,000 women.
=======================================================================================
Return to top. Figure_1 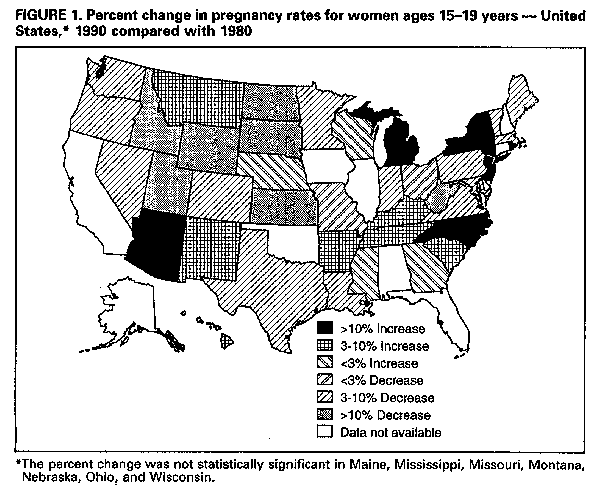 Return to top. Table_4 Note: To print large tables and graphs users may have to change their printer settings to landscape and use a small font size.
TABLE 4. Pregnancy rates * for 15- to 19-year-olds, by age group, race/ethnicity, + and state -- United States, 1990
===========================================================================================================================================
                                                            Age group (yrs)
                         ---------------------------------------------------------------------------------------
                                  15-19                          15-17                          18-19
                         ---------------------------    -------------------------      -------------------------
State                    White +  Black   Hispanic +    White    Black   Hispanic      White    Black   Hispanic
----------------------------------------------------------------------------------------------------------------
Alabama                    &        &        &            &        &        &            &        &        &
Alaska                     &        &        &            &        &        &            &        &        &
Arizona                   99.9    153.5    145.0         62.5    105.3     97.7        147.8    220.9    213.9
Arkansas                  82.7    157.2      @           45.6    114.1      @          132.6    219.7      @
California                 &        &        &            &        &        &            &        &        &

Colorado                   **       **       **           **       **       **           **       **       **
Connecticut                &        &        &            &        &        &            &        &        &
Delaware                   &        &        &            &        &        &            &        &        &
District of Columbia       &        &        &            &        &        &            &        &        &
Florida                    &        &        &            &        &        &            &        &        &

Georgia                   86.2    162.5     87.5         54.0    117.8     56.0        127.2    222.6    124.7
Hawaii                     **       @        **           **       @        **           **       @        **
Idaho                     58.6      @      126.0         31.4      @       79.0         96.7      @        @
Illinois                   &        &        &            &        &        &            &        &        &
Indiana                   65.5    158.0     76.4         36.3    112.1      **         101.7    222.0      **

Iowa                       &        &        &            &        &        &            &        &        &
Kansas                    74.5    181.1     99.3         44.5    127.2     60.4        113.8    252.2    149.1
Kentucky                  84.3    164.1      +           52.3    122.6      +          126.6    218.0      +
Louisiana                 68.7    128.8 ++   +           37.6     92.3 ++   +          109.2    178.1 ++   +
Maine                     67.6      @        +           41.2      @        +          102.2      @        +

Maryland                  61.5    141.8      +           36.8    100.8      +           92.9    192.6      +
Massachusetts              &        &        &            &        &        &            &        &        &
Michigan                   &        &        &            &        &        &            &        &        &
Minnesota                 55.3    219.4     89.9         30.7    151.9     48.4         86.9    303.0    143.9
Mississippi               71.6    130.5      @           46.6     99.2      @          102.2    172.7      @

Missouri                  64.8    197.5     57.0         35.2    145.0     34.3        102.3    267.8     86.0
Montana                    **       @        @            **       @        @            **       @        @
Nebraska                   &        &        &            &        &        &            &        &        &
Nevada                   105.8    156.8    112.8         62.5    109.4     71.1        163.7    227.2    169.7
New Hampshire              &        &        &            &        &        &            &        &        &

New Jersey                52.7    181.6    115.1         30.4    127.5     72.1         83.2    251.5    171.7
New Mexico                99.6    115.5    122.2         61.5      @       79.3        154.9      @      186.6
New York                  76.3    166.4    136.8         47.6    119.5     91.2        110.9    228.1    195.5
North Carolina            86.3    157.3      +           56.6    113.5      +          120.5    212.4      +
North Dakota              50.4      @        @           21.0      @        @           90.3      @        @

Ohio                      60.5    170.1     83.2         32.9    117.8     55.2         95.8    238.2    122.5
Oklahoma                   &        &        &            &        &        &            &        &        &
Oregon                    88.7    178.0    134.3         53.5    127.2     89.5        137.8      @      195.2
Pennsylvania               &        &        &            &        &        &            &        &        &
Rhode Island              80.4    198.9    134.9         50.4    144.3     95.3        109.2      @      180.5

South Carolina            76.6    127.0     84.5         46.6     89.3      @          112.1    177.4      @
South Dakota              46.0      @        +           24.8      @        +           74.9      @        +
Tennessee                 86.3    165.6     56.2         51.5    123.1      @          130.8    220.5      @
Texas                     96.1    153.6    124.5         58.6    107.5     79.6        146.6    215.7    190.7
Utah                      62.2      @      128.7         34.2      @       90.4        100.3      @      181.9

Vermont                   72.7      @        @           47.9      @        @           99.5      @        @
Virginia                  70.4    149.1     74.4         41.7    105.5     46.1        104.6    200.4    107.0
Washington                 **       **       **           **       **       **           **       **       **
West Virginia             66.4    103.9      @           38.4     68.8      @          104.2    146.7      @
Wisconsin                  &        &        &            &        &        &            &        &        &
Wyoming                    &        &        &            &        &        &            &        &        &
----------------------------------------------------------------------------------------------------------------
 * The sum of live births and legal induced abortions per 1,000 women. Abortions obtained by women of unknown age or race/ethnicity
   in each state were distributed according to distribution of known age or race/ethnicity in that state (for states reporting age or
   race/ethnicity).
 + Women of Hispanic origin may be of any race. For calculation of pregnancy rates, abortions for white race included women of Hispanic
   origin. Six states (Kentucky, Louisiana, Maine, Maryland, North Carolina, and South Dakota) did not report abortion data by Hispanic
   origin.
 & Because abortion data were not available, pregnancy rates could not be calculated.
 @ Rates not calculated for states with <=20 births to women in a given age and racial/ethnic group or if there were <=1,000 women in the
   age and racial/ethnic group.
** Rates not calculated because >=15% of abortions were obtained by women of unknown age or race/ethnicity.
++ Rates for all races other than white.
===========================================================================================================================================
Return to top. Table_5 Note: To print large tables and graphs users may have to change their printer settings to landscape and use a small font size.
TABLE 5. Birth rates * for 15- to 19-year-olds, by age group, race/ethnicity, + and state -- United States, 1990
===========================================================================================================================================
                                                            Age group (yrs)
                         ---------------------------------------------------------------------------------------
                                  15-19                          15-17                          18-19
                         ---------------------------    -------------------------      -------------------------
State                    White    Black   Hispanic +    White    Black   Hispanic      White    Black   Hispanic
----------------------------------------------------------------------------------------------------------------
Alabama                   55.3    105.3     33.8         33.3     76.8      &           82.9    143.8      &
Alaska                    53.8      &        &           24.3      &        &          100.6      &        &
Arizona                   72.3    115.1    123.3         45.3     86.3     84.0        106.9    155.4    180.4
Arkansas                  66.2    131.9      &           36.8     99.3      &          105.6    179.3      &
Califomia                 73.9    101.0    112.3         46.1     69.9     73.3        109.7    142.5    165.7

Colorado                  52.1    105.9    110.6         31.1     74.2     77.8         79.8    148.0    157.6
Connecticut               30.5    102.5    121.9         19.8     78.7     93.7         43.7    131.3    158.7
Delaware                  37.4    120.4      &           24.1     91.0      &           50.9    154.4      &
District of Columbia      11.8    121.4     88.7         18.0    100.1      &            9.6    143.9      &
Florida                   52.9    135.0     60.2         30.4    101.2     37.7         81.7    181.7     91.2

Georgia                   56.6    116.2     73.0         33.3     85.2     45.6         86.2    157.9    105.4
Hawaii                    42.0      &      132.9         15.5      &       76.0         76.7      &      223.8
Idaho                     50.3      &      118.6         26.0      &       74.3         84.5      &        &
Illinois                  44.3    144.2     94.8         24.3    105.7     57.4         70.5    197.3    146.2
Indiana                   51.9    122.4     64.5         29.1     90.2     37.3         80.1    167.4    101.9

Iowa                      38.5    119.1     79.9         18.8     85.6      &           63.4    158.1      &
Kansas                    50.8    131.9     86.1         25.8     91.4     48.8         83.7    185.3    133.8
Kentucky                  63.5    115.8      &           36.8     86.2      &           98.7    154.4      &
Louisiana                 52.1    109.1 @   20.9         28.7     81.7 @   13.5         82.5    146.2 @   30.4
Maine                     42.7      &        &           23.1      &        &           68.3      &        &

Maryland                  36.0     95.5     46.0         18.9     69.1     24.1         58.0    128.3     72.6
Massachusetts             30.9     89.5    121.1         20.3     65.3     95.7         41.9    116.7    150.2
Michigan                  43.1    131.1     94.4         22.7     94.5     60.0         69.1    181.4    141.5
Minnesota                 30.6    151.7     79.4         15.3    111.6     40.8         50.2    201.4    129.5
Mississippi               55.5    112.7      &           34.0     85.6      &           81.8    149.2      &

Missouri                  50.3    143.9     46.4         27.9    110.6     28.4         78.8    188.5     69.5
Montana                   39.7      &        &           19.3      &        &           70.5      &        &
Nebraska                  36.9    135.1     81.7         18.4    101.4     45.6         61.4    182.1      &
Nevada                    68.9    129.3    107.5         37.8     92.4     66.8        110.5    184.1    162.9
New Hampshire             33.1      &        **          17.1      &        **          51.7      &        **

New Jersey                28.1     99.6     79.9         15.1     69.6     51.8         46.0    138.3    116.9
New Mexico                75.6     94.6     96.9         45.3      &       63.2        119.6      &      147.4
New York                  36.7     75.6     81.6         21.3     53.8     53.8         55.1    104.4    117.2
North Carolina            52.0    106.6    106.1         31.8     76.6     72.4         75.3    144.3    140.9
North Dakota              29.2      &        &           12.1      &        &           52.5      &        &

Ohio                      47.7    129.4     73.9         25.9     92.3     50.2         75.5    177.8    107.2
Oklahoma                  60.2    116.0      **          33.4     81.5      **          95.9    160.2     **
Oregon                    54.0    108.0    113.9         29.6     80.2     77.3         88.2      &      163.7
Pennsylvania              35.1    124.8    126.1         20.1     94.1     97.6         53.2    162.9    162.2
Rhode Island              38.7    114.3    129.8         27.0     92.5     94.5         49.9      &      170.5

South Carolina            54.3    101.1     66.8         32.4     71.1      &           80.2    141.2      &
South Dakota              35.0      &        &           16.5      &        &           60.3      &        &
Tennessee                 60.3    121.3     40.9         33.8     90.3      &           94.3    161.2      &
Texas                     70.6    114.0    103.8         43.4     82.1     67.8        107.2    156.9    156.9
Utah                      47.8      &      115.0         25.8      &       81.8         77.9      &      161.1

Vermont                   34.3      &        &           19.6      &        &           50.2      &        &
Virginia                  41.1     98.5     55.5         21.6     71.3     33.2         64.3    130.5     81.1
Washington                52.2     94.3    113.4         28.2     63.4     71.5         84.0    134.5    171.2
West Virginia             57.1     74.4      &           32.7     47.3      &           89.9    107.4      &
Wisconsin                 31.2    174.7     90.4         15.1    123.2     54.8         51.6    248.0    143.4
Wyoming                   54.5      &       94.2         28.2      &        &           95.6      &        &
----------------------------------------------------------------------------------------------------------------
 * Live births per 1,000 women.
 + Women of Hispanic origin may be of any race.
 & Rates not calculated for states with <=20 births to women in a given age and racial/ethnic group or if there were <=1,000 women in the
   age and racial/ethnic group.
 @ Rates for all races other than white.
** Hispanic origin not reported on birth certificate.
===========================================================================================================================================
Return to top. Table_6 Note: To print large tables and graphs users may have to change their printer settings to landscape and use a small font size.
TABLE 6. Percent change * in pregnancy rates, + abortion rates, & and birth rates @ for 15- to 19-year-olds, by state -- United
States, 1990 compared with 1980
============================================================================================================================================
                               Pregnancy rates                   Abortion rates                    Birth rates
                         ----------------------------     ----------------------------     ----------------------------
                                           Percent                          Percent                          Percent
State                     1980    1990   change (NB1)      1980    1990   change (NB2)      1980    1990   change (NB3)
-----------------------------------------------------------------------------------------------------------------------
Alabama                   97.8    **          NA           29.6    **          NA           68.3    71.0         4
Alaska                    98.5    **          NA           34.0    **          NA           64.4    65.3         1
Arizona                   89.0   101.8        14           23.5    26.3        12           65.5    75.5        15
Arkansas                  94.1    98.4         5           19.5    18.3        -6           74.5    80.1         7
California               109.6    **          NA           56.3    **          NA           53.3    70.6        32

Colorado                  89.4    82.3        -8           39.5    27.7       -30           49.9    54.5         9
Connecticut               60.3    **          NA           29.8    **          NA           30.5    38.8        27
Delaware                  87.4    **          NA           36.2    **          NA           51.2    54.5         6
District of Columbia     266.5   255.2        -4          204.0   162.1       -21           62.4    93.1        49
Florida                  106.0    **          NA           47.5    **          NA           58.5    69.1        18

Georgia                  108.7   110.8         2           36.8    35.3        -4           71.9    75.5         5
Hawaii                    83.9    88.2         5           33.2    27.0       -19           50.7    61.2        21
Idaho                     76.6    58.8       -23           17.2     8.2       -52           59.5    50.6       -15
Illinois                  84.5    **          NA           28.7    **          NA           55.8    62.9        13
Indiana                   77.0    74.3        -3           19.5    15.7       -19           57.5    58.6         2

Iowa                      59.1    **          NA           16.2    **          NA           43.0    40.5        -6
Kansas                    95.5    81.1       -15           38.7    25.0       -35           56.8    56.1        -1
Kentucky                  85.9    91.0         6           13.5    23.4        73           72.3    67.6        -7
Louisiana                 96.7    92.1        -5           20.7    17.8       -14           76.0    74.2        -2
Maine                     70.6    68.4        -3           23.1    25.4        10           47.4    43.0        -9

Maryland                  88.8    84.7        -5           45.4    31.4       -31           43.4    53.2        23
Massachusetts             74.8    71.1        -5           46.7    36.0       -23           28.1    35.1        25
Michigan                  76.1    85.2        12           31.1    26.1       -16           45.0    59.0        31
Minnesota                 68.5    62.0        -9           33.1    25.7       -22           35.4    36.3         2
Mississippi               97.1    97.8         1           13.4    16.8        25           83.7    81.0        -3

Missouri                  83.1    82.6        -1           25.3    19.7       -22           57.8    62.8         9
Montana                   78.0    81.7         5           29.6    33.3        13           48.5    48.4         0
Nebraska                  73.4    74.2         1           28.3    31.9        13           45.1    42.3        -6
Nevada                   118.1   107.5        -9           59.5    34.2       -43           58.5    73.3        25
New Hampshire             56.4    **          NA           22.8    **          NA           33.6    33.0        -2

New Jersey                58.8    75.3        28           23.6    34.8        47           35.2    40.5        15
New Mexico                95.9   100.4         5           24.1    22.3        -8           71.8    78.2         9
New York                  80.0    92.9        16           45.1    49.3         9           34.8    43.6        25
North Carolina            95.0   106.4        12           37.5    38.8         3           57.5    67.6        18
North Dakota              73.7    56.4       -23           32.1    21.0       -34           41.7    35.4       -15

Ohio                      74.7    74.5         0           22.2    16.6       -25           52.5    57.9        10
Oklahoma                 100.9    **          NA           26.3    **          NA           74.6    66.8       -10
Oregon                    96.2    89.2        -7           45.2    34.6       -24           50.9    54.6         7
Pennsylvania              77.1    74.6        -3           36.6    29.7       -19           40.5    44.9        11
Rhode Island              74.9    87.7        17           42.0    43.8         4           33.0    43.9        33

South Carolina            91.3    95.0         4           26.5    23.6       -11           64.8    71.3        10
South Dakota              67.0    56.9       -15           14.4    10.1       -30           52.6    46.8       -11
Tennessee                 97.8   101.8         4           33.7    29.5       -13           64.1    72.3        13
Texas                    111.8   102.8        -8           37.5    27.4       -27           74.3    75.3         1
Utah                      79.9    63.0       -21           14.7    14.5        -1           65.2    48.5       -26

Vermont                   77.3    72.1        -7           37.8    38.0         1           39.5    34.0       -14
Virginia                  88.8    86.5        -3           40.5    33.6       -17           48.3    52.9         9
Washington                98.9    95.4        -4           52.2    42.2       -19           46.7    53.1        14
West Virginia             78.2    67.4       -14           10.4    10.0        -4           67.8    57.3       -15
Wisconsin                 65.1    66.6         2           25.5    24.0        -6           39.5    42.6         8
Wyoming                   89.2    62.2       -30           10.4     5.9       -43           78.7    56.3       -29
-----------------------------------------------------------------------------------------------------------------------
 * Percent change is rounded to whole numbers.
 + The sum of live births and legal induced abortions per 1,000 women. 1980 Rates include estimates for states not reporting abortions
   by age (5).
 & Legal induced abortions per 1,000 women. Abortions obtained by women of unknown age in each state were distributed according
   to distribution of known age in that state (for states reporting age). 1980 Rates include estimates for states not reporting abortions
   by age (5).
 @ Live births per 1,000 women.
** Because abortion data were not available, rates could not be calculated.
NA = Not available.
(NB1): The percent change in pregnancy rates was not statistically significant in Maine, Mississippi, Missouri, Montana, Nebraska, Ohio,
       and Wisconsin.
(NB2): The percent change in abortion rates was not statistically significant in Arkansas, Rhode Island, Utah, Vermont, and West Virginia.
(NB3): The percent change in birth rates was not statistically significant in Alaska, Delaware, Indiana, Kansas, Louisiana, Minnesota,
       Montana, and New Hampshire.
============================================================================================================================================
Return to top. Table_7 Note: To print large tables and graphs users may have to change their printer settings to landscape and use a small font size.
TABLE 7. Percent change * in pregnancy rates, + abortion rates, & and birth rates @ for 15- to 17-year-olds, by state -- United
States, 1990 compared with 1980
==============================================================================================================================================
                               Pregnancy rates                   Abortion rates                    Birth rates
                         ----------------------------     ----------------------------     ----------------------------
                                           Percent                          Percent                          Percent
State                     1980    1990   change (NB1)      1980    1990   change (NB2)      1980    1990   change (NB3)
-----------------------------------------------------------------------------------------------------------------------
Alabama                   68.0    **          NA           20.9    **          NA           47.1    47.4         1
Alaska                    53.0    **          NA           23.4    **          NA           29.7    31.2         5
Arizona                   55.7    63.7        14           15.2    15.9         5           40.4    47.7        18
Arkansas                  63.3    60.4        -5           15.0    10.0       -33           48.3    50.4         4
California                73.6    **          NA           42.8    **          NA           30.9    44.6        45

Colorado                  56.0    53.8        -4           27.5    20.7       -25           28.5    33.1        16
Connecticut               35.5    **          NA           18.1    **          NA           17.4    26.4        52
Delaware                  63.6    **          NA           27.5    **          NA           36.1    38.4         6
District of Columbia     273.3    **          NA          224.2    **          NA           49.1    88.4        80
Florida                   71.1    **          NA           33.4    **          NA           37.7    44.9        19

Georgia                   73.8    74.8         1           24.8    24.7         0           48.9    50.1         2
Hawaii                    45.0    53.3        19           22.0    20.8        -5           23.0    32.5        41
Idaho                     43.2    31.8       -26           11.8     5.4       -54           31.4    26.3       -16
Illinois                  59.1    **          NA           24.5    **          NA           34.7    40.1        16
Indiana                   49.6    43.9       -11           14.5     8.7       -40           35.1    35.3         1

Iowa                      34.4    **          NA           12.1    **          NA           22.3    20.4        -8
Kansas                    60.4    49.8       -17           29.9    19.5       -35           30.4    30.4         0
Kentucky                  57.8    58.2         1            9.5    17.4        83           48.3    40.8       -16
Louisiana                 63.4    59.1        -7           13.8     9.6       -31           49.6    49.5         0
Maine                     41.1    41.5         1           16.4    18.2        11           24.8    23.3        -6

Maryland                  55.4    55.2         0           29.1    21.7       -25           26.4    33.5        27
Massachusetts             46.8    45.2        -3           31.4    21.5       -32           15.5    23.7        54
Michigan                  45.9    54.1        18           19.3    18.1        -6           26.5    36.0        36
Minnesota                 40.2    35.8       -11           22.8    15.9       -30           17.4    19.9        14
Mississippi               69.7    70.5         1            9.4    13.0        38           60.3    57.5        -5

Missouri                  54.5    50.3        -8           18.9    11.1       -41           35.7    39.3        10
Montana                   41.7    46.3        11           15.9    22.3        41           25.9    24.0        -7
Nebraska                  44.9    44.0        -2           20.3    21.0         4           24.6    23.0        -7
Nevada                    76.0    65.3       -14           43.8    22.8       -48           32.2    42.5        32
New Hampshire             32.4    **          NA           14.9    **          NA           17.5    17.1        -2

New Jersey                35.7    46.9        32           14.2    22.5        59           21.5    24.4        14
New Mexico                58.8    62.0         5           14.6    15.1         3           44.2    46.9         6
New York                  51.5    61.5        19           30.5    34.0        12           21.1    27.5        31
North Carolina            66.7    73.0         9           28.0    28.1         0           38.7    44.9        16
North Dakota              44.4    24.8       -44           22.7     9.2       -59           21.8    15.6       -29

Ohio                      43.9    43.8         0           13.4     9.5       -29           30.5    34.3        12
Oklahoma                  63.3    **          NA           17.1    **          NA           46.1    38.8       -16
Oregon                    61.2    54.6       -11           33.8    23.9       -29           27.4    30.7        12
Pennsylvania              49.8    48.6        -2           25.7    20.2       -21           24.1    28.4        18
Rhode Island              40.1    56.2        40           23.1    24.6         7           17.0    31.6        85

South Carolina            65.2    62.7        -4           20.2    15.7       -22           45.0    47.0         4
South Dakota              37.1    31.6       -15            9.8     7.7       -22           27.3    23.9       -12
Tennessee                 66.1    65.5        -1           22.6    20.6        -9           43.5    45.0         3
Texas                     73.6    64.5       -12           25.4    16.5       -35           48.2    48.0         0
Utah                      49.3    34.8       -30           12.6     8.5       -33           36.7    26.3       -28

Vermont                   43.5    47.6         9           22.7    28.0        24           20.8    19.5        -6
Virginia                  59.6    55.0        -8           29.5    22.9       -22           30.0    32.1         7
Washington                62.4    58.3        -7           37.6    28.7       -24           24.9    29.6        19
West Virginia             49.7    39.3       -21            7.6     6.2       -18           42.1    33.0       -21
Wisconsin                 38.6    39.9         3           18.2    15.6       -14           20.5    24.2        18
Wyoming                   51.7    32.7       -37            7.4     3.0       -59           44.3    29.7       -33
-----------------------------------------------------------------------------------------------------------------------
 * Percent change is rounded to whole numbers.
 + The sum of live births and legal induced abortions per 1,000 women. 1980 Rates include estimates for states not reporting abortions
   by age (5).
 & Legal induced abortions per 1,000 women. Abortions obtained by women of unknown age in each state were distributed according
   to distribution of known age in that state (for states reporting age). 1980 Rates include estimates for states not reporting abortions
   by age (5).
 @ Live births per 1,000 women.
** Because abortion data were not available, rates could not be calculated.
NA = Not available.
(NB1): The percent change in pregnancy rates was not statistically significant in Arkansas, Colorado, Georgia, Kentucky, Maine, Maryland,
       Massachusetts, Mississippi, Nebraska, New Mexico, Ohio, Tennessee, Vermont, and Wisconsin.
(NB2): The percent change in abortion rates was not statistically significant in Arizona, Georgia, Hawaii, Maine, Nebraska, New Mexico,
       North Carolina, and Rhode Island.
(NB3): The percent change in birth rates was not statistically significant in Alabama, Alaska, Arkansas, Delaware, Georgia, Indiana, Kansas,
       Louisiana, Maine, Montana, Nebraska, New Hampshire, New Mexico, South Carolina, South Dakota, Tennessee, Texas, and Vermont.
==============================================================================================================================================
Return to top. Table_8 Note: To print large tables and graphs users may have to change their printer settings to landscape and use a small font size.
TABLE 8. Percent change * in pregnancy rates, + abortion rates, & and birth rates @ for 18- to 19-year-olds, by state -- United
States, 1990 compared with 1980
=============================================================================================================================================
                               Pregnancy rates                   Abortion rates                    Birth rates
                         ----------------------------     ----------------------------     ----------------------------
                                           Percent                          Percent                          Percent
State                     1980    1990   change (NB1)      1980    1990   change (NB2)      1980    1990   change (NB3)
-----------------------------------------------------------------------------------------------------------------------
Alabama                  140.2    **          NA           41.9    **          NA           98.4   101.4         3
Alaska                   170.9    **          NA           50.9    **          NA          119.9   120.0         0
Arizona                  135.6   151.4        12           35.1    39.8        13          100.5   111.6        11
Arkansas                 140.7   150.3         7           26.4    29.6        12          114.3   120.7         6
California               159.6    **          NA           75.2    **          NA           84.5   104.3        23

Colorado                 133.9   119.8       -10           55.6    37.0       -33           78.3    82.9         6
Connecticut               98.7    **          NA           47.9    **          NA           50.8    53.9         6
Delaware                 121.2    **          NA           50.4    **          NA           70.8    71.4         1
District of Columbia     411.0    **          NA          334.4    **          NA           76.6    96.7        26
Florida                  156.6    **          NA           67.9    **          NA           88.7   100.6        13

Georgia                  159.7   157.5        -1           54.3    49.1       -10          105.4   108.5         3
Hawaii                   141.4   137.8        -3           49.7    35.8       -28           91.7   102.0        11
Idaho                    121.2    96.8       -20           24.3    12.1       -50           96.9    84.8       -13
Illinois                 143.0    **          NA           56.8    **          NA           86.2    93.3         8
Indiana                  115.1   112.4        -2           26.4    24.6        -7           88.6    87.8        -1

Iowa                      92.5    **          NA           21.6    **          NA           71.0    65.7        -7
Kansas                   142.1   122.1       -14           50.3    32.2       -36           91.8    89.9        -2
Kentucky                 126.1   134.3         6           19.2    31.3        62          106.9   103.0        -4
Louisiana                143.6   135.6        -6           30.5    28.7        -6          113.1   106.9        -6
Maine                    114.1   103.5        -9           33.1    34.7         5           81.0    68.8       -15

Maryland                 131.3   122.2        -7           62.0    43.8       -29           69.3    78.4        13
Massachusetts            111.6    98.0       -12           66.8    51.0       -24           44.8    47.0         5
Michigan                 116.4   125.4         8           44.8    36.6       -18           71.6    88.8        24
Minnesota                107.6    96.0       -11           47.3    38.4       -19           60.3    57.6        -4
Mississippi              136.2   132.7        -3           19.1    21.7        13          117.1   111.0        -5

Missouri                 122.8   123.8         1           34.2    30.8       -10           88.6    93.0         5
Montana                  131.3   135.8         3           49.7    50.0         1           81.6    85.8         5
Nebraska                 111.6   114.3         2           39.0    46.3        19           72.5    68.0        -6
Nevada                   181.1   164.8        -9           83.2    49.7       -40           97.9   115.1        18
New Hampshire             88.6    **          NA           33.5    **          NA           55.1    51.3        -7

New Jersey                90.9   113.8        25           33.8    51.4        52           57.1    62.4         9
New Mexico               151.2   157.1         4           38.2    32.9       -14          113.0   124.2        10
New York                 121.7   131.5         8           66.7    68.1         2           55.1    63.4        15
North Carolina           133.6   145.9         9           50.5    51.4         2           83.2    94.4        14
North Dakota             112.8    99.5       -12           44.6    37.2       -17           68.2    62.3        -9

Ohio                     118.3   113.7        -4           34.8    25.6       -26           83.6    88.1         5
Oklahoma                 152.4    **          NA           38.8    **          NA          113.6   104.3        -8
Oregon                   145.0   137.3        -5           61.2    49.4       -19           83.8    87.9         5
Pennsylvania             115.2   106.1        -8           51.7    41.2       -20           63.5    64.9         2
Rhode Island             118.1   118.0         0           65.4    62.2        -5           52.7    55.7         6

South Carolina           127.6   134.9         6           35.2    33.5        -5           92.4   101.4        10
South Dakota             107.6    92.1       -14           20.5    13.5       -34           87.1    78.7       -10
Tennessee                142.5   148.2         4           49.4    40.9       -17           93.2   107.3        15
Texas                    165.2   154.4        -6           54.5    42.2       -23          110.7   112.2         1
Utah                     124.5   101.4       -19           24.4    22.7        -7          100.1    78.7       -21

Vermont                  117.8    98.4       -16           56.0    48.8       -13           61.9    49.6       -20
Virginia                 130.2   124.0        -5           56.1    46.3       -17           74.2    77.7         5
Washington               150.2   144.8        -4           72.8    60.3       -17           77.3    84.4         9
West Virginia            119.9   105.0       -12           15.3    15.2        -1          104.6    89.9       -14
Wisconsin                106.3   100.8        -5           40.4    34.8       -14           65.9    66.1         0
Wyoming                  139.3   108.5       -22           14.5    10.4       -28          124.9    98.1       -21
-----------------------------------------------------------------------------------------------------------------------
 * Percent change is rounded to whole numbers.
 + The sum of live births and legal induced abortions per 1,000 women. 1980 Rates include estimates for states not reporting abortions
   by age (5).
 & Legal induced abortions per 1,000 women. Abortions obtained by women of unknown age in each state were distributed according
   to distribution of known age in that state (for states reporting age). 1980 Rates include estimates for states not reporting abortions
   by age (5).
 @ Live births per 1,000 women.
** Because abortion data were not available, rates could not be calculated.
NA = Not available.
(NB1): The percent change in pregnancy rates was not statistically significant in Georgia, Hawaii, Indiana, Mississippi, Missouri, Montana,
       Nebraska, New Mexico, and Rhode Island.
(NB2): The percent change in abortion rates was not statistically significant in Maine, Montana, North Carolina, Rhode Island, South
       Carolina, Utah, and West Virginia.
(NB3): The percent change in birth rates was not statistically significant in Alabama, Alaska, Delaware, Indiana, Kansas, Montana, New
       Hampshire, North Dakota, Pennsylvania, Rhode Island, Texas, and Wisconsin.
=============================================================================================================================================
Return to top. Figure_2 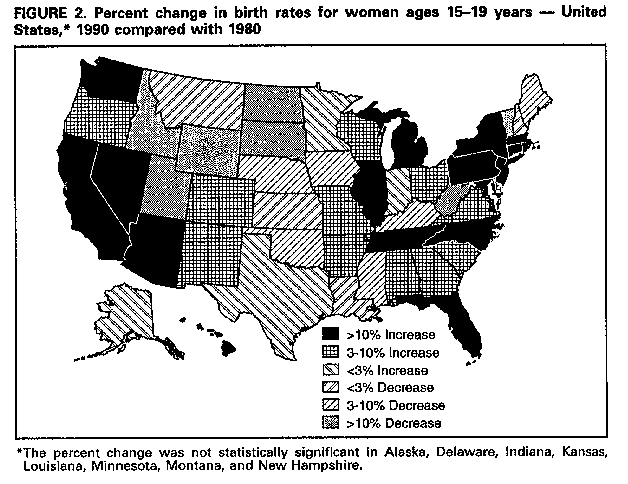 Return to top. Figure_3 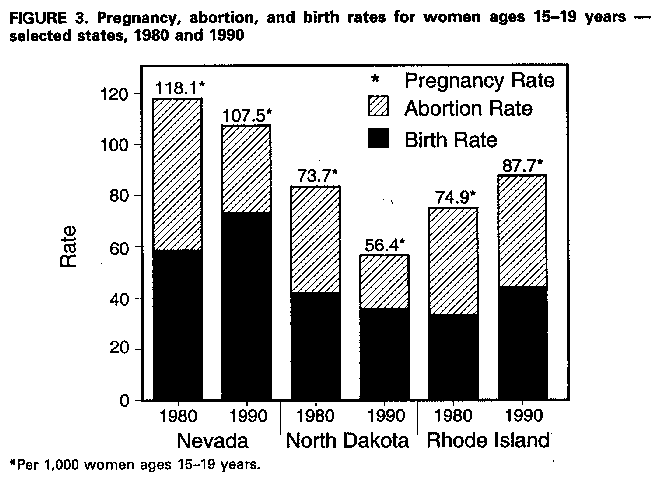 Return to top. Table_9 Note: To print large tables and graphs users may have to change their printer settings to landscape and use a small font size.
TABLE 9. Percent change * in pregnancy rates, + abortion rates, & and birth rates @ for white 15- to 19-year-olds, by state --
United States, 1990 compared with 1980
=================================================================================================================================================
                                                                   Whites
                         ----------------------------------------------------------------------------------------------
                              Pregnancy rates **               Abortion rates **                   Birth rates
                         ----------------------------     ----------------------------     ----------------------------
                                           Percent                          Percent                          Percent
State                     1980    1990   change (NB1)      1980    1990   change (NB2)      1980    1990   change (NB3)
-----------------------------------------------------------------------------------------------------------------------
Alabama                   ++      ++          NA           ++      ++          NA           52.6    55.3         5
Alaska                    ++      ++          NA           ++      ++          NA           52.9    53.8         2
Arizona                   84.6    99.9        18           23.8    27.6        16           60.8    72.3        19
Arkansas                  83.3    82.7        -1           20.1    16.6       -17           63.2    66.2         5
California               103.5    ++          NA           51.0    ++          NA           52.5    73.9        41

Colorado                  &&      &&          NA           &&      &&          NA           48.2    52.1         8
Connecticut               ++      ++          NA           ++      ++          NA           24.9    30.5        22
Delaware                  ++      ++          NA           ++      ++          NA           37.1    37.4         1
District of Columbia      ++      ++          NA           ++      ++          NA           16.7    11.8       -30
Florida                   ++      ++          NA           ++      ++          NA           43.0    52.9        23

Georgia                   92.5    86.2        -7           38.5    29.6       -23           54.0    56.6         5
Hawaii                    75.5    &&          NA           33.9    &&          NA           41.6    42.0         1
Idaho                     76.7    58.6       -24           17.1     8.2       -52           59.5    50.3       -15
Illinois                  67.7    ++          NA           25.7    ++          NA           41.9    44.3         6
Indiana                   70.4    65.5        -7           17.9    13.6       -24           52.5    51.9        -1

Iowa                      ++      ++          NA           ++      ++          NA           41.6    38.5        -7
Kansas                    90.0    74.5       -17           37.9    23.7       -38           52.1    50.8        -3
Kentucky                  ++      84.3        NA           ++      20.8        NA           69.4    63.5        -8
Louisiana                 &&      68.7        NA           &&      16.7        NA           58.1    52.1       -10
Maine                     70.4    67.6        -4           23.2    24.9         7           47.1    42.7        -9

Maryland                  74.5    61.5       -18           42.6    25.4       -40           31.9    36.0        13
Massachusetts             ++      ++          NA           ++      ++          NA           26.0    30.9        19
Michigan                  ++      ++          NA           ++      ++          NA           37.6    43.1        14
Minnesota                 65.4    55.3       -15           32.3    24.7       -23           33.1    30.6        -8
Mississippi               72.3    71.6        -1           16.0    16.1         1           56.3    55.5        -1

Missouri                  72.2    64.8       -10           22.3    14.5       -35           49.9    50.3         1
Montana                   73.5    &&          NA           30.2    &&          NA           43.4    39.7        -9
Nebraska                  ++      ++          NA           ++      ++          NA           41.7    36.9       -11
Nevada                   113.3   105.8        -7           61.1    36.9       -40           52.2    68.9        32
New Hampshire             ++      ++          NA           ++      ++          NA           33.6    33.1        -1

New Jersey                42.6    52.7        24           18.7    24.6        32           23.9    28.1        18
New Mexico                91.9    99.6         8           24.9    24.0        -4           67.0    75.6        13
New York                  62.7    76.3        22           36.0    39.7        10           26.7    36.7        37
North Carolina            80.5    86.3         7           35.3    34.3        -3           45.3    52.0        15
North Dakota              70.1    50.4       -28           33.1    21.2       -36           36.9    29.2       -21

Ohio                      66.0    60.5        -8           19.4    12.9       -34           46.6    47.7         2
Oklahoma                  94.2    ++          NA           26.5    ++          NA           67.6    60.2      - 11
Oregon                    95.4    88.7        -7           45.6    34.7       -24           49.9    54.0         8
Pennsylvania              ++      ++          NA           ++      ++          NA           35.0    35.1         0
Rhode Island              ++      80.4        NA           ++      41.7        NA           29.9    38.7        29

South Carolina            77.9    76.6        -2           28.9    22.3       -23           49.0    54.3        11
South Dakota              57.9    46.0       -21           13.8    11.0       -20           44.1    35.0       -21
Tennessee                 88.9    86.3        -3           33.7    26.0       -23           55.2    60.3         9
Texas                     ++      96.1        NA           ++      25.5        NA           68.7    70.6         3
Utah                      79.2    62.2       -22           13.5    14.4         6           65.7    47.8       -27

Vermont                   77.6    72.7        -6           37.9    38.4         1           39.7    34.3       -14
Virginia                  78.7    70.4       -11           40.2    29.3       -27           38.6    41.1         7
Washington                ++      &&          NA           ++      &&          NA           45.3    52.2        15
West Virginia             ++      66.4        NA           ++       9.4        NA           67.7    57.1       -16
Wisconsin                 ++      ++          NA           ++      ++          NA           34.8    31.2       -10
Wyoming                   ++      ++          NA           ++      ++          NA           77.9    54.5       -30
-----------------------------------------------------------------------------------------------------------------------
 * Percent change is rounded to whole numbers.
 + The sum of live births and legal induced abortions per 1,000 women.
 & Legal induced abortions per 1,000 women. Abortions obtained by women of unknown age or race/ethnicity in each state were
   distributed according to distribution of known age or race/ethnicity in that state (for states reporting age or race/ethnicity).
 @ Live births per 1,000 women.
** For calculation of 1990 pregnancy and abortion rates, abortions for white race included women of known Hispanic origin. For 1980,
   there was no separate designation for women of Hispanic ethnicity.
++ Because abortion data were not available, rates could not be calculated.
&& Rates not calculated because >=15% of abortions were obtained by women of unknown age or race/ethnicity.
NA = Not available
(NB1): The percent change in pregnancy rates was not statistically significant in Arkansas, Maine, Mississippi, South Carolina, and Vermont.
(NB2): The percent change in abortion rates was not statistically significant in Maine, Mississippi, New Mexico, North Carolina, Utah, and
       Vermont.
(NB3): The percent change in birth rates was not statistically significant in Alaska, Delaware, Hawaii, Indiana, Kansas, Mississippi, Missouri,
       New Hampshire, and Pennsylvania.
=================================================================================================================================================
Return to top. Table_10 Note: To print large tables and graphs users may have to change their printer settings to landscape and use a small font size.
TABLE 10. Percent change * in pregnancy rates, + abortion rates, & and birth rates @ for black 15- to 19-year-olds, by state --
United States, 1990 compared with 1980
===========================================================================================================================================
                                                                     Blacks
                         -------------------------------------------------------------------------------------------------
                               Pregnancy rates                   Abortion rates                      Birth rates
                         ----------------------------     ----------------------------     -------------------------------
                                           Percent                          Percent                             Percent
State                     1980    1990   change (NB1)      1980    1990   change (NB2)      1980       1990   change (NB3)
--------------------------------------------------------------------------------------------------------------------------
Alabama                   ++      ++          NA           ++      ++          NA           52.6       55.3         5
Alaska                    ++      ++          NA           ++      ++          NA           52.9       53.8         2
Arizona                   84.6    99.9        18           23.8    27.6        16           60.8       72.3        19

Alabama                   **      **          NA           **      **          NA          102.9      105.3         2
Alaska                    **      **          NA           **      **          NA           ++         ++          NA
Arizona                  128.0   153.5        20           25.8    38.4        49          102.2      115.1        13
Arkansas                 135.8   157.2        16           17.9    25.2        41          117.9      131.9        12
California               204.2    **          NA          122.3    **          NA           82.0      101.0        23

Colorado                  &&      &&          NA           &&      &&          NA           84.2      105.9        26
Connecticut               **      **          NA           **      **          NA           85.1      102.5        20
Delaware                  **      **          NA           **      **          NA          109.7      120.4        10
District of Columbia      **      **          NA           **      **          NA           73.5      121.4        65
Florida                   **      **          NA           **      **          NA          124.3      135.0         9

Georgia                  142.9   162.5        14           33.5    46.3        38          109.4      116.2         6
Hawaii                    ++      ++          NA           @@      @@          NA           ++         ++          NA
Idaho                     ++      ++          NA           @@      @@          NA           ++         ++          NA
Illinois                 160.5    **          NA           40.2    **          NA          120.3      144.2        20
Indiana                  144.7   158.0         9           35.5    35.6         0          109.3      122.4        12

Iowa                      **      **          NA           **      **          NA          117.8      119.1         1
Kansas                   175.2   181.1         3           56.2    49.2       -13          119.0      131.9        11
Kentucky                  **     164.1        NA           **      48.3        NA          106.1      115.8         9
Louisiana                 &&     128.8 ***    NA           &&      19.6 ***    NA          108.3 ***  109.1 ***     1
Maine                     ++      ++          NA           @@      @@          NA           ++         ++          NA

Maryland                 129.1   141.8        10           54.3    46.3       -15           74.8       95.5        28
Massachusetts             **      **          NA           **      **          NA           69.5       89.5        29
Michigan                  **      **          NA           **      **          NA           90.8      131.1        44
Minnesota                199.6   219.4        10           89.1    67.7       -24          110.5      151.7        37
Mississippi              130.3   130.5         0           10.1    17.8        76          120.2      112.7        -6

Missouri                 159.3   197.5        24           46.0    53.6        16          113.4      143.9        27
Montana                   ++      ++          NA           @@      @@          NA           ++         ++          NA
Nebraska                  **      **          NA           **      **          NA          112.3      135.1        20
Nevada                   178.7   156.8       -12           56.6    27.5       -51          122.1      129.3         6
New Hampshire             **      **          NA           **      **          NA           ++         ++          NA

New Jersey               135.3   181.6        34           40.9    82.0       101           94.4       99.6         5
New Mexico               131.4   115.5       -12           36.6    20.9       -43           94.8       94.6         0
New York                 161.1   166.4         3           88.6    90.8         2           72.6       75.6         4
North Carolina           131.3   157.3        20           44.1    50.7        15           87.2      106.6        22
North Dakota              ++      ++          NA           @@      @@          NA           ++         ++          NA

Ohio                     139.6   170.1        22           41.8    40.6        -3           97.8      129.4        32
Oklahoma                 152.9    **          NA           29.5    **          NA          123.4      116.0        -6
Oregon                   165.1   178.0         8           64.5    70.0         9          100.6      108.0         7
Pennsylvania              **      **          NA           **      **          NA           86.8      124.8        44
Rhode Island              **     198.9        NA           **      84.6        NA           92.8      114.3        23

South Carolina           114.2   127.0        11           22.5    25.9        15           91.7      101.1        10
South Dakota              ++      ++          NA           @@      @@          NA           ++         ++          NA
Tennessee                134.1   165.6        24           34.0    44.4        30          100.0      121.3        21
Texas                     **     153.6        NA           **      39.6        NA          110.4      114.0         3
Utah                      ++      ++          NA           @@      @@          NA           ++         ++          NA

Vermont                   ++      ++          NA           @@      @@          NA           ++         ++          NA
Virginia                 125.1   149.1        19           43.7    50.6        16           81.4       98.5        21
Washington                **      &&          NA           **      &&          NA           81.7       94.3        15
West Virginia             **     103.9        NA           **      29.5        NA           74.9       74.4        -1
Wisconsin                 **      **          NA           **      **          NA          126.2      174.7        39
Wyoming                   **      **          NA           **      **          NA           ++         ++          NA
--------------------------------------------------------------------------------------------------------------------------
  * Percent change is rounded to whole numbers.
  + The sum of live births and legal induced abortions per 1,000 women.
  & Legal induced abortions per 1,000 women. Abortions obtained by women of unknown age or race/ethnicity in each state were
    distributed according to distribution of known age or race/ethnicity in that state (for states reporting age or race/ethnicity).
  @ Live births per 1,000 women.
 ** Because abortion data were not available, rates could not be calculated.
 ++ Rates not calculated for states with <=20 births to black women ages 15-19 years or if there were <=1,000 black women ages 15-19
    years.
 && Rates not calculated because >=15% of abortions were obtained by women of unknown age or race/ethnicity.
 @@ Rates not calculated for states with <=20 abortions obtained by black women ages 15-19 years or if there were <=1,000 black women
    ages 15-19 years.
*** Rates for all races other than white.
NA = Not available.
(NB1): The percent change in pregnancy rates was not statistically significant in Kansas, Minnesota, Mississippi, New Mexico, and Oregon.
(NB2): The percent change in abortion rates was not statistically significant in Indiana, Kansas, New York, Ohio, and Oregon.
(NB3): The percent change in birth rates was not statistically significant in Alabama, Arizona, Delaware, Iowa, Louisiana, Nevada, New
       Mexico, Oklahoma, Oregon, and West Virginia.
===========================================================================================================================================
Return to top. Table_1A Note: To print large tables and graphs users may have to change their printer settings to landscape and use a small font size.
TABLE 1A. Number of states with available pregnancy, abortion, and birth data -- 1990
================================================================================================
      Age and
race/ethnicity group       Pregnancy          Abortion             Birth
--------------------------------------------------------------------------
15-19 yrs
  All races                 40+DC *            40+DC *             50+DC
  White                      34 +               34 +               50+DC
  Black                      34 +               34 +               50+DC
  Hispanic                   28 &               28 &               48+DC @

15-17,18-19 yrs
  All races                  40 **              40 **              50+DC
  White                      34 +               34 +               50+DC
  Black                      34 +               34 +               50+DC
  Hispanic                   28 &               28 &               48+DC @
--------------------------------------------------------------------------
 * Except for Alabama, Alaska, California, Connecticut, Delaware, Florida, Illinois, Iowa, New
   Hampshire, and Oklahoma.
 + Except for states in * and the District of Columbia, Massachusetts, Michigan, Nebraska,
   Pennsylvania, Wisconsin, and Wyoming.
 & Except for areas in * and + and Kentucky, Louisiana, Maine, Maryland, North Carolina, and
   South Dakota.
 @ Except for New Hampshire and Oklahoma.
** Except for states in * and the District of Columbia.
DC=District of Columbia.
================================================================================================
Return to top. Disclaimer All MMWR HTML versions of articles are electronic conversions from ASCII text into HTML. This conversion may have resulted in character translation or format errors in the HTML version. Users should not rely on this HTML document, but are referred to the electronic PDF version and/or the original MMWR paper copy for the official text, figures, and tables. An original paper copy of this issue can be obtained from the Superintendent of Documents, U.S. Government Printing Office (GPO), Washington, DC 20402-9371; telephone: (202) 512-1800. Contact GPO for current prices. **Questions or messages regarding errors in formatting should be addressed to mmwrq@cdc.gov.Page converted: 09/19/98 |
|||||||||
This page last reviewed 5/2/01
|