Persons using assistive technology might not be able to fully access information in this file. For assistance, please send e-mail to: mmwrq@cdc.gov. Type 508 Accommodation and the title of the report in the subject line of e-mail.
ESSENCE II and the Framework for Evaluating
Syndromic Surveillance Systems*
Joseph S. Lombardo,1 H. Burkom,1 J. Pavlin2
1Johns Hopkins University Applied Physics Laboratory, Laurel, Maryland;
2Walter Reed Army Institute of Research, Silver Spring, Maryland
Corresponding author: Joseph S. Lombardo, Johns Hopkins University Applied Physics Laboratory, 11100 Johns Hopkins Rd, Laurel, MD 20723. Telephone: 443-778-6287; Fax: 443-778-5026; E-mail:
Joe.Lombardo@jhuapl.edu.
Abstract
Introduction: The Electronic Surveillance System for the Early Notification of Community-Based Epidemics
(ESSENCE II) is a prototype syndromic surveillance system for capturing and analyzing public health indicators for early detection of disease outbreaks.
Objectives: This paper presents a preliminary evaluation of ESSENCE II according to a CDC framework for
evaluating syndromic surveillance systems.
Methods: Each major topic of the framework is addressed in this assessment of ESSENCE II performance.
Results: ESSENCE captures data in multiple formats, parses text strings into syndrome groupings, and applies multiple temporal and spatio-temporal outbreak-detection algorithms. During a recent DARPA evaluation exercise,
ESSENCE algorithms detected a set of health events with a median delay of 1 day after the earliest possible detection opportunity.
Conclusions: ESSENCE II has provided excellent performance with respect to the framework and has proven to be
a useful and cost-effective approach for providing early detection of health events.
Introduction
In response to the threat of biologic terrorism and the
resurgence of virulent forms of infectious diseases,
technologic advances are being applied to disease surveillance. Syndromic surveillance systems have emerged to capture and analyze health-indicator data to identify abnormal health conditions and enable early detection of outbreaks. Given the limited public health experience with biologic terrorism and the variety of possible terrorism scenarios, the research community is exploring
the application of advanced detection technology to prediagnostic syndromic data. In 2003, CDC issued a draft framework for evaluating syndromic surveillance systems
(1), which was later revised and published in
MMWR (2). The CDC framework is designed for evaluation of relatively mature, fully operational syndromic surveillance systems. The technology to support syndromic surveillance is just maturing, with current operational experience gained from test-bed use. This paper applies
the framework to the Electronic Surveillance System for the Early Notification of
Community-Based Epidemics (ESSENCE), a series of prototype systems developed by Johns Hopkins University Applied Physics Laboratory (JHU/APL) and the
Division of Preventive Medicine at the Walter Reed Army Institute of Research.
System Description
Purpose
Multiple versions of ESSENCE have been developed, each for different purposes. ESSENCE I provides
worldwide surveillance for military personnel and their dependents at all military treatment facilities by using ambulatory
records generated for TriCare, the military's health-care system. ESSENCE II is a regional system that supports advanced
surveillance within the National Capital Region (NCR) test bed. The system is being developed by
JHU/APLin collaboration with the Maryland Department of Health and Mental Hygiene, the District of Columbia Department of Health, and the Virginia Department of Health. Other versions of ESSENCE have been developed for military facilities and deployed forces.
This description focuses on ESSENCE II only.
ESSENCE II is a test-bed system for 1) evaluating nontraditional health-care indicators, 2) developing and
evaluating analytic techniques for early identification of abnormal disease patterns, and 3) providing an integrated view of NCR
military and civilian health department data
(3) (Figure 1). The system captures data on military ambulatory visits and
prescription medications and merges them with civilian emergency department (ED) chief-complaint records,
school-absenteeism data, over-the-counter (OTC) and prescription medication sales, civilian ambulatory visits, veterinary health records, and health department requests for influenza testing. All data are de-identified by their providers before being transferred to
ESSENCE II, where they are archived, analyzed, and provided through secure Internet sites to local health departments and to hospitals that have data-sharing agreements with their health departments.
Stakeholders
NCR health departments conduct surveillance by using ED chief-complaint data from hospitals within and around
the District of Columbia metropolitan area. ESSENCE II helps automate the processes of capturing hospital data, parsing chief-complaint text strings, and analyzing data for
abnormalities.
ESSENCE technology is being used to form a regional collaborative disease-surveillance network. The network consists
of four major nodes, one at each state and District of Columbia health department and a regional node for performing
analysis across jurisdictional boundaries. The architecture
permits fully identifiable information to be captured and archived at
health departments for patients within their jurisdiction. The regional node negotiates the acquisition and distribution of data
(e.g., military health-care data and OTC medication sales) across the region. The architecture also permits
de-identification, aggregation, and sharing of information among the region's health departments while increasing the sensitivity for detection of abnormal health events occurring across jurisdictional boundaries.
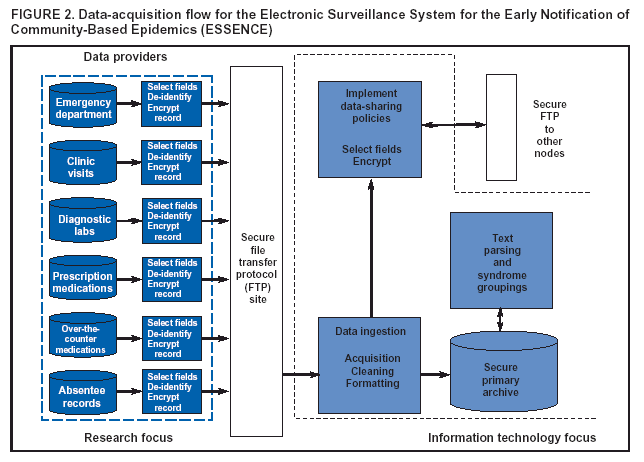
Operation
The data flow through an ESSENCE II node is illustrated (Figures 2 and
3).First, to expedite data collection and
maintain confidentiality, the data providers create automated query software to extract recent data elements from their archives.
These extractions are assembled into a de-identified update record, encrypted, and posted to a secure file transfer protocol (FTP) site. The query software automatically executes at a regular interval (e.g., daily at midnight or once every 8 hours) that can
be changed easily. Although ESSENCE II can accept Health Level 7 (HL7)
(4) data streams, the majority of data providers
prefer the automated query approach. ESSENCE II polls the FTP sites to look for new entries, which are then ingested, cleaned, formatted, and archived in the primary system
archive.
Data-sharing policies across the region have not been
approved by all NCR health departments. After these policies
are approved, selected data fields or aggregates of counts will be transmitted to other nodes in the network.
Chief-complaint data from hospital EDs 1) are received as text strings, which are of variable length; 2) include
punctuation, misspellings, or abbreviations; and 3) can use varying syntax and vocabularies. A chief-complaint parsing algorithm developed for ESSENCE II converts text strings into syndrome groupings
(5). The syndrome groupings agreed to by the NCR
health departments aredeath,
gastrointestinal, neurologic,
rash, respiratory, sepsis, unspecified, and other, but the chief-complaint
parsing algorithm can easily accommodate modifications. After ED data are entered into the primary archive, the
parsing algorithm automatically converts the text strings into syndrome groupings. When the parser's performance is compared with that of human coders, the parser provides, on average, 97% sensitivity and 99% specificity. Whenever new hospital EDs are added to the system, the parser's performance is assessed to adjust for unfamiliar textual information. The algorithm provides approximately perfect conversion into syndrome groupings for the most prevalent syndromes
(respiratory and gastrointestinal) and degraded
performance for those less frequent
(neurologic).
In addition to ED chief-complaint information, ESSENCE II also receives data from physician-encounter claims in
the form of International Classification of Diseases, Ninth
Revision (ICD-9) codes and from retail merchants in the form
of Universal Product Codes (UPCs) for OTC medications. These data are grouped into the same syndrome categories as
the chief-complaint data to enable outbreak detection by
syndrome.
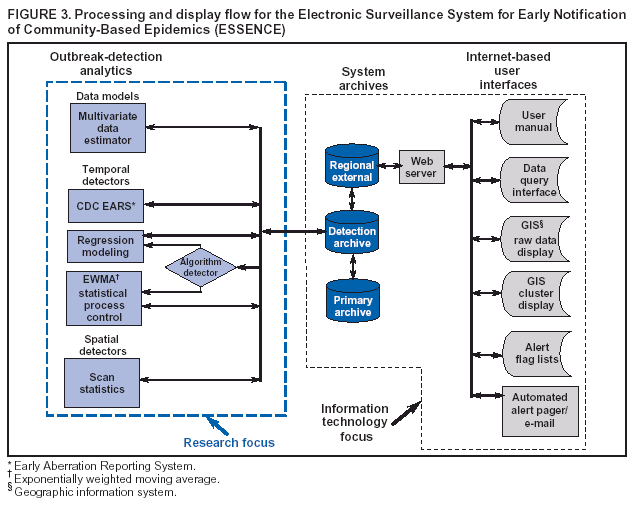
Next, ESSENCE II applies outbreak-detection algorithms. These algorithms use a working archive known as the
detection archive. New records are moved into the detection archive at the launching of the detection process. The detection algorithms are run every 4 hours, although this interval is adjustable.
ESSENCE II can accommodate HL7 data streams if they are
available from the hospital. Temporal and spatio-temporal algorithms are implemented in ESSENCE II to determine abnormalities. Also included are reference algorithms for assessing the performance enhancement provided by the
ESSENCE II algorithms. CDC's Early Aberration Reporting System (6) algorithms were chosen as reference algorithms because they were already in use by regional health departments.
ESSENCE II uses two temporal algorithms: 1) an autoregressive modeling algorithm that predicts syndrome counts
and looks for differences between actual counts and estimates and 2) the exponentially weighted moving average (EWMA),
a statistical process control method. Details on these algorithms are published elsewhere
(7). The autoregressive algorithm is based on a linear regression model that predicts a continually fluctuating daily expected count and threshold. The model bases its daily predictions on the previous 4 weeks of ESSENCE data, accounting for the day of the week and whether the day is
a
holiday or the day after a holiday. (The holiday function serves to explain artificial peaks in the data attributable to surges
in patient visits after days when clinics are closed.) EWMA compares each observation to an average of past data that
weights observations exponentially by time so that the most recent observations are most influential. Therefore, EWMA can be
used when daily visit counts do not have the temporal structure required by a regression model.
ESSENCE II uses a built-in goodness-of-fit statistic to determine whether the regression is useful in explaining the data; when this test fails, the automated checking process switches to EWMA.
A variant of the spatial scan statistic
(8) is used to form clusters in time and space across the region by using zip codes as
the smallest spatial resolution. The scan statistic has been modified to include multiple sources
(9), which increases the sensitivity while controlling the false-alert rate.
ESSENCE II uses a secure website to transfer information to its users. Users must use individual passwords to access
the website and can only access information for their respective jurisdictions. Four ESSENCE II portals enable users to view
raw data and results from processed data:
A map portal displays geographic distribution of raw data and clusters formed by scan statistics. The user can select data elements for geographic display and access details by clicking on the location of the data provider or the zip code(s)
of interest. The details can be presented as tables or time graphs.
The second portal provides alert lists for the output of the detection processes. These lists consist of color-coded flags to indicate algorithm outputs that are higher than expected. Upper confidence limits (UCLs) for the daily predictions
are computed and used as alerting thresholds. If an observed count exceeds the 95% UCL but not the 99% UCL, a
low-level (yellow) alert is generated; if it exceeds the 99% UCL, a high-level (red) flag results. The user can organize the lists
to provide flags on data of interest, sort lists by elements of interest, and access data or link to the map portal to view
the spatial distribution that resulted in the flag.
The query portal enables a user interested in specific data to select from drop-down menus and view selected
data elements over a selected timeframe as graphs or tables. All tabular information can be cut and pasted into
a spreadsheet program for analysis offline.
The fourth portal enables users to generate summary
reports for export outside ESSENCE II. The user can
select any data elements in the archive and view historic counts as well as upward or downward trends. This portal also contains tutorial material on operating ESSENCE II and a message board for making suggestions to developers or
sharing thoughts with other users.
Outbreak Detection
Timeliness
The purpose of syndromic surveillance is to detect as early as possible abnormal disease patterns that could result in
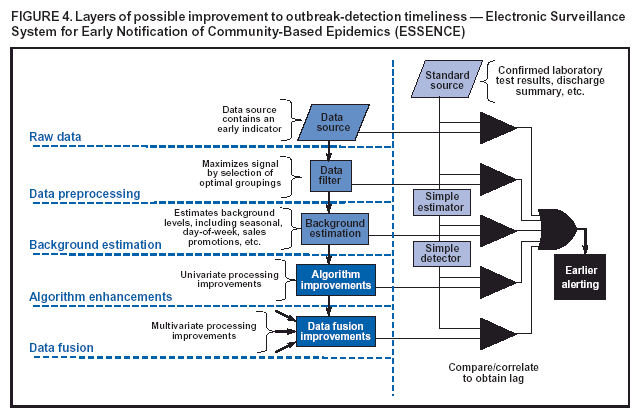
high mortality. This new technology should be evaluated and compared with traditional techniques to determine whether it improves upon detection timeliness.At least five layers
of possible improvement exist (Figure 4). At each layer,
the improvement is compared with a standard method to
determine whether timelier notification is possible.
The first layer is the acquisition of a data source that contains an early indicator. For example, one promising data source is the nurse hotline service provided by certain health-care organizations.
The second layer involves filtering of the data stream to more closely match the population that exhibits early symptoms of disease. For example, because symptoms consistent with the release of a biologic agent at a facility (e.g., the Pentagon) would probably be observed among active-duty personnel at that facility, military data could be filtered by age to separate active-duty, retired, and dependent populations.
The third layer removes confounders from nontraditional data sources. For example, OTC medication sales are
strongly influenced by sales promotions, seasonal effects, and day-of-week activity, as well as by the socioeconomic status of the community in which the sale occurred. ESSENCE II uses algorithms to model these confounders and remove
their influence, thus allowing identification of the underlying pattern attributable solely to increases in disease.
The fourth layer addresses improvements to outbreak-detection algorithms that use a single data stream. Signal processing, regression modeling, and process control methods have been used to monitor single data streams.
The fifth layer addresses multivariate methods for gaining sensitivity needed for early recognition of an abnormality.
Improvements at any of the five layers or combination of layers can improve notification timeliness.
CDC's framework (1,2) provides a timeline, consisting of nine "anchor points," for measuring timeliness and performance of syndromic surveillance. The first three anchor points,
point-source exposure, symptom onset, and
health-seeking behavior, are independent of system performance; symptom onset is a function of the incubation period of the disease, and health-seeking behaviors depend on socioeconomic factors. The fourth
anchor, capture of the behavior in the
record, varies by data source, taking only seconds for scanning in OTC medications or hours to days for electronic claims. The fifth anchor point, data source ready to share, depends on the data provider and on system
requirements for data updates. Data can be sent in real time (e.g., an HL7
feed from a hospital), hourly, daily, or at other predetermined intervals (e.g., ED chief-complaint data could be accumulated over 1 day and sent at midnight). ESSENCE II accepts both HL7 and ED chief-complaint data feeds. The data-ingestion
module within ESSENCE II automates the capture data into the
system process (anchor point six) within seconds. The seventh
anchor point, apply pattern-recognition
tools/algorithms, is also a function of the data-capture rate. If data are captured in real time,
the detection algorithms must also operate in near real time. If data are captured daily, then the algorithms must be applied daily. ESSENCE II captures data throughout the day and applies the detection process
every 4 hours but can alter the processing period when real-time data are received. After the detection process is complete, the automated alert generation process (anchor
point eight) takes only seconds to minutes. The ninth anchor point,
initiate public health response, depends upon policies and
personnel at individual health departments and is independent of the syndromic
surveillance system.
Validity
Algorithm performance can also be evaluated by detection of actual disease events within the community. In summer 2003, the ESSENCE II project participated in a blind evaluation conducted by the Defense Advanced Research Projects Agency (DARPA) Bio-ALIRT Program (11). This evaluation provided the opportunity for independent validation of
results from the ESSENCE II outbreak-detection process and independent evaluation of participating syndromic surveillance systems.
To conduct the evaluation, DARPA assembled an independent team of epidemiologists and physicians to identify respiratory
and gastrointestinal events in data streams from five cities. The data included military and civilian
ambulatory records and military prescription records. Team members identified eight respiratory and seven gastrointestinal events and, given only the raw data streams, were asked to estimate 1) start dates for the event, 2) date when a health department might recognize the event, 3)
the peak of the event, and 4) the end of the event. Participants whose algorithms were being evaluated were provided only the raw data streams and asked to identify events.
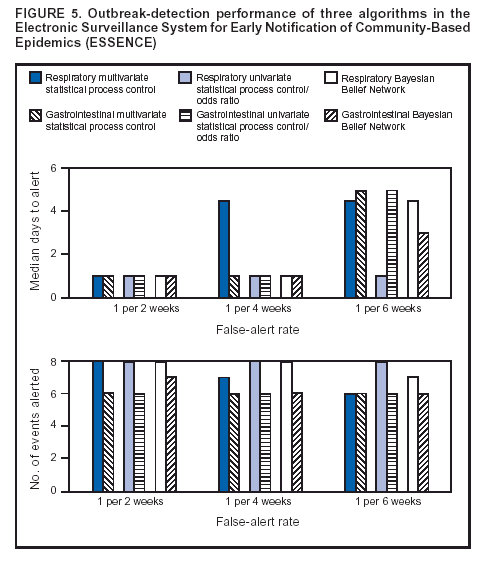
Three ESSENCE II detection methods were selected for this evaluation
(10): 1) a multivariate statistical process
control algorithm applied to the residuals of a regression technique used to control for unexplained data dropouts, 2) a multiple univariate method based on the EWMA control chart, and 3) a Bayesian Belief Network applied to the outputs of the first two algorithms to optimize the decision for the two detectors. The results of these algorithms' detection performance
and timeliness are provided as a function of false-alert rate, for rates of one false alert every 2 weeks, 4 weeks, or 6 weeks (Figure 5). In this context, a false alert does not imply the need for a laborious outbreak investigation but rather a more detailed review
of the data and use of human judgment to dismiss alerting flags. For the highest false-alert rate, all three algorithms detected
the eight respiratory events with a median detection time of 1 day after the start of the event (as determined by the
epidemiology team). If the false-alert rate was constrained to once every 6 weeks, only the multiple univariate SPC method maintained its level of performance. For gastrointestinal events, only the Bayesian
Belief Network successfully detected all seven events with
a median delay of 1 day. Results might vary when the same algorithms are
applied to other data streams and other seasons.
The majority of events used in the evaluation were seasonal epidemics attributable to colder weather, limited
outdoor activity, and increased communicability during holiday gatherings; few, if any, of the cases comprising these events would result in death or were reportable diseases.
Experience
System Usefulness
ESSENCE II is used routinely by the Montgomery County (Maryland) Department of Health and Human Services
for different purposes, including to accredit county hospitals for the capability to respond to mass casualties resulting from terrorism, to identify foodborne outbreaks, and to provide general knowledge of the county's health status. The department also requests changes to detection thresholds during
high-profile events in the region that might affect public health in
the county. The county health department continues to find new uses for ESSENCE II outputs; in 2004, it used the
system to determine when to initiate and cancel an
influenza-vaccination program.
Flexibility and Portability
ESSENCE II acquires data feeds with minimal burden to data providers. The system accepts different data standards
for acquisition and data sharing. Adding a new data source is more of a legal chore than a technical one because sources can be added with minimal hours of coordination or software development. ESSENCE is designed to enable persons with
minimal programming skill to create new syndrome categories or change syndrome groupings in minutes. The system also allows users to access historic data to perform retrospective studies.
Multiple versions of ESSENCE II exist to accommodate different jurisdictions, data volumes, and data providers for
both military preventive medicine and civilian health departments. ESSENCE II is also being provided to state and local
health departments. Modifications are needed for local geographic shape files, zip codes, and data providers; these modifications can be performed by state health department IT staff.
System Acceptability
Acceptance by the majority of data providers has been
exceptional. Currently, the test-bed version of ESSENCE II is
used primarily when the level of risk increases. After the NCR network is fully implemented, usage levels are expected to
increase. Full implementation is expected in 2004.
System Stability
Versions of ESSENCE II have been acquiring data since 1999 and have operated since then with minimal interruption.
The system's size and complexity have expanded from the NCR military population and certain Maryland counties to include all
of Maryland, Virginia, and the District of
Columbia.
System Costs
System size and cost are a function of the jurisdiction's size, the number of data providers, and
thesize of the epidemiology department assigned to surveillance and follow-up. A minimum county-level configuration requires one or two computers, $15,000 for off-the-shelf software, one part-time epidemiologist, and one part-time IT professional.
Cost-effectiveness depends upon the resources of the health department and the vulnerability of its population.
Conclusions
ESSENCE IIis the firstdisease-surveillance system to incorporate both military and civilian data to improve the sensitivity and specificity of detecting abnormal disease
occurrence. The design requires minimal resources from data providers,
thus encouraging their participation. Research into algorithm improvements has been enhanced by operation of a test bed and
by rapid upgrades to test improvements in an operational environment. Implementation of the NCR
disease-surveillance network should provide operational insights for other jurisdictions considering collaborative surveillance systems.
CDC's framework for evaluating syndromic surveillance systems provides a needed reference for developers and
health departments wishing to develop and implement new systems. Evaluation would be enhanced if CDC provided standard data sets to test the processes embedded within the systems and provide a benchmark for comparing system performance.
References
Sosin D. Draft framework for evaluating syndromic surveillance systems. J Urban Health 2003;80(2 Suppl 1):i8--13.
Lombardo J. A systems overview of the Electronic Surveillance System for Early Notification of Community-based Epidemics (ESSENCE II).
J Urban Health 2003;80(2 Suppl 1):i32--42.
Health Level Seven, Inc. Health Level 7. Ann Arbor, MI: Health Level Seven, Inc., 2001. Available at
http://www.hl7.org.
Sniegoski C. Methodology for categorizing emergency department chief records for syndromic surveillance. Presentation, Annual Meeting of
the American Public Health Association, 2003. Available at
http://apha.confex.com/apha/131am/techprogram/paper_68724.htm.
Hutwagner L. The bioterrorism preparedness and response Early
Aberration Reporting System. J Urban Health 2003;80 (2 Suppl 1):i89--96.
Burkom H, Elbert YA. Development, adaptation, and assessment of alerting algorithms for biosurveillance. Johns Hopkins University
Applied Physics Laboratory Technical Digest 2003;24:335--42.
Kulldorff M. A spatial scan statistic. Communications in Statistics---Theory and Methods 1997;26:1481--96.
Burkom H. Biosurveillance applying scan statistics with multiple disparate data sources. J Urban Health 2003;80(2 Suppl 1):i57--65.
* This research is sponsored by the Defense Advanced Research Projects Agency (DARPA) and managed under Naval Sea Systems
Command (NAVSEA) contract N00024-98-D-8124. The views and conclusions contained in this document are those of the authors and should not
be interpreted as necessarily representing the official policies, either expressed or implied, of DARPA, NAVSEA, or the U.S. Government.
Use of trade names and commercial sources is for identification only and does not imply endorsement by the U.S. Department of
Health and Human Services.References to non-CDC sites on the Internet are
provided as a service to MMWR readers and do not constitute or imply
endorsement of these organizations or their programs by CDC or the U.S.
Department of Health and Human Services. CDC is not responsible for the content
of pages found at these sites. URL addresses listed in MMWR were current as of
the date of publication.
Disclaimer
All MMWR HTML versions of articles are electronic conversions from ASCII text
into HTML. This conversion may have resulted in character translation or format errors in the HTML version.
Users should not rely on this HTML document, but are referred to the electronic PDF version and/or
the original MMWR paper copy for the official text, figures, and tables.
An original paper copy of this issue can be obtained from the Superintendent of Documents,
U.S. Government Printing Office (GPO), Washington, DC 20402-9371; telephone: (202) 512-1800.
Contact GPO for current prices.
**Questions or messages regarding errors in formatting should be addressed to
mmwrq@cdc.gov.