|
|
|
|
|
|
|
|
|
|
|
|
|
|
|
|
|
||||
| ||||||||||
|
|
|
|
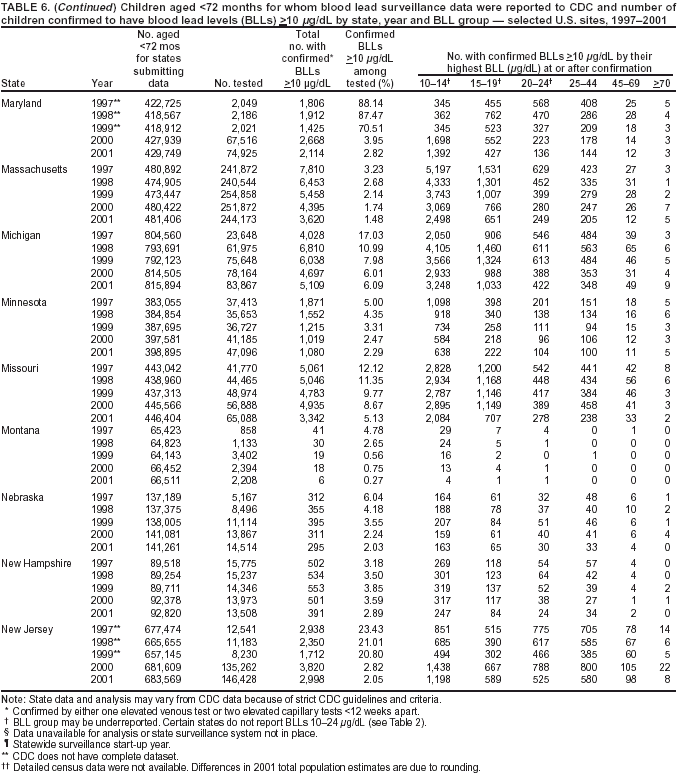
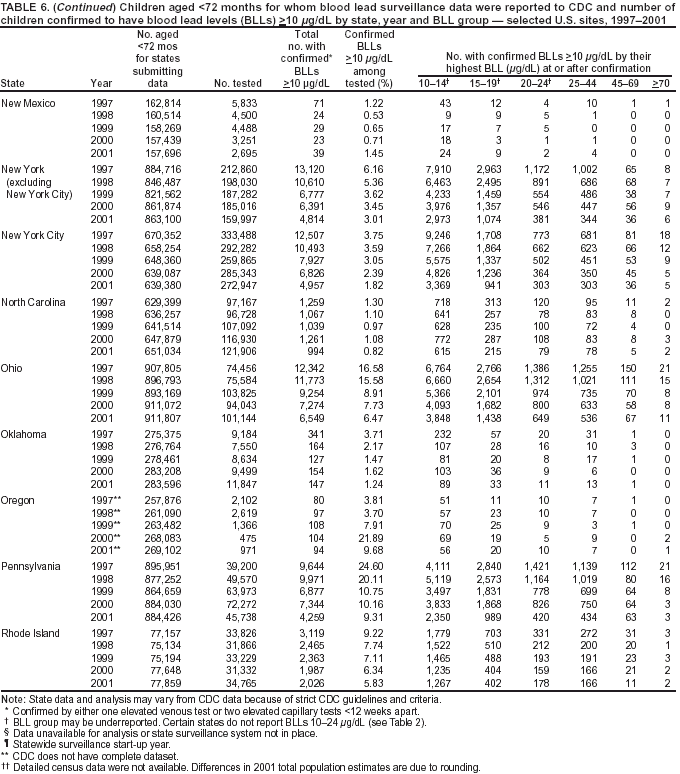
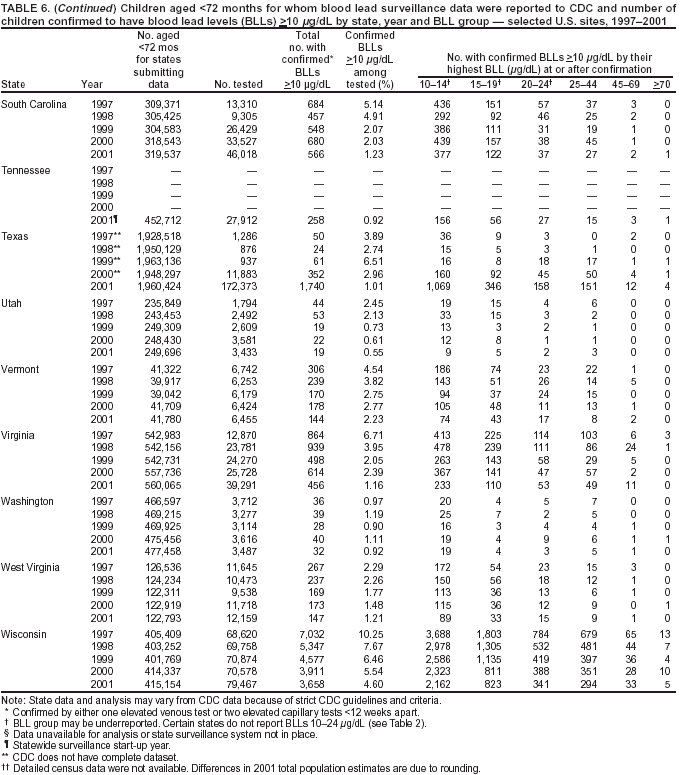
|
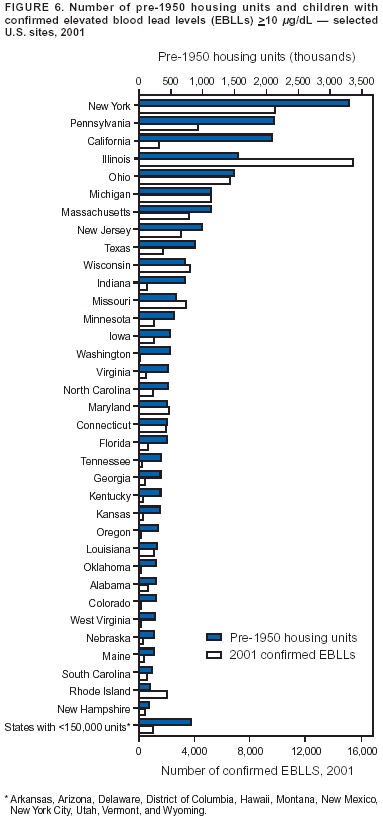
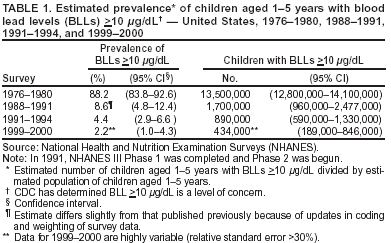
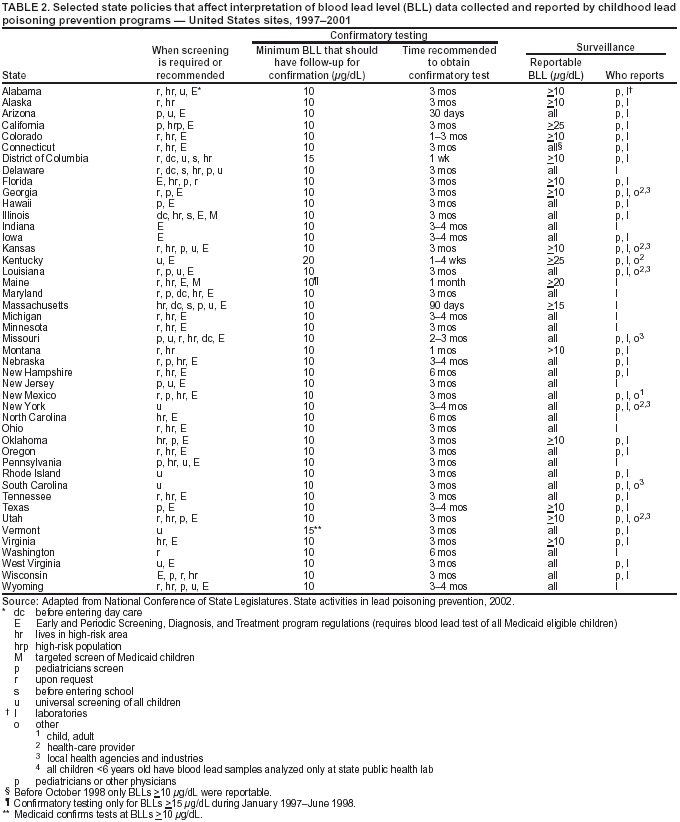
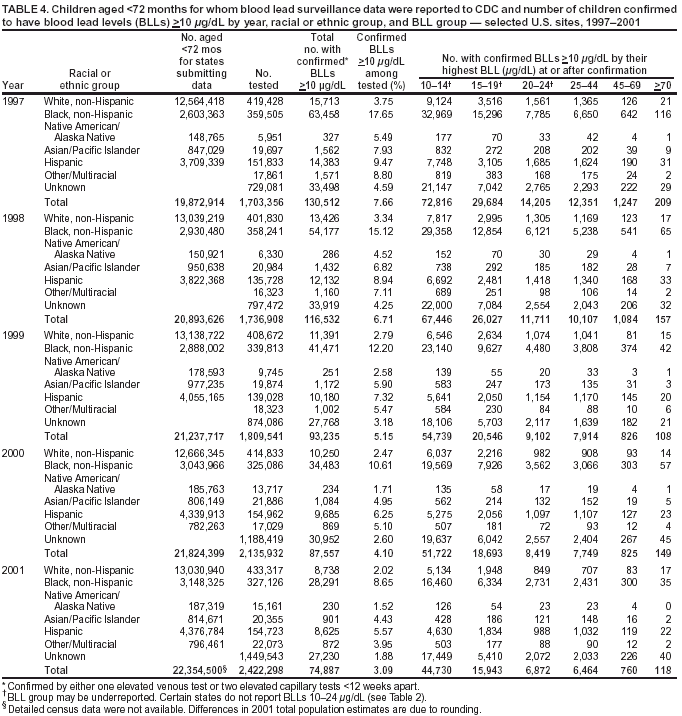
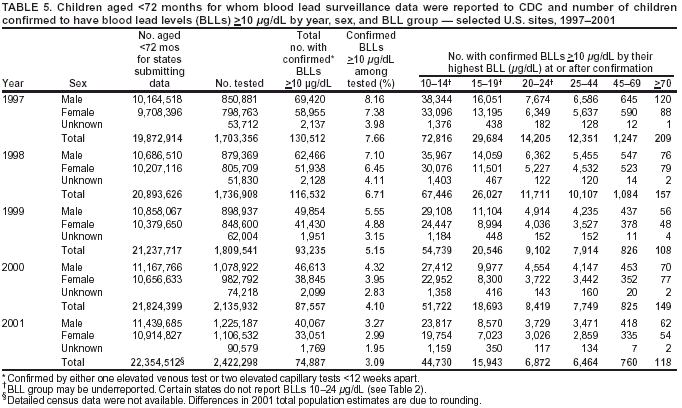
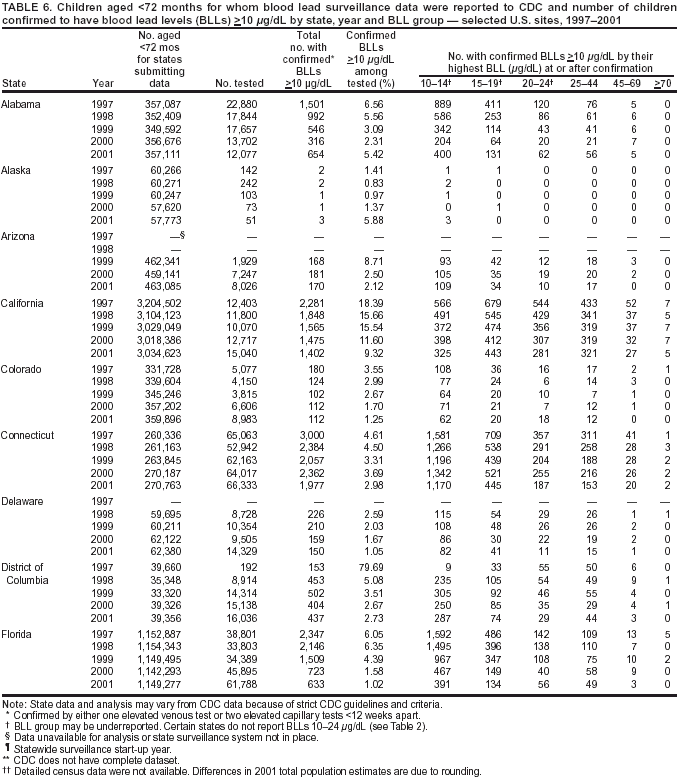
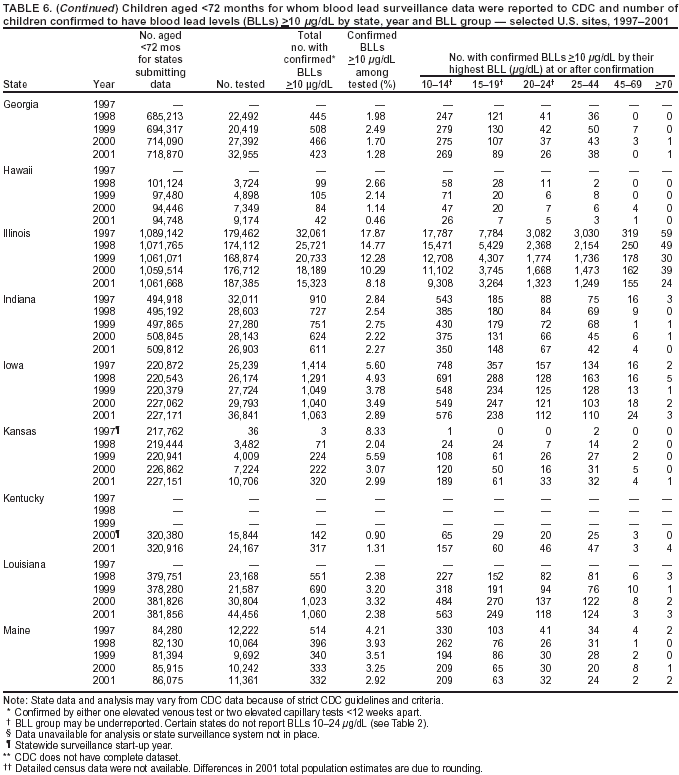
Persons using assistive technology might not be able to fully access information in this file. For assistance, please send e-mail to: mmwrq@cdc.gov. Type 508 Accommodation and the title of the report in the subject line of e-mail. Surveillance for Elevated Blood Lead Levels Among Children --- United States, 1997--2001Pamela A. Meyer, Ph.D.1 Abstract Problem/Condition: Lead is neurotoxic and particularly harmful to the developing nervous systems of fetuses and young children. Extremely high blood lead levels (BLLs) (i.e., >70 µg/dL) can cause severe neurologic problems (e.g., seizure, coma, and death). However, no threshold has been determined regarding lead's harmful effects on children's learning and behavior. In 1990, the U.S. Department of Health and Human Services established a national goal to eliminate BLLs >25 µg/dL by 2000; a new goal targets elimination of BLLs >10 µg/dL in children aged <6 years by 2010. Reporting Period: Information regarding children's BLLs comes from 1) National Health and Nutrition Examination Surveys (NHANES) conducted during 1976--1980, 1988--1991, 1991--1994, and 1999--2000; and 2) state child blood lead surveillance data for test results collected during 1997--2001. Description of System: CDC tracks children's BLLs in the United States by using both NHANES and state and local surveillance data. NHANES reports data regarding children aged 1--5 years; state and local surveillance systems report data regarding children aged <72 months. Because lead exposure in children varies among populations and communities, both surveys are needed to determine the burden of elevated BLLs among young children throughout the United States. NHANES uses highly standardized data-collection procedures and probability samples to gather information regarding the health and nutritional status of the civilian, noninstitutionalized U.S. population. State and local childhood lead surveillance systems are based on reports of blood lead tests from laboratories. State and local programs submit data to CDC annually. In this report, confirmed elevated BLLs are defined as one venous blood specimen >10 µg/dL or two capillary blood specimens >10 µg/dL drawn within 12 weeks of each other. Results: The NHANES 1999--2000 survey estimated that 434,000 children (95% confidence interval = 189,000--846,000) or 2.2% of children aged 1--5 years had BLLs >10 µg/dL. For 2001, a total of 44 states, the District of Columbia (DC), and New York City (NYC) submitted child blood lead surveillance data to CDC. These jurisdictions represent 95% of the U.S. population of children aged <72 months and 97% of the nation's pre-1950 housing. The number of children tested and reported to CDC increased from 1,703,356 in 1997 (37 states, DC, and NYC reporting), to 2,422,298 in 2001 (44 states, DC, and NYC reporting). During that time, the number of children reported with confirmed elevated BLLs >10 µg/dL steadily decreased from 130,512 in 1997 to 74,887 in 2001. In 2000, the year targeted for national elimination of BLLs >25 µg/dL, a total of 8,723 children had BLLs >25 µg/dL. Interpretation: Both national surveys and state surveillance data indicate children's BLLs continue to decline throughout the United States. However, thousands of children continue to be identified with elevated BLLs. The 2000 goal of eliminating BLLs >25 µg/dL was not met. Attaining the 2010 goal of eliminating BLLs >10 µg/dL will require intensified efforts to target areas at highest risk, evaluate preventive measures, and improve the quality of surveillance data. Public Health Actions: States will continue to use surveillance data to 1) promote legislation supporting lead poisoning prevention activities, 2) obtain funding, 3) identify risk groups, 4) target and evaluate prevention activities, and 5) monitor and describe progress toward elimination of BLLs >10 µg/dL. CDC will work with state and local programs to improve tracking systems and the collection, timeliness, and quality of surveillance data. IntroductionExposure to lead can damage the nervous, hematopoietic, and renal systems (1,2) and is particularly harmful to the developing nervous systems of fetuses and children aged <72 months. Extremely elevated blood lead levels (BLLs) >70 µg/dL can cause severe neurologic problems (e.g., seizure, coma, and death) (3). Although severe cases are rare today (4), the threshold for harmful effects of lead remains unknown. Since 1975, as new data became available, CDC has revised its recommendations regarding the threshold of BLLs that should raise concern and trigger interventions (5--7). By 1991, CDC had lowered the BLL threshold 66.6% to 10 µg/dL, from 30 µg/dL in 1975 (5,7), in response to studies in the late 1980s that linked BLLs as low as 10 µg/dL with decreased intelligence and other adverse neurodevelopmental effects (8--11). Ongoing research conducted since 1991 provides evidence of adverse effects at even lower levels, <10 µg/dL, among children aged <72 months (12--16). The principal sources of lead exposure for children in the United States are house dust contaminated by leaded paint and soil contaminated by both leaded paint and decades of industrial and motor vehicle emissions (1). Lead was widely used in paint through the 1940s. Although lead use declined during the 1950s and 1960s (17), and lead was banned from residential use in 1978*, lead remains a hazard in homes built before the ban, especially in pre-1950 housing. During 1991--1994, CDC's National Health and Nutrition Examination Survey (NHANES) determined the prevalence of BLLs >10 µg/dL was highest among children living in pre-1946 homes (8.6%), compared with children living in homes built during 1946--1973 (4.6%), and after 1973 (1.6%). Among children living in pre-1946 housing, prevalence of BLLs >10 µg/dL differed substantially by family income. Prevalence among children from low-income families was 16.4%, compared with 4.1% and 0.9% among children from middle- and high-income families (18). National Elimination GoalsThe U.S. Department of Health and Human Services (DHHS) established a national goal to eliminate BLLs >25 µg/dL in children aged 6 months--5 years by 2000. This goal was announced in September 1990 in Healthy People 2000 (19). The next year, the U.S. Public Health Service released its Strategic Plan for the Elimination of Childhood Lead Poisoning (20). The plan called for a societywide effort to eliminate lead poisoning as a public health problem by 2011. Lead poisoning was defined as BLLs >25 µg/dL, but the plan noted CDC was considering lowering that level. The plan called for 1) more childhood lead poisoning prevention programs and activities; 2) effective abatement of leaded paint and leaded paint-contaminated dust in housing; 3) continued reduction of children's exposure to lead in the environment; and 4) establishment of nationwide surveillance for children with elevated BLLs. By the end of the 1990s, a new Healthy People 2010 target had been established to eliminate BLLs >10 µg/dL among children aged 1--5 years by 2010 (21). The baseline data used to monitor progress toward this target are provided by NHANES, which provides nationally representative and comparable estimates for monitoring trends but cannot determine local variations in the risk for elevated BLLs (22,23). Therefore, state and local data are necessary to develop effective prevention measures and monitor their progress toward elimination of elevated BLLs. Prevention Programs EstablishedCDC funds state and local programs to develop childhood lead poisoning prevention programs and surveillance activities. The objectives of these childhood lead poisoning prevention programs (CLPPPs) are to 1) screen infants and children for elevated BLLs; 2) ensure that lead-poisoned infants and children are referred for medical and environmental intervention; 3) educate the public and health-care providers regarding childhood lead poisoning; and 4) implement prevention measures to reduce children's exposure to lead. Before child lead screening programs, neurologic findings associated with acute encephalopathy were often the first signs of lead poisoning, and children with these symptoms required immediate hospitalization and treatment (24). Because symptoms are rare at BLLs <70 µg/dL, blood lead screening is necessary to identify asymptomatic children with elevated BLLs. Therefore, in 1991, CDC recommended universal screening of children aged 12--72 months. However, a 1994 national survey reported that only one fourth of young children had been screened, including fewer than one third of those at increased risk (e.g., because of poverty or residence in older housing) (25). In addition, certain populations of children were determined to be heavily exposed, whereas others were only minimally exposed (26), depending on risk factors such as poverty level and housing. Consequently, in 1997, CDC recommended that states use data to develop plans to increase screening and follow-up care for children who most need these services. In the absence of a statewide plan or other formal guidance from health officials, universal screening for all young children was still recommended (27). This report describes national trends in children's BLLs >10 µg/dL obtained by using data from NHANES surveys (i.e., 1976--1980, 1988--1991, 1991--1994 and 1999--2000) and state data collected by the state Child Blood Lead Surveillance (CBLS) system during 1997--2001. Also described is the distribution of pre-1950 housing existing in the United States in 2000. MethodsNational SurveysSince the 1970s, the extent of human lead exposure has been assessed in the United States by using NHANES, a series of cross-sectional, nationally representative examination surveys conducted by CDC's National Center for Health Statistics. NHANES data indicate distribution of BLLs among the national population, not at state or local levels. Each survey is a stratified, multistage, cluster sample of households with a target population of civilian, noninstitutionalized residents of the United States (28). The surveys include a household interview and a standardized physical examination conducted in a mobile examination center. This report includes results from the first two years (1999--2000) of the current NHANES, as well as previous results from NHANES II (1976--1980), NHANES III, Phase 1 (1988--1991) and NHANES III, Phase 2 (1991--1994). As part of the NHANES physical examination, a 1 mL sample of ethylenediaminetetraacetic acid-anticoagulated whole blood was obtained by venipuncture from children aged 1--5 years. Blood specimens were frozen and shipped for analysis from the survey sites to the NHANES Laboratory, Division of Environmental Health Laboratory Sciences, National Center for Environmental Health, CDC, Alanta, Georgia. All analyses of BLLs were performed at CDC's NHANES Laboratory. The laboratory methods, including quality control and assurance procedures, have been described previously (29,30). Comparability has also been established for the method used in NHANES II (i.e., modified Delves cup) and that used in NHANES III and the current NHANES (i.e., graphite furnace atomic absorption spectrophotometry). In all surveys, blood lead measurements were calibrated by using standards obtained from the National Institute of Standards and Technology, Gaithersburg, Maryland. State and Local SurveillanceState and local childhood blood lead surveillance systems are based on the results of blood lead tests of children aged <72 months reported to state health departments by private and state and local government laboratories. Reporting criteria, such as the level that should be reported and who should report, are set by each state and vary across jurisdictions. In addition to funding multiple state programs, CDC also funds certain city and county programs that forward surveillance data to state health departments. Test results, which are compiled and analyzed by state health departments and submitted annually to CDC, comprise the CBLS database. In conjunction with staff from participating states, CDC staff developed core data variables to be collected for every child tested. These variables include identification and demographic information (e.g., date of birth, race, or ethnicity), laboratory information (e.g., venous or capillary blood specimen), date of specimen collection, and test result. Individual identifiers are stripped from the records, but each child is assigned a unique identifier that is sent to CDC along with the data. To assist CLPPPs with tracking the care of children with elevated BLLs, CDC developed a computer software program, Systematic Tracking of Elevated Lead Levels and Remediation (STELLAR). Certain states use STELLAR; others have developed their own programs. CDC checks each state-submitted record for correct formatting and coding and inconsistent values. Records not meeting CDC criteria are summarized in error reports that are sent to states for correction. Certain errors, if not corrected, prevent the record from being entered in CDC's CBLS database. A common error is an illogical sequence of dates on a laboratory record (i.e., date of test analysis is earlier than date blood was drawn). AnalysisIn this report, state surveillance data are presented for children aged <72 months who were tested for lead at least once during 1997--2001. The following surveillance definitions are used for all states: Test: Any BLL sample (i.e., capillary, venous, or unknown type) that produces a quantifiable result and is analyzed by a Clinical Laboratory Improvement Amendments (CLIA)-certified facility or an approved portable device. Blood for a lead test can be collected for screening, confirmation, or follow-up. Screening test: A blood lead test for a child aged <72 months who has not had a previously confirmed elevated BLL. A child screened in multiple years or even multiple times within a given year is counted only once for each year. Confirmed elevated BLL: A child with one venous blood specimen >10 µg/dL or two capillary blood specimens >10 µg/dL drawn within 12 weeks of each other (31,32). CLPPPs check for duplicate laboratory reports for children and assign a unique identifier for each child before sending the data to CDC. Children with confirmed elevated BLLs who subsequently have another elevated test result, regardless of test type, are included in the tables only once for each year they had an elevated BLL test result. In subsequent years, children with previously confirmed elevated BLLs but no follow-up tests, or only follow-up tests with BLLs <10 µg/dL, are not counted for those subsequent years. We assign children with confirmed elevated BLLs into six BLL groups with program relevance (i.e., >10 µg/dL to <15, >15 to <20, >20 to <25, >25 to <45, >45 to <70, and >70). The majority of states initiate follow-up testing at BLLs >10 µg/dL and environmental investigations at either >20 µg/dL or persistent BLLs 15--19 µg/dL; chelation is recommended for children with BLLs >45 µg/dL; and BLLs >70 µg/dL represent a medical emergency. These analyses are also categorized by state, race or ethnicity, sex, and age group. To assess the extent of testing among children using Medicaid services, a low-income group at high risk for elevated BLLs (33), state and local health departments collaborate with their Medicaid agencies to link blood lead surveillance data with Medicaid data. This report presents data regarding which state and local CLPPPs link surveillance and Medicaid data. Population data in this report were obtained from the U.S. Bureau of the Census. For each year, population data are only included for states with reported surveillance data. Population data used include intercensal population estimates for 1997--1999, the 2000 census, and postcensal estimates for 2001. Statistical analyses for NHANES were performed with SAS software (34) and SUDAAN® (35), a software package that incorporates sample weights and adjusts analyses for the complex sample design of the survey. Survey sample weights were used in all analyses to produce estimates representative of the noninstitutionalized, civilian U.S. population. Analyses of the state surveillance data used SAS. ResultsNational SurveysThe prevalence of BLLs >10 µg/dL in children aged 1--5 years living in the United States has continued to decline from an estimated 88.2% during the 1976--1980 NHANES II survey (Figure 1). In 1999--2000, the prevalence estimate was 2.2% (95% confidence interval [CI] = 1.0%--4.3%) (Table 1). By applying that prevalence to the U.S. population of children in this age group, we estimated that 434,000 (95% CI = 189,000--846,000) children aged 1--5 years had elevated BLLs. However, because of low prevalence of elevated BLLs and a limited sample size, the NHANES 1999--2000 estimates are highly variable. State and Local SurveillanceBy 2001, 44 states, the District of Columbia (DC), and New York City (NYC) were submitting child blood lead surveillance data to CDC. These sites represent 95% of the U.S. population of children aged <72 months and 97% of pre-1950 housing. By the end of 2001, all states with CDC-associated CLPPPs were requiring laboratories to report results of blood lead tests; however, states varied regarding the BLL level at which results had to be reported (Table 2). In 2001, 29 (64.4%) of the participating jurisdictions required all BLLs to be reported; 12 (26.7%) required reporting only for BLLs >10 µg/dL; one (2.2%) required reporting only for BLLs >15 µg/dL; one (2.2%) required reporting only for BLLs >20 µg/dL; and two (4.4%) required reporting only for BLLs >25 µg/dL. Children TestedThe number of BLL-tested children reported to CDC increased from 1,703,356 in 1997 (37 states, DC, and NYC) to 2,422,298 in 2001 (44 states, DC, and NYC). For all years, the largest group of children tested were aged 12--23 months, followed by those aged 24--35 months (Table 3). Race or ethnicity information was not collected (i.e., was unknown) for approximately half of the children tested. For all years, among the tested children for whom race or ethnicity was reported (range: 57% in 1997 to 40.2% in 2001), approximately 43% were non-Hispanic whites, 35% were non-Hispanic blacks, 15% were Hispanic, and 7% were of other races or ethnicities (Table 4). For all years, slightly more boys than girls were tested (Table 5). More than half of all tests were conducted by six states and NYC (NYC 11.3%, Massachusetts 10.1%, Illinois 7.7%, Texas 7.1%, New York 6.6%, New Jersey 6%, and North Carolina 5%) (Table 6). During 1997--2001, 28 states reported matching surveillance and Medicaid data to assess the percentage of children eligible for or receiving Medicaid services who had received a blood lead test (Figure 2). However, these states used different methods to assess lead testing among Medicaid-eligible or Medicaid-enrolled children, making findings difficult to compare. For example, certain states that link surveillance and Medicaid data might also link these with birth records. Also, states used different definitions for Medicaid-eligible and Medicaid-enrolled and different age cutoffs for analysis. Eight states that matched Medicaid data with surveillance data reported that 17.2%--52.9% of Medicaid enrollees aged <72 months had been tested for lead. Confirmed Elevated BLLsThe number of children reported with confirmed elevated BLLs steadily decreased from 130,512 in 1997 to 74,887 in 2001. Among children with elevated BLLs and known race or ethnicity (range: 74.3% in 1997 to 63.6% in 2001), approximately 17% were non-Hispanic whites, 60% were non-Hispanic blacks, 16% were Hispanic, and 7% were of other races or ethnicities (Table 4). In each racial or ethnic group, the number of children with elevated BLLs declined steadily from 1997 to 2001. Each year, more boys than girls had elevated BLLs (Table 5). Five states and NYC reported 54% of the confirmed elevated BLLs in 2001 (Illinois, 20.5%; Ohio, 8.7%; Michigan, 6.8%; NYC, 6.6%; New York, 6.4%; and Pennsylvania, 5.7%) (Table 6). In 2001, 59.7% of children with elevated BLLs had levels of 10--14 µg/dL; 21.3% had levels of 15--19 µg/dL; 9.2% had levels of 20--24 µg/dL; 8.6% had levels of 25--44 µg/dL; 1% had levels of 45--69 µg/dL; and 0.2% had levels >70 µg/dL (Figure 3). In 2000, a total of 8,723 children (0.4% of those tested) were reported with BLLs >25 µg/dL, the target for elimination by 2000. In 2001, the number of children reported with BLLs >25 µg/dL decreased to 7,342 (0.3% of those tested). Among those with confirmed elevated BLLs and reported race or ethnicity, the majority were non-Hispanic blacks (Figure 4). Also, the largest numbers of children with confirmed elevated BLLs were located in northeastern and Midwestern states (Figure 5). Pre-1950 HousingThe number of existing U.S. housing units built before 1950, when paint had high lead content, decreased from 27.5 million in 1990 to 25.8 million in 2000; however, pre-1950 housing units are located in all states (range: 12,472 in Alaska to 3,309,770 in New York). In 2000, approximately 80% of the 25.8 million pre-1950 housing units in the United States were located in 21 states, and approximately 50% were located in seven states (California, Illinois, Massachusetts, Michigan, New York, Ohio, and Pennsylvania) (Figure 6). DiscussionNational surveys and state and local surveillance data both indicate children's BLLs continue to decline throughout the United States. This decline reflects changes in national policies and laws implemented since the 1970s that have limited the use of lead, including removal of lead from 1) gasoline, 2) food and soft-drink cans, 3) paint for residential use, and 4) solder in household plumbing (36). The greatest reduction in children's BLLs was observed between NHANES II (1976--1980) and NHANES III, Phase I (1988--1991), suggesting that past policies to reduce children's exposure to lead have succeeded. However, the Healthy People 2000 national goal to eliminate BLLs >25 µg/dL among young children by 2000 was not achieved, and tens of thousands of children remain exposed to lead. State and local surveillance data and previous NHANES analyses indicate children who are non-Hispanic blacks or Hispanic are more likely to have elevated BLLs than those who are non-Hispanic whites (37). Although race or ethnicity classification is missing for approximately half of those children with elevated BLLs identified and reported in the state and local surveillance data, these data suggest the number of children with elevated BLLs has steadily declined in each of these groups, which represent the three largest racial or ethnic populations. Another group previously determined to be at risk for elevated BLLs is children from low-income families (4,38). In a previous finding, Medicaid-eligible children represented 60% of children with BLLs >10 µg/dL and 83% of those with BLLs >20 µg/dL (39). However, despite their high risk for elevated BLLs, only 19% of Medicaid-eligible children aged 1--5 years had been tested for lead (40). CDC recommends that health-care providers and health plans provide blood lead screening and diagnostic and treatment services for children enrolled in Medicaid (40), which routinely reimburses for such services. State and local surveillance systems do not routinely include Medicaid information because health-care providers rarely note Medicaid status on test records. To better determine how many Medicaid-eligible or Medicaid-enrolled children have been tested for lead, states need to link their laboratory surveillance data with Medicaid data. The majority of CLPPPs have already made this link; however, different methodologies limit comparisons among states. CDC will work with these programs to standardize linking and analysis and improve comparability among states. LimitationsFindings from NHANES and state surveillance systems should be viewed as complementary but not directly comparable; substantial differences in methodology exist. Because NHANES is based on a nationally representative sample, estimates are only generalizable to the U.S. population. The sample is not designed to provide estimates for smaller geographic areas or specific populations where the risk of elevated BLLs is high. Conversely, the CLPPPs provide data at state and local levels that can be used to target screening and other interventions to children at highest risk. However, not all children at risk are tested. NHANES and CLPPPs also differ in methods used to collect blood samples. For NHANES, all blood lead tests are collected by venous sampling, a more accurate method. In contrast, certain blood lead tests reported to state health departments are collected by capillary sampling, which can be contaminated if correct blood collection procedures are not followed. Because of the risk for contamination (41), elevated capillary tests should be confirmed by a venous test or a second capillary test within 12 weeks. However, because confirmatory testing does not always occur within 12 weeks, state data might underestimate children with elevated BLLs, especially at levels of 10--14 µg/dL, among states that do not recommend confirmatory testing at that BLL (42). Also, for NHANES surveys, all samples are analyzed by the CDC laboratory, which reports all test results. In contrast, multiple laboratories analyze and report blood lead test results to CLPPPs. State-to-state comparisons of the numbers of children tested and confirmed with elevated BLLs should be made cautiously, with special attention given to varying state practices (Table 2). State practices and policies that can affect assessment of the lead problem include BLLs reported and the time recommended for follow-up testing to confirm elevated BLLs. Certain states are changing policies to improve their ability to develop and assess prevention strategies; since 2001, two more states have made all BLLs reportable for children. Because the majority of children with elevated BLLs are asymptomatic, all children at high risk should be tested; however, state testing practices vary. Children in certain racial or ethnic groups (i.e., non-Hispanic blacks and Hispanics) are at increased risk for elevated BLLs (18,33,37). CDC encourages collecting racial and ethnic data; however, a high proportion of missing racial data precludes the majority of states from knowing whether they are adequately testing children at increased risk. ConclusionSuccessful surveillance requires states to track the test results of substantial numbers of children. This has strained old computer systems and created barriers to successful submission of complete data to CDC. Also, BLL tracking systems need to integrate data across programs. To improve integration of data, increase states' abilities to submit complete data, and facilitate exchange of information for case management (e.g., environmental inspection), CDC is developing a tracking module that will become part of CDC's Internet-based tracking and reporting system, the National Electronic Disease Surveillance System (NEDSS) (43). Reports published by states can differ from this report in the numbers of children tested and identified with elevated BLLs. CDC's criteria for consistent dates and other data can preclude certain records from being entered into the CDC database. Also, certain states might publish data for older children (i.e., aged >72 months) or use different definitions in their analyses. Better comparability among states requires increased use of a uniform national surveillance case definition (44) by public health officials and researchers. Comparability is critical to accurately assess the number of children with elevated BLLs and to monitor trends, including progress toward the Healthy People 2010 goal of eliminating BLLs >10 µg/dL among young children. Reducing BLLs can be a difficult and protracted process for children with long-term exposure because lead accumulates in bones and is released slowly over time. Chelation, the only available medical therapy, has side effects and risks, might not reverse harmful effects, and does not effectively reduce BLLs in children with moderate exposure (45). CDC and others recommend screening the environment for lead to prevent exposure to children (46--50). Identifying sources of lead exposure can be challenging, especially for children who move or spend time in multiple locations. Effective identification of pre-1950 housing where young children live or are likely to live requires assessment of data from multiple sources (e.g., tax assessor, census, Medicaid, and child blood lead surveillance) and improved partnerships with other programs (e.g., prenatal care; home visits for newborns; the Women, Infants, and Children nutritional program; immunizations; and housing subsidies). Elevated BLLs among young children can be eliminated by state and local prevention activities. Beginning in 2003, state and local health departments funded by CDC for childhood lead poisoning prevention programs are required to develop formal elimination plans. Certain jurisdictions (i.e., Minnesota, Boston, Chicago, and Cleveland) already have convened lead elimination workgroups involving key representatives from health, housing, banking, and other areas involved in children's health and welfare. A critical factor in any elimination plan is use of local data to define and address local problems. Key elements for effective targeting strategies include 1) enacting state laws requiring reporting of all BLLs, 2) linking state-level environmental and Medicaid enrollment data, 3) improving overall data quality, and 4) streamlining reporting through NEDSS. CDC will continue to urge CLPPPs to direct interventions at areas with the greatest demonstrated problems, and at populations with the highest risks. State and local data, in combination with NHANES, will enable us to continue monitoring progress toward elimination of elevated BLLs among all young children. References
* 16 CFR § 1303. CDC Lead Poisoning Prevention Branch Epidemiology and Surveillance Team Wendy Blumenthal, M.P.H., Jerry Curtis, Philip Jacobs, Lemuel Turner, M.S. Battelle Participants, Darlene Wells, Jyothi Nagaraja. State Childhood Lead Poisoning Prevention Program Alabama, Chris Seller, manager*; Alaska, Charles Wood, manager, Charles Utermohle, coordinator†; Arizona, Judy Norton, manager, Christine Cervantez Young, coordinator; California, Joseph Courtney, PhD, manager, Jeff Sanchez, coordinator; Colorado, Mishelle Macias, coordinator; Connecticut, Renee D. Coleman-Mitchell, manager, Karen Frost, MA, coordinator; Delaware, Russell Dynes, manager, Michelle Guevara, coordinator; District of Columbia, Christine Onwuche, manager, Obiora Offor, coordinator; Florida, Trina Thompson, manager; Georgia, Stic Harris, MPH, manager; Hawaii, Gwen Palmer, manager; Illinois, Ron Brown, manager, Cheryl Wycoff, coordinator; Indiana, Nancy Cobb, manager; Iowa, Rita M. Gergely, manager, Brian McPartland, coordinator; Kansas, Robin Norris, manager; Kentucky, Joy Hoskins, manager, Neal Rosenblatt, coordinator; Louisiana, Liya Aklilu, MPH, manager, Felicia Rabito, PhD, coordinator; Maine, Mary Ann Amrich, manager; Maryland, Barbara Conrad, MPH, manager, Sharon Seligson, coordinator; Massachusetts, Paul Hunter, manager, Marc Silverman, coordinator; Michigan, Sharon R. Hudson, manager, Robert Scott, coordinator; Minnesota, Andrea Michael, manager, Myron Falken, coordinator; Missouri, Susan Thomas, manager, Patty Osman, coordinator; Montana, Amy McKenzie, manager, Nebraska, Todd Falter, manager, Kimberly Hayes-Plouzek, coordinator; New Hampshire, Carol DeLaurier, manager, Chris Cullinan, coordinator; New Jersey, Kevin McNally, MBA, manager, Joseph A. Sweatlock, Ph.D., coordinator; New Mexico, Glenda Hubbard, manager, Randy Merker, coordinator; New York, Kenneth Boxley, manager, Janet Wikoff, coordinator; New York City, Deborah Nagin, MPH, manager, Karen Gurnitz, coordinator; North Carolina, Edward H. Norman, M.P.H., manager, Tena H. Ward, coordinator; Ohio, John Belt, M.Ed, coordinator; Oklahoma, Shari Kinney, manager, Amy Fletcher and John Braggio, Ph.D., coordinators; Oregon, Richard Leiker, manager; Pennsylvania, Annette Jacek, manager, Harold Rothenberger, coordinator; Rhode Island, Magaly Angeloni, manager, Anne Primeau-Faubert, coordinator; South Carolina, Mildred Lee Tanner, manager, Janice Eichelberger, coordinator; Tennessee, Joy Cook, EdD, manager; Texas, Teresa Willis, manager, Ella Deleon, coordinator; Utah, Wayne Ball, PhD, manager, Mark Jones, coordinator; Vermont, Amy Sayre, manager, Matthew Pettnegill, coordinator; Virginia, Nancy Van Voorhis, coordinator; Washington, Eric Ossiander, manager; West Virginia, Kathy Cummons, manager, Syamalatha Dasari, coordinator; Wisconsin, Margie Joose Coons, manager, Debi Peters, coordinator; Wyoming, Debi Nelson, manager. * Program manager. Figure 1 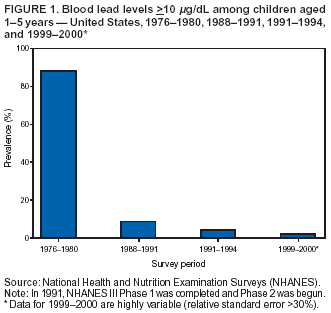 Return to top. Figure 2 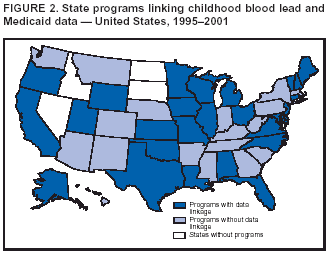 Return to top. Figure 3  Return to top. Figure 4  Return to top. Figure 5  Return to top.
All MMWR HTML versions of articles are electronic conversions from ASCII text into HTML. This conversion may have resulted in character translation or format errors in the HTML version. Users should not rely on this HTML document, but are referred to the electronic PDF version and/or the original MMWR paper copy for the official text, figures, and tables. An original paper copy of this issue can be obtained from the Superintendent of Documents, U.S. Government Printing Office (GPO), Washington, DC 20402-9371; telephone: (202) 512-1800. Contact GPO for current prices. **Questions or messages regarding errors in formatting should be addressed to mmwrq@cdc.gov.Page converted: 8/27/2003 |
|||||||||
This page last reviewed 8/27/2003
|