Persons using assistive technology might not be able to fully access information in this file. For assistance, please send e-mail to: mmwrq@cdc.gov. Type 508 Accommodation and the title of the report in the subject line of e-mail.
Racial and Ethnic Differences in Breastfeeding Initiation and Duration, by State --- National Immunization Survey, United States, 2004--2008
The American Academy of Pediatrics recommends exclusive breastfeeding to age 6 months and continued breastfeeding for at least the first year of life (1). The Healthy People 2010 (HP2010) targets (16-19a--c) for initiating breastfeeding, breastfeeding to age 6 months, and breastfeeding to age 12 months, are 75%, 50%, and 25%, respectively. National estimates from the United States indicate substantial racial/ethnic differences in breastfeeding (2). To monitor state-specific progress toward achieving the HP2010 objectives for breastfeeding initiation and duration among different racial/ethnic groups, CDC analyzed 2004--2008 National Immunization Survey (NIS) data for children born during 2003--2006. This report summarizes the results of that analysis, which found that non-Hispanic blacks had a lower prevalence of breastfeeding initiation than non-Hispanic whites in all but two states; Hispanics generally had lower prevalence than non-Hispanic whites in western states and higher in eastern states. Most states were not meeting the HP2010 targets for breastfeeding duration for any racial/ethnic group. Breastfeeding should be promoted through comprehensive clinical and social supports starting in pregnancy, and including the birth, delivery, and postpartum periods.
NIS is an ongoing, random-digit--dialed survey in 50 states and the District of Columbia that includes households with children aged 19--35 months at the time of interview (3). Although the survey primarily is intended to estimate national, state, and selected urban area vaccination coverage rates, questions on breastfeeding initiation and duration were added to NIS in 1999. Because children are aged 19--35 months at the time of the NIS interview, each cross-sectional survey includes children born in 3 different calendar years. To maximize sample size and allow for representative state-level analyses stratified by racial/ethnic group, data from the 2004--2008 surveys were combined to create a cohort of children born during 2003--2006. Council of American Survey Research Organizations (CASRO) response rates for NIS 2004--2008 ranged from 63% to 72%.* The child's race/ethnicity, and mother's age, education, and participation in the Women, Infants, and Children (WIC) supplemental nutrition program were self-reported. Data were suppressed when sample size was <50 because of unstable estimates. Because of inadequate sample sizes for other racial/ethnic groups, analyses by state were restricted to children whose racial/ethnic groups were categorized as Hispanic, non-Hispanic white, or non-Hispanic black. Data were weighted to adjust for households with multiple telephone lines, household nonresponse, and exclusion of households without landline telephones. Estimates were adjusted using final survey weights to correct for nonresponse (3). T-tests were used to determine whether estimates for Hispanics and non-Hispanic blacks were significantly different (p<0.05) from estimates for non-Hispanic whites.
To assess breastfeeding initiation, survey participants were asked "Was [child] ever breastfed or fed breast milk?" To assess breastfeeding duration, in NIS 2004 and 2005, survey participants were asked "How long was [child] breastfed or fed breast milk?" The wording changed slightly for NIS 2006 onwards to "How old was [child's name] when [child's name] completely stopped breastfeeding or being fed breast milk?"; these changes had a minimal effect on estimates of breastfeeding duration.†
National estimates for breastfeeding initiation and duration to 6 months and 12 months were 73.4%, 41.7%, and 21.0%, respectively (Table 1). Breastfeeding estimates varied by race/ethnicity, participation in the WIC supplemental nutrition program, and mother's age and education.
In the state-specific analysis, for all but two states (Minnesota and Rhode Island), prevalence of breastfeeding initiation was lower among non-Hispanic blacks than non-Hispanic whites, although these differences were not significant in all such states (Table 2). In 13 states, the difference between non-Hispanic blacks and non-Hispanic whites was ≥20 percentage points, with the largest differences observed predominantly in southeastern states. In six states the prevalence of breastfeeding initiation among non-Hispanic blacks was less than 45%. In general, compared with non-Hispanic whites, lower prevalence of breastfeeding initiation was observed among Hispanics in western states and higher prevalence was observed among Hispanics in eastern states.
Among states with sample sizes sufficient for analysis (≥50 respondents per group), Hispanics, non-Hispanic whites, and non-Hispanic blacks met the HP2010 targets§ for breastfeeding initiation of 75% in 33 of 49, 27 of 51, and one of 33 states, respectively (Figure). For breastfeeding duration, Hispanics, non-Hispanic whites, and non-Hispanic blacks met the HP2010 targets of 50% breastfeeding to 6 months in eight of 49, 14 of 51, and two of 33 states, and of 25% breastfeeding to 12 months in 12 of 49, 14 of 51, and three of 33 states, respectively.
Reported by
KS Scanlon, PhD, L Grummer-Strawn, PhD, R Li, PhD, J Chen, MS, Div of Nutrition, Physical Activity and Obesity, National Center for Chronic Disease Prevention and Health Promotion; N Molinari, PhD, Immunization Svcs Div, National Center for Immunization and Respiratory Diseases; CG Perrine, PhD, EIS Officer, CDC.
Editorial Note
Breastfeeding provides a wide range of benefits to the mother, child, and community, and reaching a higher prevalence of infant breastfeeding is an important public health goal. In 1984, the Surgeon General held the first Workshop on Breastfeeding. In 1990, breastfeeding targets were included in HP2000, and in 2000, the U.S. Department of Health and Human Services released Blueprint for Action on Breastfeeding¶ (4). Since 1990, national estimates of breastfeeding initiation have shown a consistent increase, and the overall national prevalence is close to reaching the HP2010 target of 75% (4). However, racial and ethnic differences in breastfeeding are substantial, and, as shown in this report, the national prevalence of breastfeeding initiation among non-Hispanic blacks is far from the HP2010 target. In 1990 the difference in breastfeeding initiation prevalence between non-Hispanic blacks and non-Hispanic whites was 35 percentage points (4). The results described in this report indicate that by 2003--2006, this difference had declined to 20 percentage points nationally. However, many states still have large differences, particularly in the southeastern United States, where 13 states had a prevalence of breastfeeding initiation that was ≥20 percentage points different between non-Hispanic blacks and non-Hispanic whites.
National estimates for breastfeeding to 6 months also have increased consistently since 1990 (4). However, despite overall progress in breastfeeding duration, no improvement has been observed in reducing the difference between non-Hispanic blacks and non-Hispanic whites. In 1990, the difference in prevalence of breastfeeding to 6 months between non-Hispanic blacks and non-Hispanic whites was approximately 16 percentage points, the same as shown in this report for 2003--2006. Surveillance data for breastfeeding to 12 months are more limited and suggest modest increases nationally since 1999.
Many factors are associated with not breastfeeding, including younger maternal age, lower income, lower maternal education, and being unmarried (4). However, previous analyses, including analyses of NIS data, have shown that differences in breastfeeding between non-Hispanic blacks and non-Hispanic whites exist across most of these sociodemographic groups (5). For example, among women with a college degree, non-Hispanic blacks were less likely to breastfeed than non-Hispanic whites. Other possible contributors to the differences include lack of culturally relevant information and images of non-Hispanic black women breastfeeding, perceptions that breastfeeding is inferior to formula feeding, non-Hispanic black women returning to work sooner (where support for breastfeeding often is insufficient), lack of social or partner support, and lack of knowledge of the health benefits associated with breastfeeding (6).
The results of the analysis in this report, like previous national estimates, suggest that overall Hispanics have slightly higher rates of breastfeeding initiation than non-Hispanic whites (2). However, the analysis found that this relationship varied by state, with many states east of the Mississippi River having lower estimates among Hispanics compared with non-Hispanic whites. Some of this difference might be explained by acculturation and length of residence in the United States. Previous research has shown that the longer Hispanic women live in the United States, the less likely they are to breastfeed, and the more likely they are to perceive formula feeding as acceptable (7).
Numerous factors contribute to a woman's decision to breastfeed, including social and cultural norms, social support, guidance and support from health-care providers, work environment, and the media. The CDC Guide to Breastfeeding Interventions** recommends various strategies to improve breastfeeding practices in many of these areas, allowing state and local communities to adapt the interventions that best meet their needs. A better understanding of the underlying factors contributing to the racial/ethnic differences in breastfeeding is needed to develop specific interventions for addressing the differences. In the meantime, directing some of these broader interventions at non-Hispanic black populations might help to reduce disparities in breastfeeding. For example, some studies have suggested that intention to breastfeed is lower among non-Hispanic black women because they are more comfortable with formula feeding (8).
The findings in this report are subject to at least three limitations. First, estimates do not control for other sociodemographic factors that might be associated with breastfeeding. For example, participation in WIC has been associated with lower breastfeeding rates, and non-Hispanic black women might be more likely to participate in WIC. However, previous analyses have shown that racial/ethnic differences in breastfeeding exist independent of other sociodemographic factors. Second, mothers were asked about their breastfeeding behaviors when their child was aged 19--35 months, which is after many women in the United States stop breastfeeding, and therefore might be subject to recall bias. However, mothers accurately recall initiation and duration of breastfeeding, especially when recall is within 3 years; whether accuracy of recall varies by race/ethnicity is unknown (9). Finally, NIS is a landline telephone survey; although statistical adjustments adequately compensate for noncoverage of households without landline telephones, some nonresponse and noncoverage bias might remain (10).
To continue to work toward reducing racial/ethnic disparities in breastfeeding, CDC is reassessing strategies for promoting and supporting breastfeeding among non-Hispanic black women. In December 2009, CDC hosted a meeting with a group of experts in the area of breastfeeding among non-Hispanic black women. Outcomes from the meeting and directions forward are being finalized.
References
- Gartner LM, Morton J, Lawrence RA, et al. Breastfeeding and the use of human milk. Pediatrics 2005;115:496--506.
- CDC. Breastfeeding among U.S. children born 1999--2006, CDC National Immunization Survey. Available at http://www.cdc.gov/breastfeeding/data/nis_data/index.htm. Accessed March 23, 2010.
- CDC. Statistical methodology of the National Immunization Survey, 1994--2002. Vital Health Stat 2005;2(138).
- Grummer-Strawn LM, Shealy K. Progress in protecting, promoting, and supporting breastfeeding: 1984--2009. Breastfeeding Med 2009;4:S31--9.
- CDC. Racial and socioeconomic disparities in breastfeeding. MMWR 2004;55:335--9.
- Ludington-Hoe S, McDonald PE, Satyshur R. Breastfeeding in African-American women. J Natl Black Nurses Assoc 2002;13:56--64.
- Gill S. Breastfeeding by Hispanic women. J Obstet Gynecol Neonatal Nurs 2009;38:244--52.
- Nommsen-Rivers LA, Chantry CJ, Cohen RJ, Dewey KG. Comfort with the idea of formula feeding helps explain ethnic disparity in breastfeeding intentions among expectant first time mothers. Breastfeed Med 2010;5:25--33.
- Li R, Scanlon KS, Serdula MK. The validity and reliability of maternal recall of breastfeeding practice. Nutr Rev 2005;63:103--10.
- Molinari N, Wolter KM, Skalland B, et al. Quantifying bias in a health survey: an application of total survey error modeling to the National Immunization Survey. Presented at the annual meeting of the American Association for Public Opinion Research, May 14--17, 2009, Hollywood, FL.
* The CASRO household response rate is the product of the resolution rate (82.3%--83.9%), the screening completion rate (90.2%--94.9%), and the interview completion rate (84.2%--92.0%).
† Additional information available at http://www.cdc.gov/breastfeeding/data/nis_data/survey_methods.htm.
§ Additional information available at http://www.healthypeople.gov/document/pdf/volume2/16mich.pdf.
¶ Available at http://www.womenshealth.gov/breastfeeding/programs/blueprints/index.cfm.
** Available at http://www.cdc.gov/breastfeeding/pdf/breastfeeding_interventions.pdf.
What is already known on the topic?
National estimates indicate that non-Hispanic black women are less likely to initiate breastfeeding and more likely to stop breastfeeding than Hispanic and non-Hispanic white women.
What is added by this report?
Differences in breastfeeding between Hispanics and non-Hispanic whites varied by state, and rates were lower among non-Hispanic blacks in almost all states.
What are the implications for public health practice?
Breastfeeding should be promoted through comprehensive clinical and social supports starting in pregnancy, and including the birth, delivery, and postpartum periods.
|
TABLE 2. (Continued) Prevalence of breastfeeding initiation and duration to 6 months and 12 months,* by state and race/ethnicity --- National Immunization Survey, United States, 2004--2008† |
||||
|---|---|---|---|---|
|
Breastfeeding |
||||
|
No. of respondents |
Initiation |
6 months |
12 months |
|
|
State, Race/Ethnicity |
% (95% CI§) |
% (95% CI) |
% (95% CI) |
|
|
Kansas |
||||
|
Hispanic |
279 |
76.2 (69.9--82.5) |
38.4 (30.9--45.9) |
18.4 (12.3--24.5) |
|
White, non-Hispanic |
1,238 |
76.9 (73.7--80.1) |
42.8 (39.4--46.2) |
19.8 (17.2--22.4) |
|
Black, non-Hispanic |
55 |
63.9 (48.4--79.4) |
32.8 (17.6--48.0) |
19.7 (5.4--34.0) |
|
Kentucky |
||||
|
Hispanic |
80 |
65.8 (52.0--79.6) |
32.3 (21.1--43.5) |
10.8 (4.0--17.6) |
|
White, non-Hispanic |
1,154 |
54.8 (51.3--58.3) |
26.1 (23.3--28.9) |
12.7 (10.6--14.8) |
|
Black, non-Hispanic |
94 |
36.4 (25.8--47.0)¶ |
11.1 (4.6--17.6)¶ |
2.8 (0.4--6.0)¶ |
|
Louisiana |
||||
|
Hispanic |
156 |
58.4 (47.1--69.7) |
22.4 (15.0--29.8) |
9.8 (5.0--14.6) |
|
White, non-Hispanic |
1,290 |
59.8 (56.3--63.3) |
24.4 (21.8--27.0) |
10.9 (9.1--12.7) |
|
Black, non-Hispanic |
556 |
31.8 (27.1--36.5)¶ |
13.6 (10.1--17.1)¶ |
3.8 (2.1--5.5)¶ |
|
Maine |
||||
|
Hispanic |
--- |
--- |
--- |
--- |
|
White, non-Hispanic |
1,032 |
76.2 (73.1--79.3) |
45.9 (42.5--49.3) |
26.7 (23.8--29.6) |
|
Black, non-Hispanic |
--- |
--- |
--- |
--- |
|
Maryland |
||||
|
Hispanic |
284 |
84.4 (78.1--90.7) |
46.6 (38.6--54.6) |
23.4 (16.8--30.0) |
|
White, non-Hispanic |
1,191 |
78.0 (74.4--81.6) |
46.8 (42.8--50.8) |
23.7 (20.4--27.0) |
|
Black, non-Hispanic |
876 |
63.6 (58.4--68.8)¶ |
35.1 (30.2--40.0)¶ |
18.6 (14.6--22.6) |
|
Massachusetts |
||||
|
Hispanic |
246 |
77.2 (69.5--84.9) |
30.8 (22.7--38.9)¶ |
12.4 (7.5--17.3)¶ |
|
White, non-Hispanic |
1,077 |
76.7 (73.2--80.2) |
45.3 (41.5--49.1) |
22.5 (19.4--25.6) |
|
Black, non-Hispanic |
149 |
65.9 (52.9--78.9) |
52.6 (39.3--65.9) |
26.1 (14.1--38.1) |
|
Michigan |
||||
|
Hispanic |
220 |
67.0 (58.2--75.8) |
30.2 (22.1--38.3) |
18.8 (11.9--25.7) |
|
White, non-Hispanic |
1,147 |
68.5 (64.9--72.1) |
35.9 (32.6--39.2) |
17.2 (14.8--19.6) |
|
Black, non-Hispanic |
612 |
50.9 (43.1--58.7)¶ |
22.7 (16.1--29.3)¶ |
10.4 (5.4--15.4)¶ |
|
Minnesota |
||||
|
Hispanic |
132 |
84.3 (77.2--91.4) |
49.3 (39.4--59.2) |
30.0 (21.1--38.9) |
|
White, non-Hispanic |
1,080 |
80.2 (77.0--83.4) |
47.7 (44.1--51.3) |
23.6 (20.7--26.5) |
|
Black, non-Hispanic |
55 |
90.6 (83.7--97.5)¶ |
62.5 (48.8--76.2)¶ |
33.5 (19.3--47.7) |
|
Mississippi |
||||
|
Hispanic |
63 |
65.4 (47.0--83.8) |
31.8 (16.4--47.2) |
15.6 (3.0--28.2) |
|
White, non-Hispanic |
939 |
58.4 (54.4--62.4) |
24.7 (21.4--28.0) |
10.4 (8.2--12.6) |
|
Black, non-Hispanic |
540 |
35.4 (30.6--40.2)¶ |
15.3 (11.6--19.0)¶ |
5.7 (3.4--8.0)¶ |
|
Missouri |
||||
|
Hispanic |
135 |
72.6 (62.6--82.6) |
37.3 (27.4--47.2) |
13.9 (7.5--20.3) |
|
White, non-Hispanic |
1,325 |
67.7 (64.3--71.1) |
34.2 (31.1--37.3) |
16.0 (13.6--18.4) |
|
Black, non-Hispanic |
196 |
56.9 (48.2--65.6)¶ |
27.1 (19.0--35.2) |
12.4 (6.5--18.3) |
|
Montana |
||||
|
Hispanic |
88 |
75.5 (65.1--85.9)¶ |
53.1 (41.1--65.1) |
28.3 (16.9--39.7) |
|
White, non-Hispanic |
1,043 |
87.0 (84.4--89.6) |
56.7 (53.2--60.2) |
31.2 (28.0--34.4) |
|
Black, non-Hispanic |
--- |
--- |
--- |
--- |
|
Nebraska |
||||
|
Hispanic |
185 |
82.5 (76.3--88.7) |
51.5 (43.4--59.6) |
27.5 (19.7--35.3) |
|
White, non-Hispanic |
974 |
76.6 (73.3--79.9) |
45.8 (42.2--49.4) |
22.3 (19.5--25.1) |
|
Black, non-Hispanic |
--- |
--- |
--- |
--- |
|
Nevada |
||||
|
Hispanic |
576 |
80.8 (77.2--84.4) |
43.8 (39.2--48.4) |
21.2 (17.4--25.0) |
|
White, non-Hispanic |
707 |
77.4 (73.5--81.3) |
45.7 (41.3--50.1) |
22.8 (19.2--26.4) |
|
Black, non-Hispanic |
63 |
56.2 (42.7--69.7)¶ |
22.4 (11.4--33.4)¶ |
9.0 (1.3--16.7)¶ |
|
New Hampshire |
||||
|
Hispanic |
73 |
73.5 (59.6--87.4) |
41.7 (28.8--54.6) |
24.4 (13.7--35.1) |
|
White, non-Hispanic |
1,048 |
77.8 (74.7--80.9) |
50.2 (46.8--53.6) |
26.6 (23.7--29.5) |
|
Black, non-Hispanic |
--- |
--- |
--- |
--- |
|
New Jersey |
||||
|
Hispanic |
760 |
81.0 (76.2--85.8)¶ |
45.4 (39.1--51.7) |
22.4 (17.2--27.6) |
|
White, non-Hispanic |
921 |
70.7 (66.9--74.5) |
43.8 (39.8--47.8) |
19.9 (16.6--23.2) |
|
Black, non-Hispanic |
422 |
67.5 (59.5--75.5) |
40.0 (31.2--48.8) |
15.1 (8.2--22.0) |
|
New Mexico |
||||
|
Hispanic |
843 |
75.5 (71.6--79.4)¶ |
39.5 (35.4--43.6)¶ |
22.5 (19.0--26.0)¶ |
|
White, non-Hispanic |
583 |
87.2 (83.2--91.2) |
57.7 (52.4--63.0) |
32.5 (27.9--37.1) |
|
Black, non-Hispanic |
--- |
--- |
--- |
--- |
|
See footnotes at end of table. |
||||
|
TABLE 2. (Continued) Prevalence of breastfeeding initiation and duration to 6 months and 12 months,* by state and race/ethnicity --- National Immunization Survey, United States, 2004--2008† |
||||
|---|---|---|---|---|
|
Breastfeeding |
||||
|
No. of respondents |
Initiation |
6 months |
12 months |
|
|
State, Race/Ethnicity |
% (95% CI§) |
% (95% CI) |
% (95% CI) |
|
|
New York |
||||
|
Hispanic |
701 |
80.3 (77.0--83.6)¶ |
47.4 (43.1--51.7) |
27.4 (23.6--31.2) |
|
White, non-Hispanic |
1,551 |
73.1 (70.5--75.7) |
47.5 (44.7--50.3) |
26.4 (24.0--28.8) |
|
Black, non-Hispanic |
394 |
67.8 (61.6--74.0) |
35.6 (30.1--41.1)¶ |
18.8 (14.3--23.3)¶ |
|
North Carolina |
||||
|
Hispanic |
197 |
84.6 (78.8--90.4)¶ |
48.1 (40.3--55.9)¶ |
23.3 (16.8--29.8) |
|
White, non-Hispanic |
862 |
72.4 (68.3--76.5) |
39.5 (35.6--43.4) |
20.1 (17.1--23.1) |
|
Black, non-Hispanic |
186 |
49.8 (41.4--58.2)¶ |
19.5 (13.3--25.7)¶ |
11.3 (6.3--16.3)¶ |
|
North Dakota |
||||
|
Hispanic |
60 |
71.3 (58.4--84.2) |
40.9 (27.2--54.6) |
17.2 (7.2--27.2) |
|
White, non-Hispanic |
1,159 |
72.8 (69.8--75.8) |
40.9 (37.8--44.0) |
19.2 (16.8--21.6) |
|
Black, non-Hispanic |
--- |
--- |
--- |
--- |
|
Ohio |
||||
|
Hispanic |
179 |
61.3 (51.0--71.6) |
34.2 (24.4--44.0) |
15.3 (7.9--22.7) |
|
White, non-Hispanic |
1,758 |
64.7 (61.5--67.9) |
33.4 (30.5--36.3) |
14.7 (12.7--16.7) |
|
Black, non-Hispanic |
343 |
54.1 (46.3--61.9)¶ |
23.4 (16.9--29.9)¶ |
9.5 (5.5--13.5)¶ |
|
Oklahoma |
||||
|
Hispanic |
242 |
66.6 (58.7--74.5)¶ |
31.4 (24.8--38.0) |
15.9 (11.2--20.6) |
|
White, non-Hispanic |
778 |
73.1 (69.1--77.1) |
35.8 (31.9--39.7) |
15.1 (12.4--17.8) |
|
Black, non-Hispanic |
100 |
52.4 (40.8--64.0)¶ |
21.2 (12.5--29.9)¶ |
13.7 (6.2--21.2) |
|
Oregon |
||||
|
Hispanic |
234 |
87.3 (82.7--91.9) |
64.2 (57.6--70.8) |
41.9 (35.3--48.5) |
|
White, non-Hispanic |
701 |
90.5 (87.6--93.4) |
61.7 (57.2--66.6) |
35.8 (31.7--39.9) |
|
Black, non-Hispanic |
--- |
--- |
--- |
--- |
|
Pennsylvania |
||||
|
Hispanic |
416 |
73.1 (67.3--78.9) |
33.4 (26.9--39.9) |
14.6 (9.9--19.3)¶ |
|
White, non-Hispanic |
1,929 |
68.7 (65.8--71.6) |
40.1 (37.2--43.0) |
20.2 (17.8--22.6) |
|
Black, non-Hispanic |
690 |
54.3 (48.1--60.5)¶ |
23.9 (18.9--28.9)¶ |
10.8 (7.2--14.4)¶ |
|
Rhode Island |
||||
|
Hispanic |
250 |
75.5 (69.3--81.7)¶ |
32.3 (25.1--39.5)¶ |
17.5 (11.7--23.3) |
|
White, non-Hispanic |
905 |
68.4 (64.7--72.1) |
40.6 (36.9--44.3) |
18.8 (16.0--21.6) |
|
Black, non-Hispanic |
68 |
71.8 (58.9--84.7) |
38.6 (24.8--52.4) |
17.2 (6.7--27.7) |
|
South Carolina |
||||
|
Hispanic |
187 |
76.7 (69.6--83.8) |
46.4 (37.8--55.0)¶ |
21.8 (14.1--29.5) |
|
White, non-Hispanic |
1,105 |
71.0 (67.7--74.3) |
36.3 (33.0--39.6) |
15.8 (13.4--18.2) |
|
Black, non-Hispanic |
325 |
43.3 (37.2--49.4)¶ |
15.9 (11.7--20.1)¶ |
4.6 (2.1--7.1)¶ |
|
South Dakota |
||||
|
Hispanic |
75 |
78.3 (67.8--88.8) |
45.4 (32.1--58.7) |
23.9 (11.8--36.0) |
|
White, non-Hispanic |
1,193 |
76.4 (73.3--79.5) |
44.6 (41.2--48.0) |
20.7 (18.0--23.4) |
|
Black, non-Hispanic |
--- |
--- |
--- |
--- |
|
Tennessee |
||||
|
Hispanic |
241 |
68.6 (58.5--78.7) |
38.8 (29.0--48.6) |
20.1 (12.3--27.9) |
|
White, non-Hispanic |
1,617 |
66.2 (62.5--69.9) |
33.5 (30.3--36.7) |
15.2 (13.0--17.4) |
|
Black, non-Hispanic |
467 |
45.4 (38.4--52.4)¶ |
21.1 (15.4--26.8)¶ |
8.1 (3.9--12.3)¶ |
|
Texas |
||||
|
Hispanic |
4,225 |
79.1 (76.9--81.3) |
42.6 (39.8--45.4) |
22.3 (19.9--24.7) |
|
White, non-Hispanic |
1,995 |
76.5 (73.1--79.9) |
43.1 (39.5--46.7) |
19.8 (17.1--22.5) |
|
Black, non-Hispanic |
715 |
54.7 (48.3--61.1)¶ |
24.6 (19.3--29.9)¶ |
7.9 (5.4--10.4)¶ |
|
Utah |
||||
|
Hispanic |
150 |
88.9 (83.3--94.5) |
49.7 (40.6--58.8)¶ |
30.5 (22.1--38.9) |
|
White, non-Hispanic |
970 |
89.4 (86.8--92.0) |
63.7 (60.0--67.4) |
28.3 (25.0--31.6) |
|
Black, non-Hispanic |
--- |
--- |
--- |
--- |
|
Vermont |
||||
|
Hispanic |
--- |
--- |
--- |
--- |
|
White, non-Hispanic |
959 |
83.0 (80.0--86.0) |
56.6 (52.8--60.4) |
34.6 (31.2--38.0) |
|
Black, non-Hispanic |
--- |
--- |
--- |
--- |
|
Virginia |
||||
|
Hispanic |
194 |
80.9 (74.2--87.6) |
50.3 (42.0--58.6) |
26.1 (19.2--33.0) |
|
White, non-Hispanic |
994 |
78.3 (74.6--82.0) |
47.5 (43.5--51.5) |
22.7 (19.7--25.7) |
|
Black, non-Hispanic |
190 |
60.6 (52.5--68.7)¶ |
33.7 (26.0--41.4)¶ |
13.1 (7.7--18.5)¶ |
|
Washington |
||||
|
Hispanic |
510 |
88.5 (84.9--92.1) |
57.0 (51.4--62.6) |
31.5 (26.1--36.9) |
|
White, non-Hispanic |
1,597 |
91.0 (89.0--93.0) |
59.0 (55.6--62.4) |
34.2 (31.1--37.3) |
|
Black, non-Hispanic |
54 |
73.5 (59.5--87.5)¶ |
49.9 (33.9--65.9) |
26.8 (12.9--40.7) |
|
See footnotes at end of table. |
||||
|
TABLE 2. (Continued) Prevalence of breastfeeding initiation and duration to 6 months and 12 months,* by state and race/ethnicity --- National Immunization Survey, United States, 2004--2008† |
||||
|---|---|---|---|---|
|
Breastfeeding |
||||
|
No. of respondents |
Initiation |
6 months |
12 months |
|
|
State, Race/Ethnicity |
% (95% CI§) |
% (95% CI) |
% (95% CI) |
|
|
West Virginia |
||||
|
Hispanic |
52 |
67.8 (53.1--82.5) |
34.1 (19.1--49.1) |
7.4 (1.0--13.8)¶ |
|
White, non-Hispanic |
1,251 |
56.8 (53.4--60.2) |
26.4 (23.7--29.1) |
12.9 (10.9--14.9) |
|
Black, non-Hispanic |
--- |
--- |
--- |
--- |
|
Wisconsin |
||||
|
Hispanic |
244 |
70.0 (61.3--78.7) |
40.6 (31.7--49.5) |
21.6 (14.3--28.9) |
|
White, non-Hispanic |
1,265 |
76.6 (73.5--79.7) |
44.5 (41.0--48.0) |
20.8 (17.9--23.7) |
|
Black, non-Hispanic |
171 |
46.6 (36.8--56.4)¶ |
19.5 (12.4--26.6)¶ |
7.8 (2.8--12.8)¶ |
|
Wyoming |
||||
|
Hispanic |
154 |
81.4 (74.3--88.5) |
43.3 (34.9--51.7) |
21.6 (14.9--28.3) |
|
White, non-Hispanic |
1,007 |
84.1 (81.4--86.8) |
46.4 (42.9--49.9) |
21.4 (18.7--24.1) |
|
Black, non-Hispanic |
--- |
--- |
--- |
--- |
|
* Breastfeeding initiation was determined based on response to the question, "Was [child] ever breastfed or fed breast milk?" Breastfeeding duration was determined based on response to the question, "How long was [child] breastfed or fed breast milk?" (NIS 2004--2005) or "How old was [child's name] when [child's name] completely stopped breastfeeding or being fed breast milk?" (NIS 2006--2008). † Among children born during 2003--2006. § Confidence interval. ¶ Referent group is non-Hispanic whites. Estimate is statistically significant (p<0.05). § Not available. Data were suppressed when sample size was <50. |
||||
FIGURE. Prevalence of initiating breastfeeding* among Hispanics, non-Hispanic whites, and non-Hispanic blacks --- National Immunization Survey, United States, 2004--2008†
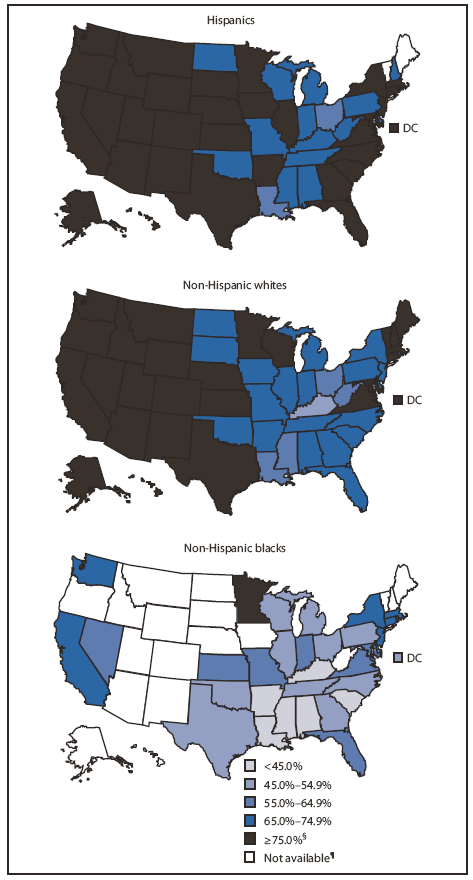
* Breastfeeding initiation was determined based on response to the question, "Was [child] ever breastfed or fed breast milk?"
† Among children born during 2003--2006.
§ Healthy People 2010 target for initiating breastfeeding.
¶ Data were suppressed when sample size was <50.
Alternate Text: The figure above shows state-specific prevalence of breastfeeding initiation among Hispanics, non-Hispanic whites, and non-Hispanic blacks, based on date from the National Immunization Survey for the period 2004-2008. Among states with samples sizes sufficient for analysis (>50 respondents per group), Hispanics, non-Hispanic whites, and non-Hispanic blacks met the Healthy People 2010 goal for breastfeeding initiation (75%) in 33 of 49, 27 of 51, and one of 33 states, respectively.
Use of trade names and commercial sources is for identification only and does not imply endorsement by the U.S. Department of
Health and Human Services.
References to non-CDC sites on the Internet are
provided as a service to MMWR readers and do not constitute or imply
endorsement of these organizations or their programs by CDC or the U.S.
Department of Health and Human Services. CDC is not responsible for the content
of pages found at these sites. URL addresses listed in MMWR were current as of
the date of publication.
All MMWR HTML versions of articles are electronic conversions from typeset documents.
This conversion might result in character translation or format errors in the HTML version.
Users are referred to the electronic PDF version (http://www.cdc.gov/mmwr)
and/or the original MMWR paper copy for printable versions of official text, figures, and tables.
An original paper copy of this issue can be obtained from the Superintendent of Documents, U.S.
Government Printing Office (GPO), Washington, DC 20402-9371;
telephone: (202) 512-1800. Contact GPO for current prices.
**Questions or messages regarding errors in formatting should be addressed to
mmwrq@cdc.gov.
