 |
|
|
|
|
|
|
| ||||||||||
|
|
|
|
|
|
|
||||
| ||||||||||
|
|
|
|
|
Persons using assistive technology might not be able to fully access information in this file. For assistance, please send e-mail to: mmwrq@cdc.gov. Type 508 Accommodation and the title of the report in the subject line of e-mail. HIV Testing --- United States, 2001As of December 2001, a cumulative total of 816,149 cases of acquired immunodeficiency syndrome (AIDS) had been reported to CDC (1). One of CDC's national human immunodeficiency virus (HIV)--prevention goals for 2005 (Goal 2) is to increase the proportion of HIV-infected persons in the United States who know they are infected from an estimated 70% to 95% (2). A goal of the new CDC initiative, Advancing HIV Prevention: New Strategies for a Changing Epidemic, is to ensure that every HIV-infected person has the opportunity to be tested and has access to state-of-the-art medical care and prevention services needed to prevent HIV transmission (3). To characterize the prevalence of HIV-antibody testing among U.S. adults, CDC analyzed data from the 2001 Behavioral Risk Factor Surveillance System (BRFSS). The findings document variability in HIV testing prevalence by area and by sex within areas, underscoring the ongoing need to promote voluntary HIV counseling and testing that will provide persons with early knowledge of their HIV status and offer them access to appropriate counseling and treatment. BRFSS is a state-based, random-digit--dialed telephone survey of the civilian, noninstitutionalized population aged >18 years in the 50 states, the District of Columbia (DC), Guam, Puerto Rico, and the U.S. Virgin Islands. In 2001, a total of 170,412 persons aged 18--64 years responded to questions about HIV- and AIDS-related knowledge, attitudes, and HIV-antibody testing history. Sample sizes ranged from 802 in Guam to 7,019 in Massachusetts. All estimates were weighted by demographic characteristics and selection probabilities; confidence intervals were calculated by using SUDAAN to account for the complex survey design. Survey participants were asked, "As far as you know, have you ever had your blood tested for HIV?" Participants were directed not to count tests they might have had as part of a blood donation (4). The percentage of respondents who reported being tested ranged from 31.5% (South Dakota) to 65.3% (DC) (median: 45.6%) (Table 1). The month and year of the most recent test were used to identify persons whose most recent test was during the 12 months preceding the interview. Respondents who reported being tested in 2001 but who did not report the month were included in the group tested recently. Approximately 2% of respondents reported being tested in 2000 but could not remember the month in which they were tested and were coded as not having been tested recently. Of those ever tested, a median of 27.7% (range: 18.5% [Maine]--39.6% [Virgin Islands]) were tested during the 12 months preceding the interview (Table 1). The median age of persons who reported ever having been tested for HIV was 35.1 years (range: 32.2 [North Dakota]--37.2 [DC] years). Approximately 59.6% of respondents aged 20--39 years had ever been tested (range: 42.7% [South Dakota]--72.0% [Alaska]). Testing rates declined after age 40 years to 22.1% of respondents aged 60--64 years (range: 8.6% [Kansas]--39.6% [Nevada]). Respondents who reported ever having been tested were asked, "What was the main reason you had your test for HIV?" Participants who reported that they were tested primarily to learn their infection status (i.e., those whose responses included "just to find out if infected," "routine check-up," "doctor referral," "sex partner referral," "because of pregnancy," "because I am at risk," or "other") were coded as being tested voluntarily (5). Persons who reported that they were tested because of illness, hospitalization, surgical procedure, insurance, employment, marriage license, military service, immigration, or occupational exposure were coded as not being tested voluntarily. Among those ever tested, the percentage of persons who reported that their most recent HIV test was voluntary ranged from 53.0% (South Dakota) to 80.2% (DC) (median: 63.8%) (Table 2). Among those ever tested, few statistically significant differences between men and women were found except for the reason they were tested. Women were more likely than men ever to have been tested in nine states (California, Kentucky, Louisiana, Minnesota, Mississippi, Montana, Tennessee, Texas, and Washington) and in Puerto Rico. A median of 44.4% of men (range: 30.8% [South Dakota]--59.3% [Nevada]) and of 47.5% of women (range: 31.7% [North Dakota]--59.9% [Nevada]) reported ever having been tested for HIV. Among those persons ever tested, a median of 29.1% of men and 27.0% of women had their most recent test during the 12 months preceding the interview (range: 21.0% [Maine]--41.5% [Virgin Islands] for men; 16.3% [Maine]--38.1% [Virgin Islands] for women). Of those tested, the difference in recent HIV testing between men and women was statistically significant only in Hawaii (men, 36.1%; women, 21.5%). In 47 states, Guam, Puerto Rico, and the U.S. Virgin Islands, a significantly higher proportion of women than men reported being tested voluntarily (Table 2). Among those ever tested, a median of 72.2% of women reported that their most recent HIV test was voluntary (range: 61.4% [South Dakota]--81.9% [DC]), compared with a median of 54.8% of men (range: 42.4% [Delaware]--78.3% [DC]). HIV testing prevalence was >50% in eight states (Alaska, California, Florida, Georgia, Maryland, Nevada, South Carolina, and Virginia), DC, and the U.S. Virgin Islands and <40% in eight states (Iowa, Kentucky, Minnesota, Nebraska, North Dakota, South Dakota, Utah, and West Virginia) (Figure). In states where the AIDS rate* was high (1), HIV testing also tended to be high. For example, in 2001, Florida ranked third in both AIDS rate (31.3) (1) and testing (57.2%). However, in Alaska, where AIDS incidence was low (2.8), the prevalence estimate for testing was among the highest (56.9%). Reported by: KA Mack, PhD, Div of Adult and Community Health; A Lansky, PhD, Div of Reproductive Health, National Center for Chronic Disease Prevention and Health Promotion, CDC. Editorial Note:This report indicates that approximately half (median: 45.6%) of persons in the United States aged 18--64 years have been tested for HIV. This finding is consistent with previous BRFSS data indicating increased testing rates (6) and with other general population surveys (4). The proportion of persons tested for HIV varied by area and sex. The variability in HIV testing by area probably represents area-specific differences in the prevalence of HIV infection and AIDS and in the scope of HIV-prevention and -education programs. The variability in HIV testing by sex probably is attributable to pregnancy testing; 28.5% of women reported that the reason for their most recent test was pregnancy. Because an increasing proportion of persons with AIDS are women (7), variability in HIV testing by sex should be monitored. Differences between men and women in testing prevalence and reasons for being tested might have implications for developing HIV-prevention and -education programs. The findings in this report are subject to at least three limitations. First, BRFSS excludes persons without telephones and those who are institutionalized. Second, BRFSS data are self-reported and thus are subject to recall bias in testing reports. Finally, the median response rate was 51.1% (range: 33.3% [New Jersey]--81.5% [Puerto Rico]); however, BRFSS data have minimal bias (8). Although general population surveys such as BRFSS reach a population that is generally at low risk for HIV infection (9), such surveys provide useful data about the HIV-antibody testing behaviors of U.S. adults outside of public clinics. BRFSS data can be used to assess progress toward achieving the goals of CDC's HIV-prevention strategic plan (2). The findings indicate an ongoing need to promote voluntary HIV counseling and testing and underscore the importance of reducing barriers for early diagnosis of HIV infection and providing persons with knowledge of their HIV status and access to counseling and treatment to prevent further transmission (3). Acknowledgment This report is based on data provided by BRFSS coordinators. Div of Adult and Community Health, National Center for Chronic Disease Prevention and Health Promotion, CDC. References
* Per 100,000 population for July 2000--June 2001, reported through June 2001. Table 1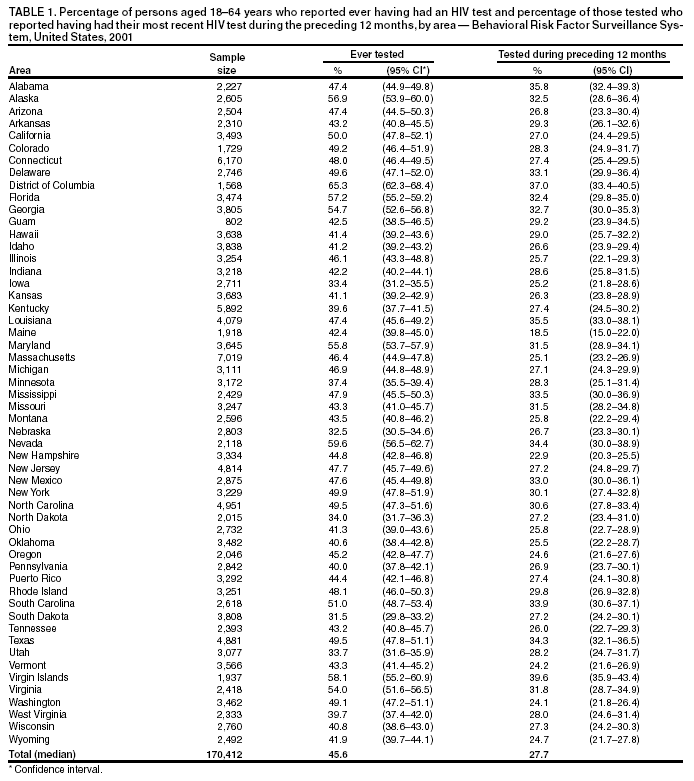 Return to top. Table 2 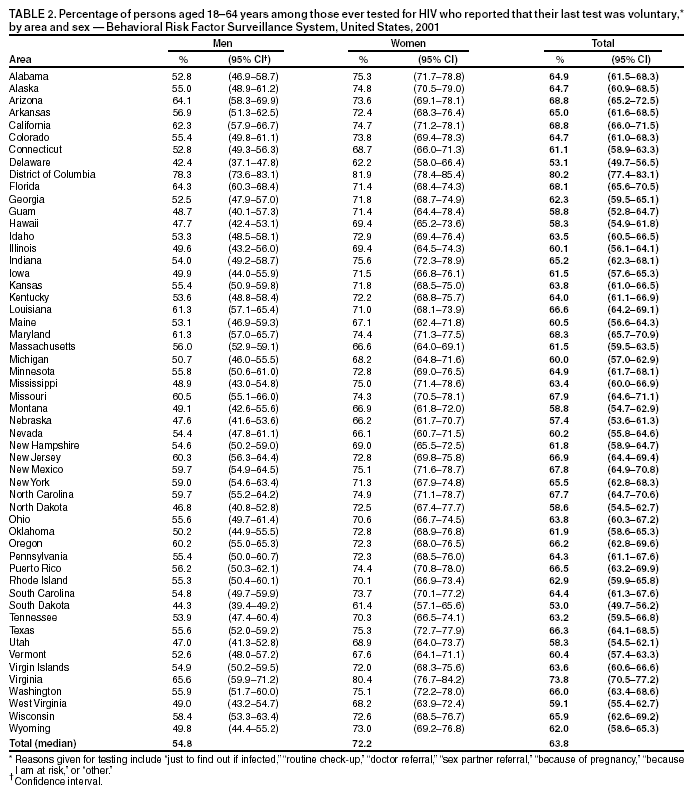 Return to top. Figure 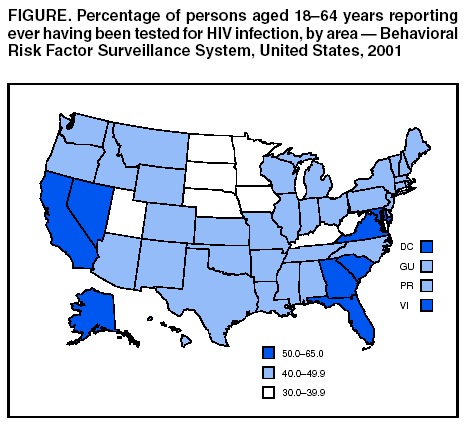 Return to top.
Disclaimer All MMWR HTML versions of articles are electronic conversions from ASCII text into HTML. This conversion may have resulted in character translation or format errors in the HTML version. Users should not rely on this HTML document, but are referred to the electronic PDF version and/or the original MMWR paper copy for the official text, figures, and tables. An original paper copy of this issue can be obtained from the Superintendent of Documents, U.S. Government Printing Office (GPO), Washington, DC 20402-9371; telephone: (202) 512-1800. Contact GPO for current prices. **Questions or messages regarding errors in formatting should be addressed to mmwrq@cdc.gov.Page converted: 6/12/2003 |
|||||||||
This page last reviewed 6/12/2003
|