WISQARS™ Tutorials: Fatal Injury Reports
WISQARS Tutorials
Fatal Injury Reports
Report Options
Advanced Options
Practice Questions
In the Fatal Injury Reports module, you will see four different options. For the purposes of this tutorial, we will choose Fatal Injury Reports 1999-2010, National, Regional, and States (RESTRICTED)
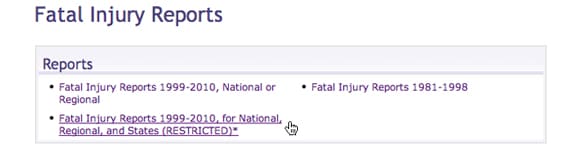
(Note: The coding of mortality data changed significantly in 1999, so you may not be able to compare number of deaths and death rates from 1998 and before with data from 1999 and after. Also, cause-of-injury groupings were updated in 2003, which may affect some WISQARS mortality reports.)
When selecting the Restricted option, you are taken to a page outlining the use restrictions of the data. Review and click “I Agree” to proceed.

Report Options
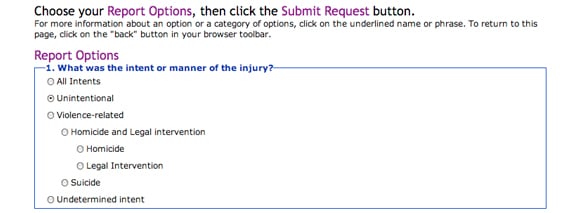
Once that selection is made, you will be brought to the Report Options page with three main categories of standard options and some advanced, optional choices. Our first option is to designate the intent or manner of the injury. We will select Unintentional.
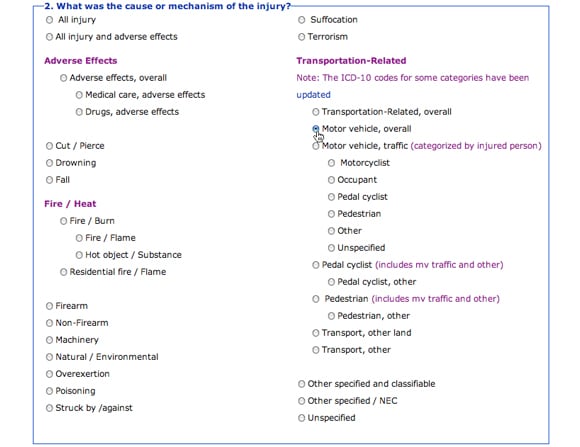
The second option is to select is the cause or mechanism of the injury. This is a detailed list with many options. We will select Motor vehicle, overall.
The third series of options concerns demographics. Among these we will first determine the Census Region applied to our query. We will choose West.

Under Race we will select American Indian/Alaska Native.

Under Sex we will select Males.

Year(s) or Report will be 2000 to 2010. The next two options we will leave at their default settings: Hispanic Origin will be All, and Output Options will be Standard Output.
Advanced Options
At this point we have the option to submit our request or to proceed to the Advanced Options, which are not required. Let’s take a closer look at these Advanced Options.
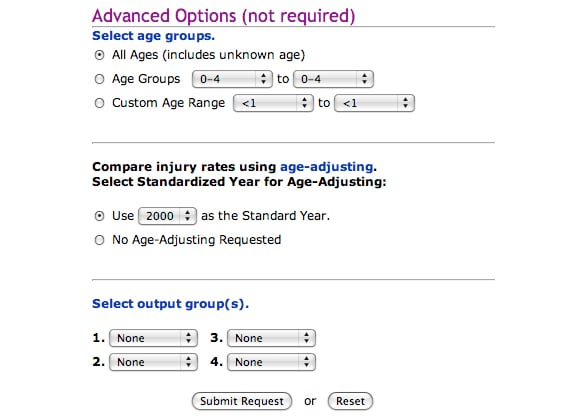
In Age Groups, we will limit our query to the custom age range of 16 to 25.

When using all ages or age groups, WISQARS allows you to compare injury rates using age-adjusting, and selecting a standardized year for age-adjusting. For our example we will not request age-adjusting because we are choosing a custom age range.

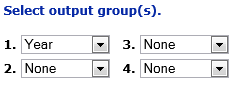
You have the option to view your results filtered through the output groups of age group, age, race, sex or year. But for our example we will leave all these at None.
Now we are ready to submit our request.

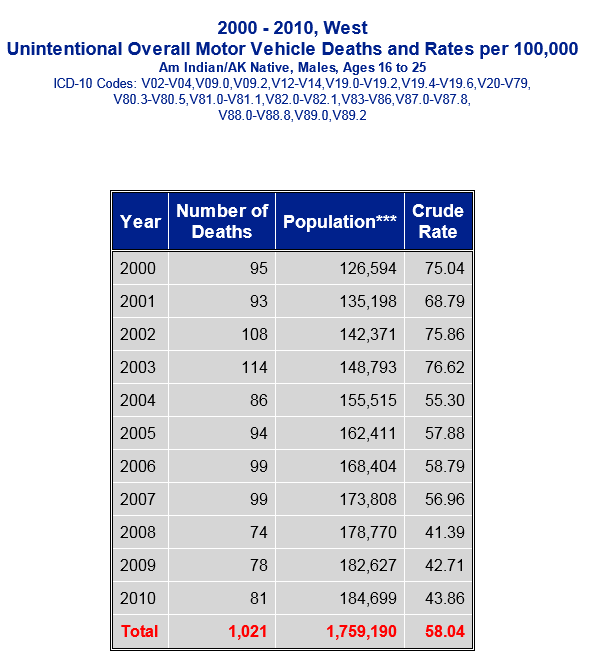
Our results based on the options we selected appear below. These results can be downloaded in a spreadsheet (CSV) file.
Practice Questions
Now that you have familiarized yourself with the Fatal Injury Report module of the WISQARS tutorial, put your knowledge to the test by generating a report with the following objective:
Which state had the highest number of American Indian/Alaska Native poisonings from 1999 to 2010?
Your results should show that Oklahoma has the highest number of poisoning deaths of all states.
Now try this follow-up question: Which state has the highest rate of AI/AN poisonings from 1999 to 2010?
Your results should show that Alaska has the highest rate of poisoning of all states.
HINT: Start by accepting the data restriction at this link: Fatal Injury Reports 1999-2010, for National, Regional, and States (RESTRICTED). Then find the option to output results by state under Advanced Options.