Viral Hepatitis Surveillance – United States, 2009
Commentary
The 2009 viral hepatitis surveillance report reflects a novel approach to providing public health partners with a more accurate, comprehensive look into viral hepatitis surveillance and the burden caused by these infections in the United States. A notable departure from past reports, the 2009 surveillance report is being published by the Division of Viral Hepatitis (DVH) rather than CDC’s Morbidity and Mortality Weekly Report (MMWR). Content changes have been made as well. For instance, some tables and figures from previous reports have been deleted or modified, whereas others have been added. In addition, the 2009 report includes information about investigations of specific cases and outbreaks of viral hepatitis identified by state and local reporting areas that involved CDC epidemiologic or laboratory assistance. Information about deaths attributed to viral hepatitis also is included for the first time. Perhaps the most significant addition to this report is the inclusion of case-report data for chronic hepatitis B and hepatitis C infections. The inclusion of these data represents an important first step towards national monitoring of the prevalence of viral hepatitis in the United States.
As part of CDC’s National Notifiable Disease Surveillance System (NNDSS), viral hepatitis case-reports are received electronically from state health departments via CDC’s National Electronic Telecommunications System for Surveillance (NETSS), a computerized public health surveillance system that provides CDC with data regarding cases of nationally notifiable diseases on a weekly basis. Although surveillance infrastructure is in place for reporting of acute infection, reports of chronic hepatitis B and C, which account for the greatest burden of disease, are not submitted by most states. As noted in a recent report from the Institute of Medicine (IOM) (1), surveillance capacity to monitor both acute and chronic viral hepatitis is limited at the state and local levels, resulting in incomplete and variable data.
Background
Viral hepatitis is caused by infection with any of at least five distinct viruses: hepatitis A virus (HAV), hepatitis B virus (HBV), hepatitis C virus (HCV), hepatitis D virus (HDV), and hepatitis E virus (HEV). Most viral hepatitis infections in the United States are attributable to HAV, HBV, and HCV. All three of these unrelated viruses can produce an acute illness characterized by nausea, malaise, abdominal pain, and jaundice, although many of these acute infections are asymptomatic or cause only mild disease. Many persons infected with HBV or HCV are unaware they are infected. Both viruses can produce chronic infections that often remain clinically silent for decades while increasing risk for liver disease and hepatocellular carcinoma.
Hepatitis A
Transmitted through the fecal-oral route, HAV is acquired primarily through close personal contact and foodborne outbreaks. Since 1995, effective vaccines to prevent hepatitis A virus infection have been available in the United States, increasing the feasibility of eliminating indigenous transmission. In 1996, CDC’s Advisory Committee on Immunization Practices (ACIP) recommended administration of hepatitis A vaccine to persons at increased risk for the disease, including international travelers, men who have sex with men (MSM), non-injection and injection-drug users (IDUs), and children living in communities with high rates of disease (2,3). In 1999, ACIP also recommended routine vaccination for children living in 11 states with average hepatitis A rates of >20 cases per 100,000 population and recommended that vaccination be considered for children in an additional six states with rates of 10–20 cases per 100,000 population (4). ACIP expanded these recommendations in 2006 to include routine vaccination of children in all 50 states (5).
Hepatitis B
HBV is transmitted by percutaneous or mucosal exposure to the blood or body fluids of an infected person, most often through injection-drug use, from sexual contact with an infected person, or from an infected mother to her newborn during childbirth. Transmission of HBV also can occur among persons who have prolonged but nonsexual interpersonal contact with someone who is HBV-infected (e.g., household contacts).
The risk for chronic HBV infection decreases with increasing age at infection. Of infants who acquire HBV infection from their mothers at birth, as many as 90% become chronically infected, whereas 30%–50% of children infected at age 1–5 years become chronically infected. This percentage is smaller among adults, in whom approximately 5% of all acute HBV infections progress to become chronic (6). Effective hepatitis B vaccines have been available in the United States since 1981. Ten years later, a comprehensive strategy was recommended for the elimination of HBV transmission in the United States (7, 8). This strategy encompassed the following four components:
- universal vaccination of infants beginning at birth;
- prevention of perinatal HBV infection through routine screening of all pregnant women for HBV infection and the provision of immunoprophylaxis to infants born either to infected women or to women of unknown infection status;
- routine vaccination of previously unvaccinated children and adolescents; and
- vaccination of adults at increased risk for infection (including health-care workers, dialysis patients, household contacts and sex partners of persons with chronic HBV infection, recipients of certain blood products, persons with a recent history of having multiple sex partners concurrently, those with a sexually transmitted disease, MSM, and IDUs).
In addition to hepatitis B vaccination, efforts have been made to improve care and treatment for persons who are living with hepatitis B. In the United States, 700,000–1.4 million persons are estimated to be infected with the virus (9,10), most of whom are unaware of their infection status. To improve health outcomes for these persons, in 2008, CDC issued recommendations to guide hepatitis B testing and public health management of persons with chronic hepatitis B infection (9). These guidelines stress the need for testing persons at high risk for infection, conducting contact management, educating patients, and administering FDA-approved therapies for treating hepatitis B. Since publication of the 2008 guidelines, treatment options for HBV infection have expanded. Several drugs are now administered orally (a major advancement in how treatments are administered for this infection), leading to viral suppression in 90% of patients taking one of these new oral medications.
Hepatitis C
HCV is transmitted primarily through percutaneous exposure, which can result from injection-drug use, needle-stick injuries, and inadequate infection control in health-care settings. Much less often, HCV transmission occurs among HIV-positive MSM as a result of sexual contact with an HIV-infected partner (11) and among infants born to HCV-infected mothers. With an estimated 3.2 million chronically infected persons nationwide, HCV infection is the most common blood-borne infection in the United States (12).
No laboratory distinction can be made between acute and chronic (past or present) HCV infection. Diagnosis of chronic infection is made on the basis of anti-HCV positive results upon repeat testing. Approximately 75%-85% of newly infected persons develop chronic infection (13).
Because of the high burden of chronic HCV infection in the United States and because no vaccine is available for preventing infection, national recommendations (14) emphasize other primary prevention activities, including screening and testing blood donors, inactivating HCV in plasma-derived products, testing persons at risk for HCV infection and providing them with risk-reduction counseling, and consistently implementing and practicing infection control in health-care settings. Since publication of these recommendations in 1998, progress has been made in HCV testing; FDA recently approved point-of-care tests for HCV infection, which can facilitate testing, notification of results and post-test counseling, and referral to care at the time of the testing visit (15).
Linkage to care and treatment is critical to improving health outcomes for persons found to be infected with HCV. Such linkage is particularly important in light of the major advancements that have been made in HCV treatments. For patients infected with HCV, treatment now consists of a long-acting interferon combined with oral doses of ribavirin, a regimen that has improved health outcomes for many infected persons. Approximately 40% of HCV-infected patients receiving this therapy clear their infection. New direct acting agents against HCV were recently licensed by the FDA. These agents, when given in combination with current therapy, can increase virologic cure rates while decreasing duration of therapy.
References
- Institute of Medicine (IOM). Hepatitis and Liver Cancer: a national strategy for prevention and control of hepatitis B and C. Washington, DC: The National Academies Press, 2010.
- CDC. Epidemiology and prevention of vaccine-preventable diseases. Atkinson W, Wolfe S, Hamborsky J, McIntyre L, eds. 11th ed. Washington DC: Public Health Foundation, 2009.
- CDC. Prevention of hepatitis A through active or passive immunization. MMWR 1996; 45(No. RR-15).
- CDC. Prevention of hepatitis A through active or passive immunization. MMWR 1999; 48(No. RR-12).
- CDC. Prevention of hepatitis A through active or passive immunization: recommendations of the Advisory Committee on Immunization Practices (ACIP). MMWR 2006;55(No. RR-7).
- CDC. Overview of Viral Hepatitis for Health Care Professionals.
- CDC. A comprehensive immunization strategy to eliminate transmission of hepatitis B virus infection in the United States. Part 1: immunization of infants, children, and adolescents. MMWR 2005; 54(No. RR–16).
- CDC. A comprehensive immunization strategy to eliminate transmission of hepatitis B virus infection in the United States—recommendations of the Advisory Committee on Immunization Practices (ACIP). Part 2: immunization of adults. MMWR 2006; 55(No. RR–16).
- CDC. Recommendations for identification and public health management of persons with chronic hepatitis B virus infection. MMWR 2008;57(No. RR-08).
- Ioannou G. Hepatitis B virus in the United States: infection, exposure, and immunity rates in a nationally representative survey. Ann Intern Med 2011:145:319-28.
- Tohme RA, Holmberg SD. Is sexual contact a major mode of hepatitis C transmission? Hepatol 2010; 52:1497–1505
- Armstrong GL, Wasley AM, Simard EP, et al. The prevalence of hepatitis C virus infection in the United States, 1999 through 2002. Ann Intern Med 2006;144:705–14.
- CDC. National hepatitis C prevention strategy: a comprehensive strategy for the prevention and control of hepatitis C virus infection and its consequences. 2001.
- CDC. Recommendations for prevention and control of hepatitis C virus (HCV) infection and HCV-related chronic disease. MMWR 1998;47(No. RR–19).
- Lee SR, Yearwood GD, Guillon GB, et al. Evaluation of a rapid, point-of-care test device for the diagnosis of hepatitis C infection. J Clin Virol 2010;48(1):15-7.
Technical Notes
Investigations
Recent investigations of viral hepatitis outbreaks in the United States demonstrate the continued risk posed by lapses in infection-control practices, particularly in health-care settings (1–10). Distinguishing cases of health-care-acquired viral hepatitis from those transmitted outside the health-care setting often depends on the quality of case reporting and therefore varies by state and locality. Investigation of suspected cases of health-care-associated viral hepatitis is multi-faceted, involving surveillance, epidemiologic, clinical, and laboratory components. State and local health departments generally consult CDC’s DVH and the Division of Health care Quality Promotion (DHQP) for technical assistance and support regarding the proper approach to investigating a possible health care-associated transmission event.
Data regarding viral hepatitis outbreaks obtained through current surveillance mechanisms are subject to limitations. Because not all outbreaks are identified or investigated at the state and local level or reported to CDC, the number of reported outbreaks for 2009 likely is an underestimate of the actual number of viral hepatitis outbreaks that occurred in health-care or other congregant living facilities.
References
- Forero S, Alvarez J, Doyle T. Hepatitis B outbreak associated with home health care in South Florida. October 2010 Epi Update.
- Cook County Department of Health, unpublished data, 2009.
- Greeley RD, Semple S, Thompson ND, et al. Hepatitis B outbreak associated with a hematology-oncology office practice in New Jersey, 2009. Am J Infect Contr 2011 (in press).
- Enfield KB, Sharapov U, Hall K, et al. Transmission of hepatitis B virus to patients from an orthopedic surgeon. Presented at: 20th Annual Scientific Meeting of the Society for Health care Epidemiology of America (SHEA), Atlanta, Georgia, March 20, 2010. http://shea.confex.com/shea/2010/webprogram/Paper2428.html
- Utah O, Stern DR, Powell TA, et al. A hepatitis B virus infection outbreak among residents and staff of an assisted living facility – Virginia, 2009. Presented at: 20th Annual Scientific Meeting of the Society for Health care Epidemiology of America (SHEA), Atlanta, Georgia, March 20, 2010. http://shea.confex.com/shea/2010/webprogram/Paper2275.html
- West Virginia Department of Health, unpublished data, 2009.
- manuscript in development, Colorado Department of Public Health and Environment
- Sanderson R, Atrubin D, Santiago A, et al. 2010. Hepatitis C outbreak at an outpatient infusion clinic — Hillsborough County, Florida 2009.
- Rao AK, Luckman E, Wise M. Outbreak of hepatitis C virus infections at an outpatient hemodialysis facility — Maryland, 2009. Presented at: the 59th Annual EIS Conference, Atlanta, April 19–23, 2010.
- New Jersey Department of Health and Senior Services, unpublished data, 2009.
National Notifiable Disease Surveillance System
Background
Each week, state and territorial health departments report cases of acute, symptomatic viral hepatitis to CDC’s NNDSS. Since 1990, states have been electronically submitting individual case reports (absent of personal identifiers) to CDC via NETSS, a computerized public health surveillance information system. States’ participation in reporting nationally notifiable diseases, including viral hepatitis, is voluntary.
National surveillance for viral hepatitis (including acute hepatitis A, hepatitis B, and hepatitis C; chronic hepatitis B; and chronic [past or present] hepatitis C) is based on case definitions developed and approved by the Council of State and Territorial Epidemiologists (CSTE) and CDC. In 2009, reported cases of acute and chronic viral hepatitis were required to meet CSTE-defined clinical and laboratory criteria (available at: https://wwwn.cdc.gov/nndss/conditions/#h).
Case Definitions
Acute Viral Hepatitis
Clinical Criteria
Acute hepatitis is defined as acute illness with 1) discrete onset of symptoms (e.g., nausea, anorexia, fever, malaise, and abdominal pain) and 2) jaundice or elevated serum alanine aminotransferase (ALT) levels. For acute hepatitis C, elevated ALT levels are defined as >400 IU/L.
Laboratory Criteria
Because all types of acute viral hepatitis have the same clinical characteristics, identifying the specific viral cause of illness requires laboratory testing. The following laboratory criteria are used to determine the cause of each suspected case of acute viral hepatitis:
Acute hepatitis A
- Immunoglobulin M (IgM) antibody to hepatitis A virus (anti-HAV) positive.
Acute hepatitis B
- IgM antibody to hepatitis B core antigen (anti-HBc) positive or hepatitis B surface antigen (HBsAg) positive
AND
- IgM anti-HAV negative (if performed).
Acute hepatitis C
- IgM anti-HAV negative and IgM anti-HBc negative
AND
- One of the following:
- Antibody to hepatitis C virus (anti-HCV) positive, with a signal-to-cut-off ratio predictive of a true positive for the particular assay as defined by CDC (signal to cut-off ratios available at https://www.cdc.gov/hepatitis/HCV/LabTesting.htm#section1)
OR
- Hepatitis C virus recombinant immunoblot assay (HCV RIBA) positive
OR
- Nucleic acid test (NAT) for HCV RNA positive.
Chronic Hepatitis B
Clinical Criteria
No symptoms are required. Persons with chronic HBV infection may have no evidence of liver disease or may have a spectrum of disease ranging from chronic hepatitis to cirrhosis or liver cancer.
Laboratory criteria for diagnosis
- IgM anti-HBc negative
AND
- a positive result on one of the following tests: HBsAg, hepatitis B e antigen (HBeAg) or HBV DNA
OR
- Two positive tests for HBsAg, HBV DNA, or HBeAg when tests are performed at least 6 months apart (any combination of these tests performed 6 months apart is acceptable).
Chronic Hepatitis C, past or present
Because current laboratory diagnostic tests do not distinguish current active infections (present) from resolved infections (past), the term “past or present” is used to describe HCV positive results after repeat testing.
Clinical description
No symptoms are required. Most HCV-infected persons are asymptomatic. However, many have mild-to-severe chronic liver disease, which can lead to cirrhosis and liver cancer.
Laboratory Criteria
- Anti-HCV positive (repeat reactive) by EIA, verified by an additional, more specific assay (e.g., RIBA for anti-HCV or nucleic acid testing for HCV RNA)
OR
- HCV RIBA positive
OR
- Nucleic acid test for HCV RNA positive
OR
- Report of HCV genotype
OR
- Antibody to hepatitis C virus (anti-HCV) positive, with a signal-to-cut-off ratio predictive of a true positive for the particular assay as defined by CDC (signal to cut-off ratios available at https://www.cdc.gov/hepatitis/HCV/LabTesting.htm#section1)
Case Classification
For analysis at the national level, cases of viral hepatitis are considered “confirmed” if they meet both the clinical case definition and laboratory criteria for diagnosis; however, these criteria are determined at the state or local level and are not validated by CDC. For hepatitis A, cases also are considered confirmed if they meet the clinical case definition and involve a person who is epidemiologically linked to someone with laboratory-confirmed hepatitis A (e.g., through household or sexual contact with an infected person during the 15–50 days before symptom onset).
Incidence Calculations
For this report, crude national rates per 100,000 population were calculated using 2009 Census estimates of the U.S. resident population. State-specific rates were calculated using 2009 Census population estimates for each state.
Limitations
NNDSS is a passive surveillance system and is subject to several limitations regarding acute and chronic viral hepatitis reporting. First, NNDSS was designed for acute infectious diseases for which a single laboratory test (e.g., culture positivity) can confirm a diagnosis. This limitation is especially problematic for HBV and HCV; an average of four documents or reports must be reviewed to confirm each case of acute hepatitis C virus infection (1). Further, follow-up of patients is difficult. With the exception of selected, specially funded sites, states and localities do not receive federal funding to support viral hepatitis surveillance.
Although rate calculations using NNDSS data substantially underestimate the incidence of acute viral hepatitis in the United States(2-4), methods used to determine incidence rates have remained consistent since 1990 (CDC, unpublished data, 2007). Therefore, data from NNDSS are useful to assess trends in viral hepatitis over time. National trends in acute disease published in this report are consistent with those demonstrated in CDC’s Sentinel Counties Study of Acute Viral Hepatitis, in which the accuracy and completeness of report¬ing were assessed and known to be high (4). As noted, accuracy is less certain for chronic hepatitis B and past or present hepatitis C cases, as many states lack resources to conduct surveillance for chronic viral hepatitis, follow-up potential cases, and evaluate the data.
References
- Klevens RM, Miller J, Vonderwahl C, et al. Population-based surveillance for hepatitis C virus, United States, 2006–2007. Emerg Infect Dis 2009;15:1499–1502.
- Doyle TJ, Glynn MK, Groseclose SL. Completeness of notifiable infectious disease reporting in the United States: an analytical literature review. Am J Epidemiol 2002;155:866–74.
- Armstrong GL, Bell BP. Hepatitis A virus infections in the United States: model-based estimates and implications for childhood immunization. Pediatrics 2002;109:839–45.
- Alter MJ, Mares A, Hadler SC, Maynard JE. The effect of underreporting on the apparent incidence and epidemiology of acute viral hepatitis. Am J Epidemiol 1987;125:133–9.
Estimation Procedures
CDC’s DVH employs catalytic and general linear models to estimate acute viral hepatitis infection rates (1). The accuracy of these estimates is contingent on the quality of the data and the primary assumption that hepatitis prevalence can be modeled as a function of hepatitis incidence. The general catalytic model is expressed as:
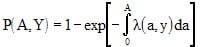
where P(A,Y) denotes disease prevalence for a specific age (A), and survey year (Y); λ(a,y) denotes age-specific disease incidence in a susceptible population (2).
Estimates of acute hepatitis infection rates are adjusted for the possible effects of underreporting and the exclusion of asymptomatic infections from the number of reported acute, symptomatic infections. For at least the past 5 years, adjustment multipliers have remained unchanged, although DVH is currently collaborating with state viral hepatitis programs to collect the necessary data required to update both adjustment multipliers.
Consistent with past surveillance reports, the following adjustments were applied to the 2009 data:
- for each newly reported HAV symptomatic infection, approximately 10.4 new HAV infections (of which 4.3 and 6.1 cases were symptomatic and asymptomatic, respectively) are estimated to occur in the general population;
- for each newly reported HBV symptomatic infection, approximately 10.5 new HBV infections (of which 2.8 and 7.7 cases were symptomatic and asymptomatic, respectively) are estimated to occur in the general population; and
- for each new reported HCV symptomatic infection, approximately 20.0 new HCV infections (of which 3.3 and 16.7 cases were symptomatic and asymptomatic, respectively) are estimated to occur in the general population.
References
- Armstrong GL, Bell BP. Hepatitis A virus infections in the United States: model-based estimates and implications for childhood immunization. Pediatrics 2002;109:839–45.
- Muench H. Catalytic models in epidemiology. Cambridge, Massachusetts: Harvard University Press; 1959.
Enhanced Viral Hepatitis Surveillance Sites
Background
CDC funds select sites for viral hepatitis surveillance through the Emerging Infections Program (EIP), a network involving CDC, state health departments, academic institutions, and local health departments. Since 2004, participating EIP sites have conducted routine surveillance for chronic HBV and chronic (past or present) HCV infections. All chronic cases of viral hepatitis obtained through these sites are de-duplicated; additionally, for a percentage of cases, follow-up is conducted to obtain clinical and laboratory data and information regarding risk behaviors/exposures. Each month, a dataset of cumulative cases from each site is sent to CDC’s DVH via a secure electronic file transfer protocol (FTP).
Methods
Data Collection
CDC funded four states (Colorado, Connecticut, Minnesota, and New Mexico), two cities (New York City and San Francisco), and 34 counties in New York State to conduct enhanced viral hepatitis surveillance, representing a combined population of approximately 27.3 million persons. In each of these jurisdictions, clinical laboratories are mandated to submit reports from persons with positive HBV and HCV test results. Participating health departments routinely review each report to assess whether the current case definition was met as established by CSTE and CDC. To determine whether a case is new, each site matches new case reports to existing cases in the surveillance registry using personal identifying information. New cases are added to an electronic registry, whereas duplicate cases are used to update previous reports. Most health departments collect basic demographic data (e.g., age, sex, and race/ethnicity) from the laboratory reports. Efforts vary by site regarding the level of investigation undertaken to collect supplemental information (e.g., risk factor data) from patients or their providers.
Analyses
Analyses were conducted on all serologically confirmed cases of chronic hepatitis B and chronic (past or present) hepatitis C infection reported by EIP sites during 2009 and submitted to CDC by November 30, 2010. Rates were calculated using appropriate jurisdiction-specific (state, county, or city) 2009 population estimates obtained from the U.S. Census Bureau.
Limitations
The number of chronic cases included in this report is likely an underestimate of the true prevalence of disease because chronic cases are generally asymptomatic and less likely to be reported. Additionally, data from these sites may not be representative of the U.S. population, and because not all sites conduct comprehensive follow-up, data regarding race/ethnicity, place of birth, and risk are missing for some case reports.
Mortality/Death Certificates
Background
Death certificates are completed for all deaths registered in the United States. Information from death certificates is provided by funeral directors, attending physicians, medical examiners, and coroners, and certificates are filed in vital statistics offices within each state and the District of Columbia. Through a program called the National Vital Statistics System (NVSS) (1), information from death certificates is compiled by CDC’s National Center for Health Statistics (NCHS) to produce national, multiple-cause-of-death (MCOD) data (2); causes of death are coded in accordance with the International Classification of Diseases, Tenth Revision (ICD-10) (3). MCOD data are used to determine the national burden of mortality associated with viral hepatitis infections and to describe the demographic characteristics of decedents.
Methods
We analyzed national multiple-cause mortality data collected during 2004–2007 (the most recent years available) obtained from NCHS. The following case definitions were used to identify a death associated with hepatitis A, B, and C.
Any death record with a report of
- hepatitis A (ICD-10: B15),
- hepatitis B (ICD-10: B16, B17.0, B18.0, and B18.1), or
- hepatitis C (ICD-10: B17.1 and B18.2) listed as the underlying or one of the multiple (e.g., contributing) causes of death in the record axis.
Demographic information on age, race, and sex were examined. Deaths were divided into six age categories: 0–34, 35–44, 45–54, 55–64, 65–74, and >75 years. Race categories consisted of white (Hispanic and non-Hispanic), black (Hispanic and non-Hispanic), and non-black, non-white (which included all other racial and ethnic groups).
To calculate national mortality rates, the number of deaths was divided by the total U.S. Census population for each demographic subgroup. Rates on race, sex, and overall total were standardized to the age distribution of the standard U.S. population in 2000 (4). Data were analyzed using SAS software, version 9.2 (SAS Institute; Cary, NC).
Interpretation of Mortality Data
- Differences in recording practices of death certificate information may cause misclassification of ICD-10 codes and demographic information.
- Certain racial/ethnic populations likely are underrepresented in U.S. Census data (the denominator for calculating rates), potentially causing overestimated rates for these populations.
- Analyses do not adjust for deaths resulting from undiagnosed viral hepatitis infections.
- Death records listing more than one type of viral hepatitis infection were counted once for each type of infection. For example, a death with ICD-10 codes for both hepatitis B and C virus infections is counted once as a hepatitis B death and once as a hepatitis C death.
- The race category designated as “non-white/non-black” includes all other race groups (e.g., APIs, AI/ANs, and persons who are Hispanic). This lack of specificity limits race-specific interpretation of mortality data.
References:
- Xu J, Kochanek KD, Murphy SL, Tejada-Vera B. Deaths: final data for 2007. National Vital Statistics Report 2010;58(19):1–73.
- National Center for Health Statitistics. Mortality data. Accessed July 1 2010. Available at: https://www.cdc.gov/nchs/deaths.htm.
- World Health Organization. International statistical classification of diseases and related health problems, 10th Revision, Version for 2007. Accessed April 23 2010. Available at: http://apps.who.int/classifications/apps/icd/icd10online/.
- Klein RJ, Schoenborn CA. Age adjustment using the 2000 projected U.S. population. U.S. Department of Health and Human Services, 2001;20:1–10.
Highlights of Analyses
Investigations/Consultations
In 2009, CDC participated in 10 state-based investigations of outbreaks of viral hepatitis infection (six involving HBV and four involving HCV infection) (Table 1). The outbreaks of HBV infection occurred in assisted-living facilities, a long-term-care facility, an outpatient oncology clinic, a hospital, and a free dental clinic operating within a school gymnasium. Investigations at these locations revealed that 6,748 persons were potentially exposed to viral hepatitis. Upon testing, 59 of these persons were found to be infected with HBV. Suspected modes of transmission included unsafe practices related to assisted blood glucose monitoring (n= 15), breaches in infection control (n=29), medical procedures performed by an HBV-infected surgeon with a high viral load (n=2), and sexual contact (n=8). Mode of transmission was not identified for five of the patients infected after receiving care at the free dental clinic.
The outbreaks of HCV infection occurred in a hospital, a hospital-based hemodialysis facility, an outpatient hemodialysis facility, and an outpatient alternative medicine clinic. A total of 6,383 persons were identified as being potentially exposed and were tested for HCV infection; 56 of these persons were found to be infected with HCV. Suspected modes of transmission included drug diversion (i.e., the covert use of drugs intended for other persons) by an HCV-infected surgical technician (n=18) and breaches in infection control (n= 38).
Acute Hepatitis A
Historically, acute hepatitis A rates vary cyclically, with nationwide increases every 10–15 years. The last peak was in 1995; since that time, rates of hepatitis A have steadily declined. In 2009, a total of 1,987 acute cases of hepatitis A were reported nationwide to CDC (Table 2.1). The overall incidence rate for 2009 was 0.6 cases per 100,000 population, ranging from 0.1 case per 100,000 population in Louisiana and Maine to 1.4 cases per 100,000 population in South Carolina (Table 2.2). After asymptomatic infection and underreporting were taken into account, an estimated 21,000 new infections occurred in 2009 (see Estimation Procedures).
Table 2.1. Reported cases of acute hepatitis A, nationally and by state ― United States, 2005-2009
- The number of acute hepatitis A cases reported in the United States declined by approximately 56%, from 4,488 in 2005 to 1,987 in 2009.
- The rate of acute hepatitis A declined from 1.5 cases per 100,000 population to 0.6 cases per 100,000 population during 2005–2009.
- In 2009, the case rate ranged from 0.1 case per 100,000 population (Louisiana and Maine) to 1.4 cases per 100,000 population (South Carolina).
Table 2.2. Clinical characteristics of reported cases of acute hepatitis A ― United States, 2009
Of the 1,987 case reports of hepatitis A received during 2009, 55.6% included information about whether the patient had jaundice, 59.3% had information regarding hospitalization caused by hepatitis A, and 55.3% included data for hepatitis A-associated death.
- In 2009, of all case reports with information regarding clinical characteristics,
- 68.8% indicated the patient had jaundice;
- 39.3% indicated the patient was hospitalized as a result of hepatitis A; and
- 0.9% indicated the patient died from hepatitis A.
Figure 2.1. Reported and adjusted number of acute hepatitis A cases – United States, 1990–2009
- The number of reported acute hepatitis A cases decreased 93.7%, from 31,522 in 1990 to 1,987 in 2009.
- The number of acute hepatitis A cases, adjust for underreporting, declined 93.3%, from 135,000 in 1990 to 9,000 in 2009.
Figure 2.2. Incidence of acute hepatitis A, by age group – United States, 1990–2009
- Except for the cyclical peak in 1995, from 1990 through 2002 rates of hepatitis A declined for all age groups.
- From 2002 through 2009, rates were similar and low among persons in all age groups (<1.0 cases per 100,000 population; range: 0.31–0.96).
- In 2009, rates were highest for persons aged 20–29 years (0.96 cases per 100,000 population); the lowest rates were among children aged <9 years (0.3 cases per 100,000 population).
Figure 2.3. Incidence of acute hepatitis A, by sex — United States, 1990-2009
- From 1990 through 2002, rates of acute hepatitis A were higher among males than females.
- The ratio of male to female rates increased from 1.3 in 1990 to 1.9 in 2001; however, from 2006 through 2009, overall rates declined more among males than among females.
- In 2009, incidence rates among males (0.7 cases per 100,000 population) were similar to those among females (0.6 cases per 100,000 population).
- The peak in acute hepatitis A cases observed for both males and females in 1995 was the last of cyclical peaks that occurred in the United States before availability and use of hepatitis A vaccine.
Figure 2.4. – Incidence of acute hepatitis A, by race/ethnicity — United States, 1990–2009
- From 1990 through 1996, rates of acute hepatitis A were highest among AI/ANs (>50 cases per 100,000 population); the lowest rate occurred among APIs (<6 cases per 100,000).
- During 2003–2008, rates among AI/ANs were lower than or similar to those among persons in other races. The 2009 rate of hepatitis A among AI/ANs was the lowest ever recorded (0.3 per 100,000 population).
- From 1990 through 2009, rates among Hispanics were higher than those among all other racial/ethnic populations. However, in 2009, the rate of hepatitis A among Hispanics was 0.8 cases per 100,000 population, the lowest rate ever recorded for this group.
Figure 2.5. Distribution of risk behaviors/exposures associated with acute hepatitis A — United States, 2009
- Of the 1,987 case reports of acute hepatitis A received by CDC during 2009, a total of 818 (41%) cases did not include a response (i.e., a “yes” or “no” response to any of the questions about risk behaviors and exposures) to enable assessment of risk behaviors or exposures.
- Of the 1,169 case reports that had a response:
- 44% (n=879) indicated no risk behaviors/exposures for hepatitis A; and
- 15% (n=290) indicated at least one risk behavior/exposure for hepatitis A during the 2–6 weeks prior to onset of illness.
Figure 2.6a. and 2.6b. – Acute hepatitis A reports, by risk behavior/exposure — United States, 2009
Patients were asked about engagement in selected risk behaviors and exposures during the incubation period, 2–6 weeks prior to onset of symptoms.
- Of the 788 case reports that contained information about contact with a person confirmed or suspected of having hepatitis A, 5.6% (n=44) involved persons who had sexual or household contact with a person confirmed or suspected of having hepatitis A;
- Of the 1,063 case reports that included information about employment or attendance at a nursery, day-care center, or preschool, 2.9% (n=31) involved persons who worked at or attended a nursery, day-care center, or preschool;
- Of the 911 case reports that included information about household contact with an employee of or a child attending a nursery, day-care center, or preschool, 4.9% (n=45) indicated such contact;
- Of the 825 case reports that had information about linkage to an outbreak, 8.2% (n=68) indicated exposure that may have been linked to a common-source foodborne or waterborne outbreak;
- Of the 788 case reports that included information about additional contact (i.e., other than household or sexual contact) with someone confirmed or suspected of having hepatitis A, 2.0% (n=16) of persons reported such contact;
- Of the 794 case reports that had information about travel, 15.0% (n= 119) involved persons who had traveled outside the United States or Canada;
- • Of the 813 case reports that included information about injection-drug use, 1.1% (n=9) indicated use of these drugs.
- Of the 69 case reports from males that included information about sexual preference/practices, 8.7% (n=6) indicated sex with another man.
Table 2.3. Number and rate of deaths with hepatitis A listed as a cause of death, by demographic characteristics and year — United States, 2004–2007
- In 2007, the mortality rate of hepatitis A was 0.03 per 100,000 population (n=85).
- During all 4 years, mortality rates were highest among persons aged ≥75 years compared with other age groups (in 2007 the rate was 0.11 death per 100,000 population).
- In 2007, hepatitis A mortality rates were similar among blacks and whites; persons whose race/ethnicity was classified as “other” had lower rates.
- From 2004 through 2007, the hepatitis A mortality rate was consistently higher among males than among females.
Acute Hepatitis B
In 2009, a total of 3,371 acute cases of hepatitis B were reported nationwide to CDC (Table 3.1). The overall incidence rate for 2009 was 1.1 cases per 100,000 population, ranging from 0.1 case per 100,000 population in Montana to 4.6 cases per 100,000 population in West Virginia. After adjusting for asymptomatic infections and under-reporting, the estimated number of new HBV infections in 2009 was 38,000 (see Estimation Procedures).
Table 3.1. Reported cases of acute hepatitis B, nationally and by state ― United States, 2005–2009
- The number of acute cases of hepatitis B decreased by 39% overall during 2005–2009, from 5,494 cases to 3,371 cases; slight increases in Kentucky and Oklahoma occurred during this time period.
- Of the 47 states that reported acute hepatitis B cases in 2009, 23 had rates below the national rate of 0.6 per 100,000 population.
- Rates of acute hepatitis B in 2009 ranged from 0.1 case per 100,000 population (Montana) to 4.6 cases per 100,000 population (West Virginia).
Table 3.2. Clinical characteristics of reported cases of acute hepatitis B ― United States, 2009
- • Of the 3,371 case reports of acute hepatitis B received in 2009, 58.1% included information regarding whether the patient had jaundice, 63.1% had information regarding hospitalization caused by hepatitis B, and 56.4% included data for hepatitis B-associated deaths.
- In 2009, of all case reports with information about clinical characteristics,
- 76.9% indicated the patient had jaundice;
- 46.7% indicated the patient was hospitalized as a result of hepatitis B; and
- 1.3% indicated the patient died from hepatitis B.
Figure 3.1. Reported and adjusted number of acute hepatitis B cases — United States, 1990–2009
- The number of reported cases of acute hepatitis B decreased 84.2%, from 21,277 in 1990 to 3,371 in 2009.
- When adjusted for underreporting, the number of acute hepatitis B cases decreased 84.8%, from 59,000 in 1990 to 9,000 in 2009.
Figure 3.2. Incidence of acute hepatitis B, by age group — United States, 1990–2009
- From 1990 through 2009, incidence rates for acute hepatitis B decreased for all age groups; the greatest declines occurred in the 20–29 and 30–39 year age groups.
- In 2009, the highest rates were among persons aged 30–39 years (2.28 cases/100,000 population), and the lowest were among adolescents and children aged <19 years (0.06 cases/100,000 population).
Figure 3.3. Incidence of acute hepatitis B, by sex — United States, 1990–2009
- Incidence rates of acute hepatitis B decreased dramatically for both males and females from 1990 through 2009. Additionally, the gap in acute hepatitis B incidence rates between males and females narrowed over this period.
- In 2009, the rate for males was approximately 1.6 times higher than that for females (1.36 cases and 0.84 cases per 100, 000 population, respectively).
Figure 3.4. Incidence of acute hepatitis B, by race/ethnicity — United States, 1990–2009
- From 1990 through 2009, rates for acute hepatitis B decreased for all race/ethnicity groups, except AI/ANs.
- During 1993–2003, AI/ANs experienced small spikes in rates that stabilized and closely matched rates of other racial/ethnic populations beginning in 2004. The incidence rate of acute hepatitis B was <4.25 cases per 100,000 population for all race/ethnic populations from 2002 through 2009.
- In 2009, the rate of acute hepatitis B was lowest for APIs and Hispanics (0.67 cases per 100,000 population for each group) and highest for non-Hispanic blacks (1.68 cases per 100,000 population).
Figure 3.5. Distribution of risk behaviors/exposures associated with acute hepatitis B — United States, 2009
- Of the 3,371 case reports of acute hepatitis B received by CDC during 2009, a total of 1,656 (49%) did not include a response (i.e., a “yes” or “no” response to any of the questions about risk behaviors and exposures) to enable assessment of risk behaviors or exposures.
- Of the 1,715 case reports that had complete information, 60.1% (n=1,030) indicated no risk behaviors/exposures for hepatitis B, and 39.9% (n=685) indicated at least one risk behavior/exposure for hepatitis B during the 6 weeks to 6 months prior to illness onset.
Figure 3.6a. and Figure 3.6b. Reported cases of acute hepatitis B, by risk behavior/exposure — United States, 2009
Patients were asked about engagement in selected risk behaviors and exposures during the incubation period, 6 weeks to 6 months prior to onset of symptoms.
- Of the 1,550 case reports that contained information about occupational exposures, 0.8% (n=13) indicated employment in a medical, dental, or other field involving contact with human blood.
- Of the 1,231 case reports that included information about receipt of dialysis or kidney transplant, 0.3% (n=4) reported receipt of dialysis or a kidney transplant.
- Of the 1,400 case reports that had information about receipt of blood transfusion, 0.5% (n=7) noted receipt of a blood transfusion.
- Of the 1,407 case reports that had information about surgery, 11.1% (n=156) reported surgery.
- Of the 1,287 case reports that had information about accidental needle sticks, 4.8% (n=62) involved accidental needle stick/puncture.
- Of the 1,517 case reports that had information about injection-drug use, 15.8% (n=239) noted use of these drugs.
- Of the 943 case reports that had information about sexual contact, 7.2% (n=68) indicated sexual contact with a person with confirmed or suspected hepatitis B infection.
- Of the 943 case reports that had information about household contact, 1.9% (n=18) indicated household contact with someone with confirmed or suspected hepatitis B infection.
- Of the 893 case reports that had information about number of sex partners, 31.8% (n=284) were among persons with ≥2 sex partners.
- Of the 224 case reports from males that included information about sexual preference/practices, 18.8% (n=42) indicated sex with another man.
Chronic Hepatitis B
Table 3.3. Number of laboratory-confirmed, chronic hepatitis B* case reports† — National Notifiable Diseases Surveillance System (NNDSS), 2009
- In 2009, a total of 38 states submitted 21,056 reports of chronic hepatitis B to CDC.
- Fourteen states agreed to publication of NNDSS data for this report, representing 32.7% (n=6,892) of all reports of chronic hepatitis B received by CDC.
- In 2009, the greatest number of reports was received from Georgia (n=2,098), representing 30.4% of all reports received; the least number of reports was received from South Dakota (n=32; 0.5%).
Table 3.4. Reported cases of laboratory-confirmed, chronic hepatitis B virus (HBV) infection, by sex, race/ethnicity, age group, and case criteria — Emerging Infections Program (EIP) Enhanced Viral Hepatitis Surveillance, 2009
- A total of 11,558 chronic hepatitis B cases were reported by the seven EIP sites.
- New York City reported the greatest number of cases (n=7,667; 66.3%) compared with other sites.
- San Francisco had the highest rate of chronic HBV infection, with 115 cases per 100,000 population.
- Within all sites, at least 50.0% of cases occurred among men.
- Among patients for whom race/ethnicity was known, APIs accounted for the highest proportion of chronic HBV case reports from all sites.
- For all sites, the highest proportion of case reports (n=8,213; 71.1%) were among persons aged 25–54 years.
- HBsAg was the most common laboratory marker used to confirm a case of chronic hepatitis B.
Table 3.5. Number and rate of deaths with hepatitis B listed as a cause of death, by demographic characteristics and year — United States, 2004–2007
- From 2004–2007, hepatitis B accounted for more deaths than hepatitis A but fewer deaths than hepatitis C.
- In 2007, the mortality rate for hepatitis B was 0.56 deaths per 100,000 population (n=1,815).
- Age-specific annual mortality rates were relatively constant from 2004 through 2007.
- From 2004–2007, the mortality rate increased among persons aged 55–64 years, from 1.36 deaths per 100,000 population in 2004 to 1.67 deaths per 100,000 population in 2007.
- In 2007, the highest mortality rates were observed among persons aged 55–64 years (1.67 deaths per 100,000 population), among those in the “non-white, non-black” race category (2.16 deaths per 100,000 population), and among males (0.88 deaths per 100,000 population).
Acute Hepatitis C
In 2009, a total of 40 states and the District of Columbia submitted 781 reports of acute hepatitis C to CDC (Table 4.1). The incidence rate for 2009 was 0.3 case per 100,000 population and has remained stable since 2006. After adjusting for asymptomatic infections and underreporting, an estimated 16,000 new infections of HCV occurred in 2009 (see Estimation Procedures).
Table 4.1. Reported cases of acute hepatitis C, nationally and by state ― United States, 2005–2009
- The number of acute cases of hepatitis C reported in the United States increased about 12.5%, from 694 in 2005 to 781 in 2009.
- The national rate of acute cases of hepatitis C remained stable, at 0.3 cases per 100,000 population from 2006 through 2009.
- Of the 41 states that submitted reports of acute hepatitis C in 2009, 18 states and the District of Columbia had rates below the national rate (0.3 cases per 100,000 population).
- Rates of acute hepatitis C ranged from 0.1 case per 100,000 population (Arkansas, California, Montana, New Jersey, Texas, Virginia, and Wisconsin) to 1.7 cases per 100,000 population (West Virginia).
Table 4.2. Clinical characteristics of reported cases of acute hepatitis C ― United States, 2009
- Of the 781 case reports of acute hepatitis C received in 2009, 69.9% included information regarding whether the patient had jaundice, 67.5% had data regarding hospitalization caused by hepatitis C, and 57.4% included data for hepatitis C-associated deaths.
- In 2009, of all case reports with information regarding clinical characteristics,
- 74.7% indicated the patient had jaundice;
- 56.2% indicated the patient was hospitalized as a result of hepatitis C; and
- 0.4% indicated the patient died from hepatitis C.
Figure 4.1. Reported and adjusted number of acute hepatitis C cases — United States, 1992–2009
- The number of reported cases of acute hepatitis C decreased 87%, from 6,010 in 1992 to 781 in 2009.
- When adjusted for underreporting, the number of acute hepatitis C cases decreased 78.4%, from 12,010 in 1992 to 2,600 in 2009.
Figure 4.2. Incidence of acute hepatitis C, by age group — United States, 1992–2009
- From 1992 through 2002, incidence rates for acute hepatitis C decreased for all age groups (excluding the 0–19 year age group); rates remained fairly constant from 2002 through 2009.
- In 2009, rates were highest among persons aged 20–29 years (0.7 cases per 100,000 population) and lowest among persons ≥60 years of age (0.04 cases per 100,000 population)
Figure 4.3. Incidence of acute hepatitis C, by sex — United States, 1992–2009
- Incidence rates of acute hepatitis C decreased dramatically for both males and females from 1992 through 2004 and remained fairly constant from 2005 through 2009.
- Rates for males declined faster than rates for females and by 2004, the rates were nearly equal.
- In 2009, rates for males and females were both estimated at 0.3 cases per 100,000 population.
Figure 4.4. Incidence of acute hepatitis C, by race/ethnicity — United States, 1992–2009
- Rates for acute hepatitis C decreased for all racial/ethnic populations from 1992 through 2009.
- During 2002–2009, the incidence rate of acute hepatitis C remained below 0.5 cases per 100,000 for all racial/ethnic populations except AI/ANs.
- In 2009 the rate for hepatitis C was lowest among APIs (0.04 case per 100,000 population) and highest among AI/ANs (0.46 case per 100,000 population).
Figure 4.5. Distribution of risk behaviors/exposures associated with acute hepatitis C — United States, 2009
- Of the 781 case reports of acute hepatitis C received by CDC during 2009, 290 (37%) did not include a response (i.e., a “yes” or “no” response to any of the questions about risk behaviors and exposures) to enable assessment of risk behaviors or exposures.
- Of the 491 (63%) case reports that had complete information, 31% (n=152) indicated no risk behaviors/exposures for hepatitis C infection, and 69% (n=339) indicated at least one risk behavior/exposure for hepatitis C infection during the 6 weeks to 6 months prior to illness onset.
Figure 4.6a. and Figure 4.6b. Reported cases of acute hepatitis C, by risk behavior/exposure — United States, 2009
Patients were asked about engagement in selected risk behaviors and exposures during the incubation period, 2 weeks to 6 months prior to onset of symptoms.
- Of the 410 case reports that contained information about occupational exposures, 1.9% (n=8) involved persons employed in a medical, dental, or other field involving contact with human blood.
- Of the 354 case reports that had information about receipt of dialysis or a kidney transplant, 0.3% (n=1) indicated patient receipt of dialysis or a kidney transplant.
- Of the 334 case reports that had information about surgery, 17.7% (n=59) were among persons who had undergone surgery.
- Of the 344 case reports that included information about needle sticks, 9.3% (n=32) indicated accidental needle stick/puncture.
- Of the 432 case reports that had information about injection-drug use, 55.8% (n=241) noted use of these drugs.
- Of the 47 case reports from males that included information about sexual preferences/practices, 2.1% (n=1) indicated sex with another man.
- Of the 153 case reports that had information about sexual contact, 16.3% (n=25) involved persons reporting sexual contact with a person with confirmed or suspected hepatitis C infection.
- Of the 281 case reports that had information about number of sex partners, 33.5% (n=94) involved persons with ≥2 sex partners.
- Of the 153 case reports that had information about household contact, 3.3% (n=5) indicated household contact with someone with confirmed or suspected hepatitis C infection.
Hepatitis C, past or present
Table 4.3. Number of laboratory confirmed, chronic (past or present) hepatitis C case reports — National Notifiable Diseases Surveillance System (NNDSS), 2009
- In 2009, a total of 205,997 reports of chronic hepatitis C (past or present) infection were submitted to CDC by 36 states.
- Eleven states agreed to publication of their NNDSS data for this report, representing 23.9% (n=49,311) of all reports of chronic hepatitis C received by CDC in 2009.
- Of the 11 states, the greatest number of reports was received from Pennsylvania (n=9,498), representing 19.3% of all reports received; the least number of reports was received from South Dakota (n=382; 0.8%).
Table 4.4. Reported cases of laboratory-confirmed, chronic (past or present) hepatitis C infection, by sex, race/ethnicity, age group, and case criteria — Emerging Infections Program (EIP) Enhanced Viral Hepatitis Surveillance, 2009
- A total of 32,973 chronic hepatitis C patients were reported by the seven EIP sites.
- More cases were reported by New York City (n=10,846; 32.9%) compared with other sites.
- San Francisco had the highest rate of chronic HCV infection, with 276 cases per 100,000 population.
- Overall, two-thirds (66.3%) of reported cases were among males. In each site, males made up at least 60% of cases.
- Among all cases for whom race/ethnicity was known, non-Hispanic whites accounted for the highest proportion (24.7%) of chronic HCV case reports.
- Among all cases, most (43.2%) were among persons aged 40–54 years.
- Across all sites, HCV RNA or anti-HCV with a high signal-to-cutoff ratio was the most common laboratory marker used to confirm a case.
Table 4.5. Number and rate of deaths with hepatitis C listed as a cause of death, by demographic characteristics and year — United States, 2004–2007.
- Of the three types of viral hepatitis (hepatitis A, B, and C), hepatitis C accounted for the most deaths and the highest death rate.
- In 2007, the mortality rate of hepatitis C was 4.6 deaths per 100,000 population (n=15,106).
- From 2004 through 2006, the highest mortality rates were observed among persons aged 45–54 years.
- In 2007, the highest mortality rate (15.7 deaths per 100,000 population) was observed for persons aged 55–64 years.
- From 2004 through 2007, the highest mortality rates were observed among blacks (6.5, 6.9, 7.5, and 7.6 deaths per 100,000 population in 2004–2007, respectively) and males (5.4, 5.6, 6.3, and 6.6 deaths per 100,000 population in 2004–2007, respectively).
Discussion
National surveillance data for viral hepatitis provide essential information for developing prevention strategies and monitoring their effectiveness. National rates for acute hepatitis A and B have been published since 1966, and national rates for acute hepatitis C/non-A, non-B have been published since 1992. Major changes in the epidemiology of these diseases have occurred over these time periods, largely resulting from implementation of prevention strategies for each disease, including the introduction of effective vaccines against hepatitis A and hepatitis B.
Nationally notifiable disease data are collected and compiled from reports sent by state health departments and territories to NNDSS. Although NNDSS represents the core of viral hepatitis surveillance, disease reporting is likely incomplete and can vary by jurisdiction. To better count and characterize cases of viral hepatitis and estimate the burden of disease, CDC’s DVH supplements NNDSS data with those obtained from funded EIP sites, national surveys, and vital statistics (1).
Data from NNDSS indicate declining rates of acute hepatitis A, acute hepatitis B, and acute hepatitis C during 1995–2009. More recent data show the rate of decline has decreased, and incidence has become relatively stable for all three diseases. However, new infections with HAV, HBV, and HCV remain common. In 2009, after adjusting for asymptomatic cases and underreporting, the estimated incidence of HAV, HBV, and HCV infections was 21,000, 38,000, and 16,000 cases, respectively. Despite decreases in acute viral hepatitis, chronic hepatitis infection continues to affect millions of Americans. In the United States, an estimated 700,000–1.4 million persons are living with chronic hepatitis B infection (2,3), and an estimated 2.7–3.9 million persons are chronically infected with hepatitis C (4).
In 2009, more than 21,000 reports of chronic hepatitis B and more than 205,000 reports of chronic hepatitis C were submitted to CDC through NNDSS. Of these, 6,892 reports of chronic hepatitis B infection and 49,312 reports of chronic hepatitis C infections were available for descriptive analyses. An additional 11,558 case reports of chronic hepatitis B and 32,973 case reports of chronic hepatitis C were received from seven EIP sites during the same year.
Mortality data from 2007, the latest year for which these data were available, reveal the serious health consequences associated with viral hepatitis: chronic liver disease, including cirrhosis, was the 12th leading cause of death in the United States in 2007 (2). Viral-hepatitis-associated death rates were highest among persons infected with HCV (4.6 deaths per 100,000 population), followed by HBV (0.56 deaths per 100,000 population), and HAV (0.03 deaths per 100,000 population).
CDC and state health departments rely on surveillance data to track the incidence of acute infection, guide development and evaluation of programs and policies designed to prevent infection and minimize the public health impact of viral hepatitis and related disease, and monitor progress towards achieving goals established for these programs and policies. Effective systems for conducting surveillance for chronic HBV and HCV infections are needed to ensure accurate reporting of all cases and to support and evaluate prevention activities. Additional investments in surveillance at the local, state, and national levels are essential to building strong prevention programs that interrupt transmission of viral hepatitis and improve the health of persons living with viral hepatitis.
References
- Klevens RM, Miller J, Vonderwahl C, et al. Population-based surveillance for hepatitis C virus, United States, 2006–2007. Emerg Infect Dis 2009;15: 1499–1502.
- CDC. Recommendations for identification and public health management of persons with chronic hepatitis B virus infection. MMWR 2008;57(No. RR-08).
- Ioannou G. Hepatitis B virus in the United States: Infection, exposure, and immunity rates in a nationally representative survey. Ann Intern Med 2011:145:319-328.
- Armstrong GL, Wasley AM, Simard EP, et al. The prevalence of hepatitis C virus infection in the United States, 1999 through 2002. Ann Intern Med 2006;144:705–14.
Additional Resources
Epidemiology and Prevention of Vaccine-Preventable Diseases. The Pink Book: Course Textbook
Hepatitis A: https://www.cdc.gov/vaccines/pubs/pinkbook/downloads/hepa.pdf [PDF – 14 Pages]
Hepatitis B: https://www.cdc.gov/vaccines/pubs/pinkbook/downloads/hepb.pdf [PDF – 24 Pages]
Prevention of Hepatitis A through Active or Passive Immunization: Recommendations of the Advisory Committee on Immunization Practices (ACIP): https://www.cdc.gov/mmwr/pdf/rr/rr5507.pdf [PDF – 30 Pages]
A Comprehensive Immunization Strategy to Eliminate Transmission of Hepatitis B Virus Infection in the United States — Part I: Immunization of Infants, Children, and Adolescents: https://www.cdc.gov/mmwr/PDF/rr/rr5416.pdf [PDF – 39 Pages]
A Comprehensive Immunization Strategy to Eliminate Transmission of Hepatitis B Virus Infection in the United States — Part II: Immunization of Adults: https://www.cdc.gov/mmwr/PDF/rr/rr5516.pdf [PDF – 40 Pages]
Recommendations for Identification and Public Health Management of Persons with Chronic Hepatitis B Virus Infection: https://www.cdc.gov/mmwr/pdf/rr/rr5708.pdf [PDF – 28 Pages]
Recommendations for Prevention and Control of Hepatitis C Virus (HCV) Infection and HCV-Related Chronic Disease: https://www.cdc.gov/mmwr/PDF/RR/RR4719.pdf [PDF – 54 Pages]
2005 Guidelines for Viral Hepatitis Surveillance and Case Management: https://www.cdc.gov/hepatitis/SurveillanceGuidelines.htm