Content on this page was developed during the 2009-2010 H1N1 pandemic and has not been updated.
- The H1N1 virus that caused that pandemic is now a regular human flu virus and continues to circulate seasonally worldwide.
- The English language content on this website is being archived for historic and reference purposes only.
- For current, updated information on seasonal flu, including information about H1N1, see the CDC Seasonal Flu website.
Graph and Table of 2009 H1N1 Influenza Vaccine Doses
Allocated, Ordered, and Shipped in U.S.
Updated Januray 11, 2010, 5:00 PM ET
Graph. 2009 H1N1 Influenza Vaccine Doses Allocated, Ordered, and Shipped in U.S.
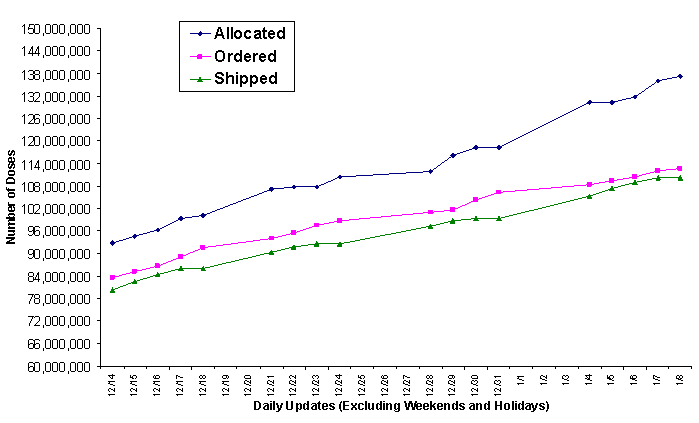
(NOTE: all data in graph can be found in table below.)
- Allocated: Doses that are at the distribution depots and ready for states to order. Vaccine is allocated to each state in proportion to its population (pro rata)
- Ordered: Doses requested by states as of 9 PM ET for shipment to state-designated locations
- Shipped: Doses sent as of 5 PM ET from the central distributor to state-designated locations
Previous H1N1 Influenza Vaccine Supply Graph Pages
- January 8, 2010
- January 7, 2010
- January 6, 2010
- January 5, 2010
- January 4, 2010
- December 31, 2009
- December 30, 2009
- December 29, 2009
- December 28, 2009
- December 24, 2009
- December 23, 2009
- December 22, 2009
- December 21, 2009
- December 18, 2009
- December 17, 2009
- December 16, 2009
- December 15, 2009
- December 14, 2009
