Incidence Trends
FoodNet uses a main-effects, log-linear Poisson regression (negative binomial) model to estimate changes in the incidence of infection and to measure overall trends in incidence.
FoodNet uses a main-effects, log-linear Poisson regression (negative binomial) model to estimate changes in the incidence of infection. The model adjusts for the increase in the number of FoodNet sites since 1996 and for variation in the incidence of infections among sites. The average annual incidence for 1) 1996–1998 (1997–1998 for Cryptosporidium), the first years of surveillance, 2) a more recent 3-year period (2006–2008), and 3) the preceding 3 years (2012–2014) are used for comparisons. The model is used to calculate the estimated change in incidence (relative rate) between 2015 and the comparison periods, with 95% confidence intervals (CI). In the figures that report percentage change, the percentage change for the current year is calculated by comparison with the appropriate comparison period and graphed along with the 95% confidence interval. In the figures that report relative rate, the relative rate for each year is graphed. For STEC non-O157, only change since 2012–2014 was assessed because diagnostic practices changed before then; for Cyclospora, change was not assessed because data were sparse.
By pathogen
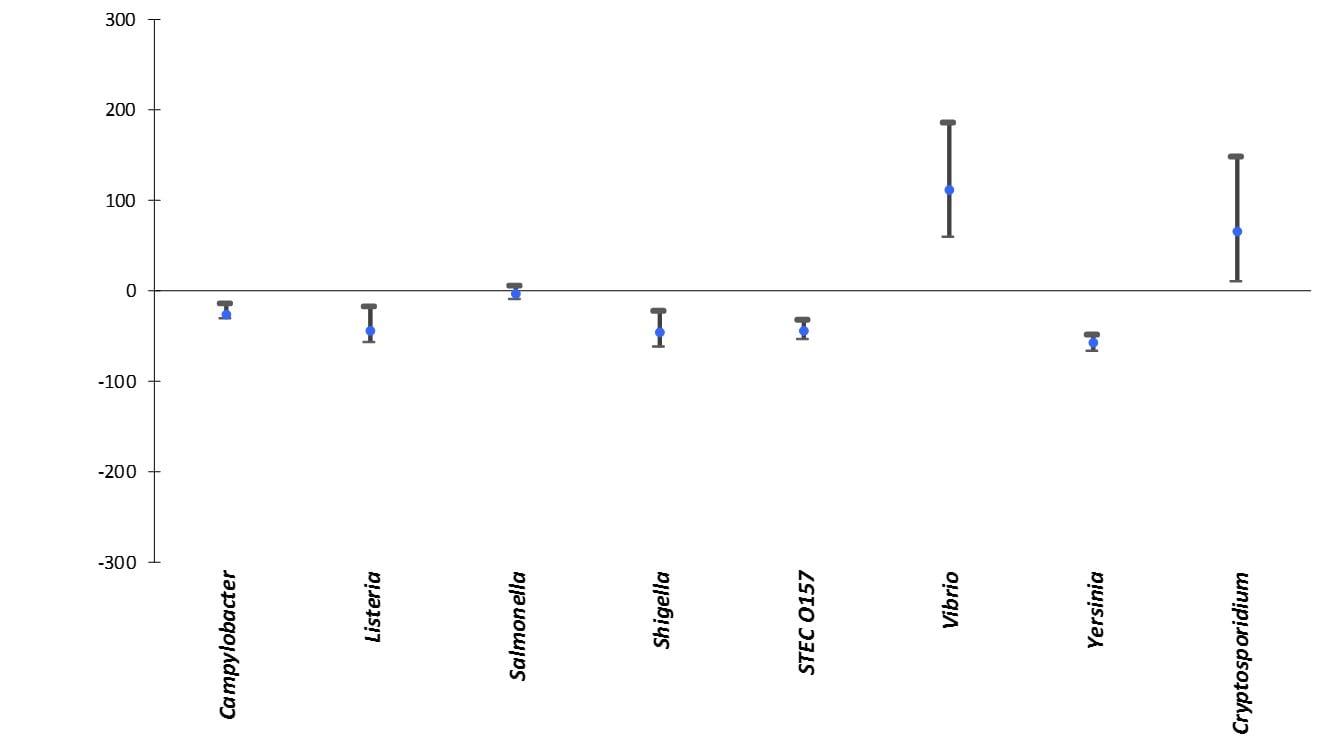
Figure 1. Percentage change in incidence* of culture-confirmed bacterial and laboratory-confirmed parasitic infections in 2015† compared with average annual incidence during 1996–1998, by pathogen, FoodNet
Pathogen
*The estimates and confidence intervals presented indicate the relative change in the incidence of that pathogen compared with 1996–1998. The actual incidences of these infections cannot be determined from the graph.
†Data are preliminary
§No significant change = 95% confidence interval is both above and below the no change line; significant increase = estimate and entire 95% confidence interval are above the no change line; significant decrease = estimate and entire 95% confidence interval are below the no change line
¶Shiga toxin-producing Escherichia coli
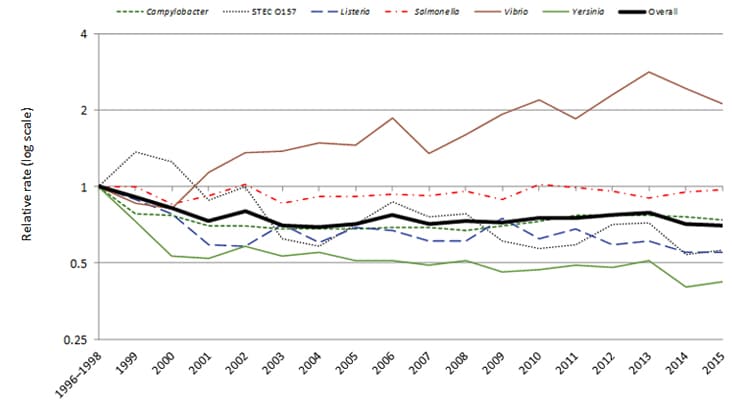
Figure 2. Relative rates of culture-confirmed infections with Campylobacter, STEC* O157, Listeria, Salmonella, and Vibrio compared with 1996–1998 rates, by year, FoodNet 1996–2015†
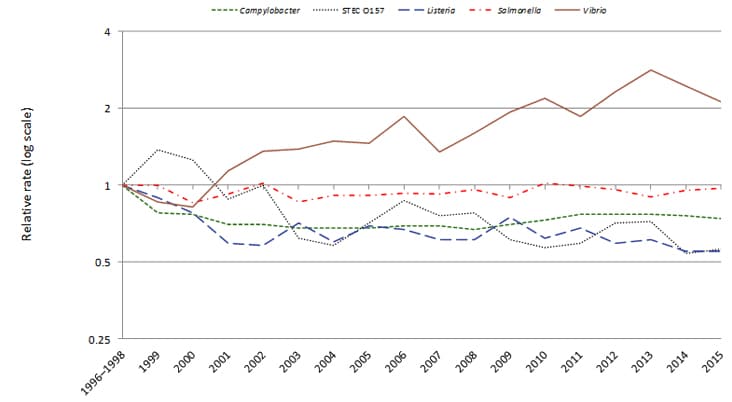
*Shiga toxin-producing Escherichia coli
†The position of each line indicates the relative change in the incidence of that pathogen compared with 1996–1998. The actual incidences of these infections cannot be determined from this graph. Data for 2015 are preliminary.
Figure 3. Relative rates of culture-confirmed infections with Shigella and Yersinia, and laboratory-confirmed infections with Cryptosporidium compared with 1996–1998 rates, by year, FoodNet 1996–2015*
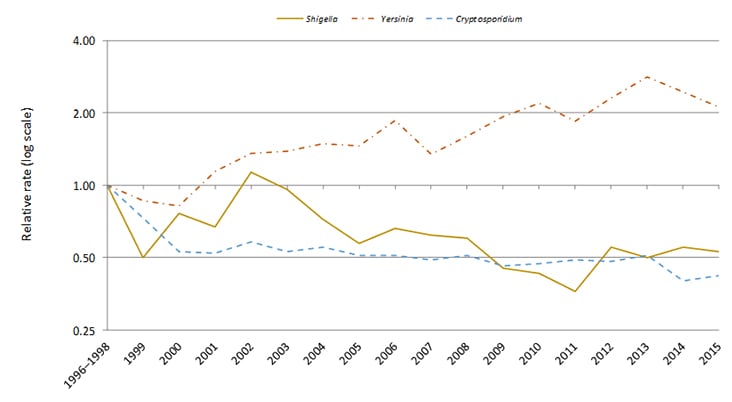
*The position of each line indicates the relative change in the incidence of that pathogen compared with 1996–1998. The actual incidences of these infections cannot be determined from this graph. Data for 2015 are preliminary.
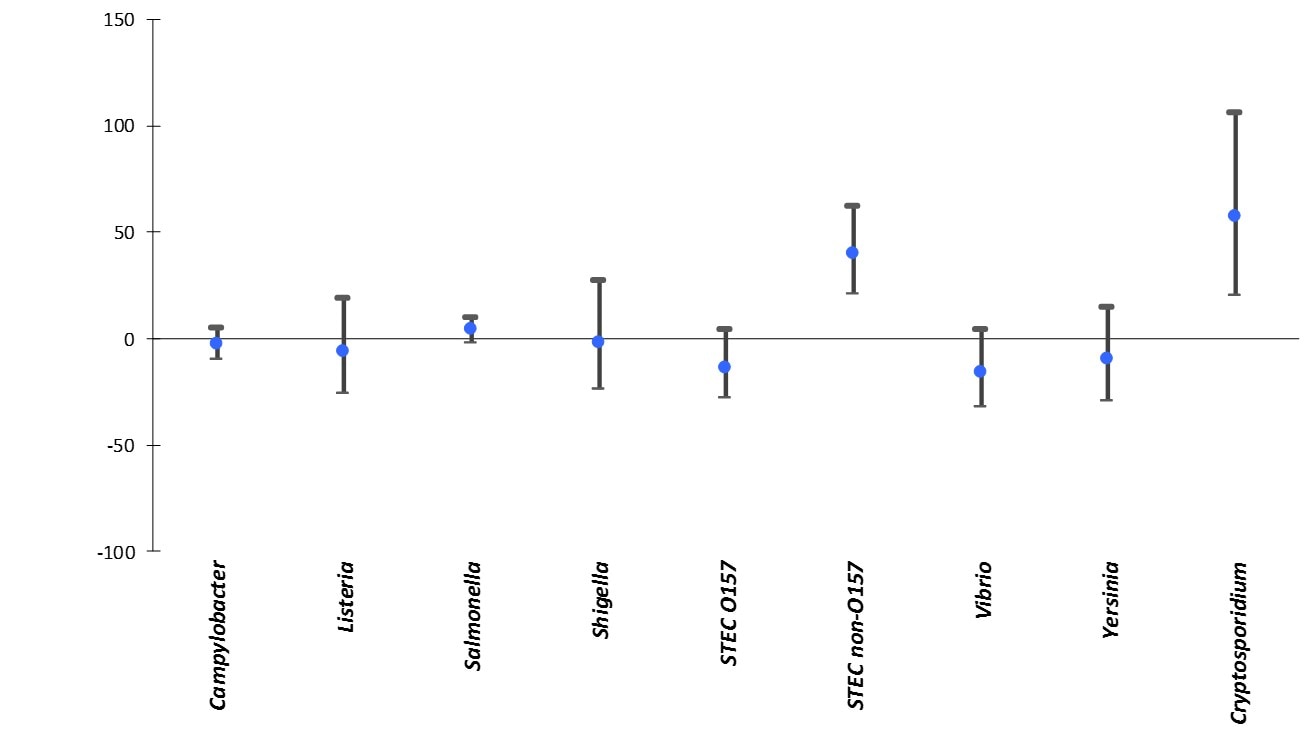
Figure 1. Percentage change in incidence* of culture-confirmed bacterial and laboratory-confirmed parasitic infections in 2015† compared with average annual incidence during 2006–2008, by pathogen, FoodNet
Pathogen
*The estimates and confidence intervals presented indicate the relative change in the incidence of that pathogen compared with 2006–2008. The actual incidences of these infections cannot be determined from the graph.
†Data are preliminary
§No significant change = 95% confidence interval is both above and below the no change line; significant increase = estimate and entire 95% confidence interval are above the no change line; significant decrease = estimate and entire 95% confidence interval are below the no change line
¶Shiga toxin-producing Escherichia coli
Figure 2. Relative rates of culture-confirmed infections with Campylobacter, STEC* O157, Listeria, Salmonella, and Vibrio compared with 2006–2008 rates, by year, FoodNet 2006–2015†
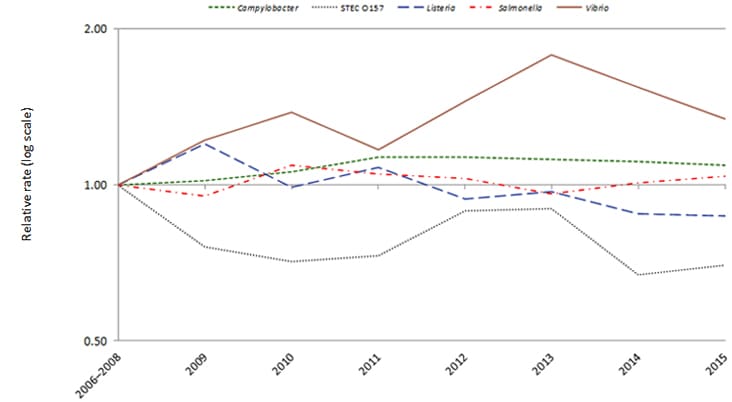
*Shiga toxin-producing Escherichia coli
†The position of each line indicates the relative change in the incidence of that pathogen compared with 2006–2008. The actual incidences of these infections cannot be determined from this graph. Data for 2015 are preliminary.
Figure 3. Relative rates of culture-confirmed infections with Shigella, Yersinia, and laboratory-confirmed infections with Cryptosporidium compared with 2006–2008 rates, by year, FoodNet 2006–2015*
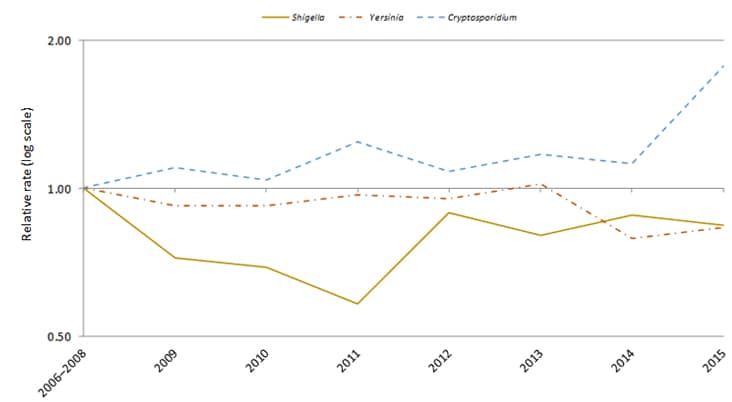
*The position of each line indicates the relative change in the incidence of that pathogen compared with 2006–2008. The actual incidences of these infections cannot be determined from this graph. Data for 2014 are preliminary.
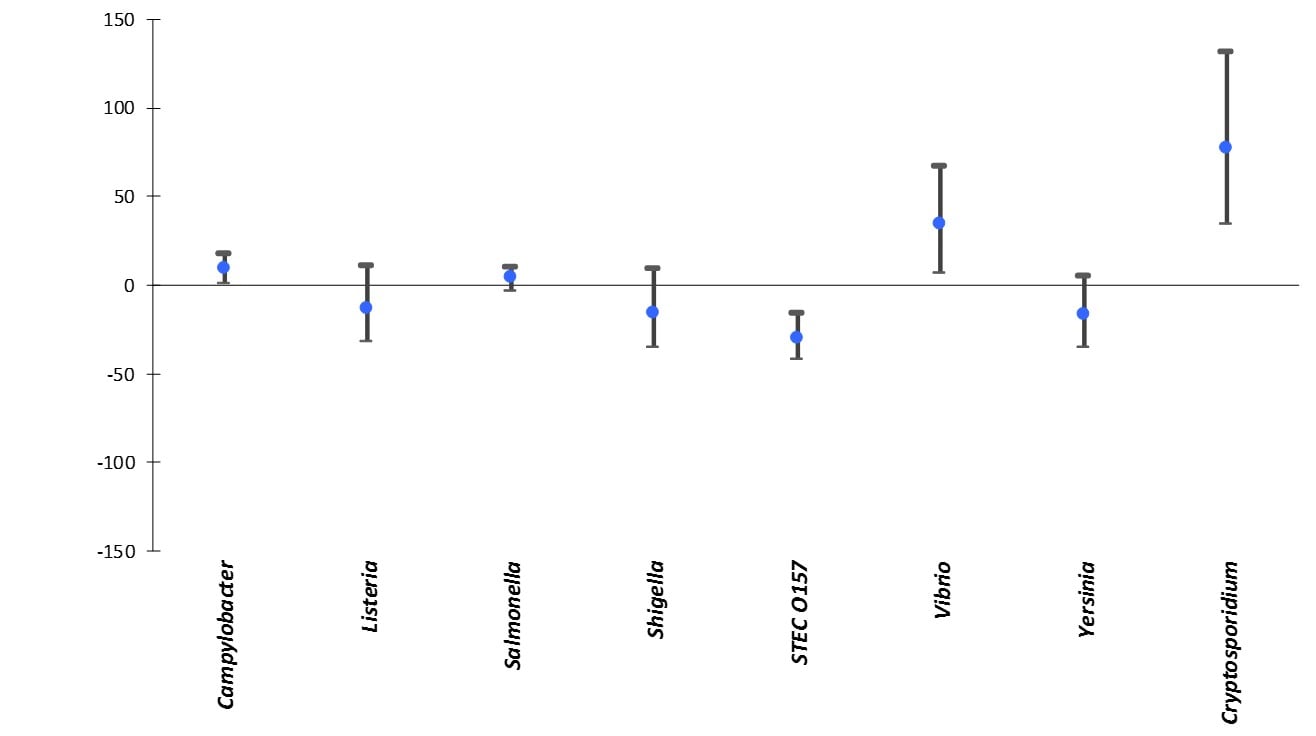
Figure 4. Percentage change in incidence* of culture-confirmed bacterial and laboratory-confirmed parasitic infections in 2015† compared with average annual incidence during 2012–2014, by pathogen, FoodNet
Pathogen
*The estimates and confidence intervals presented indicate the relative change in the incidence of that pathogen compared with 2012–2014. The actual incidences of these infections cannot be determined from the graph.
†Data are preliminary
§No significant change = 95% confidence interval is both above and below the no change line; significant increase = estimate and entire 95% confidence interval are above the no change line; significant decrease = estimate and entire 95% confidence interval are below the no change line
¶Shiga toxin-producing Escherichia coli
| 1996–1998 comparison period | 2006–2008 comparison period | 2012–2014 comparison period | ||||
|---|---|---|---|---|---|---|
| Pathogen/Syndrome | % change† | (95% CI) | % change† | (95% CI) | % change† | (95% CI) |
| Campylobacter | 26%↓ | (18%↓ – 32%↓) | 9%↑ | (1%↑ – 18%↑) | 3%↓ | (10%↓ – 5%↑) |
| Listeria§ | 45%↓ | (28%↓ – 58%↓) | 13%↓ | (31%↓ – 11%↑) | 6%↓ | (26%↓ – 19%↑) |
| Salmonella | 3%↓ | (10%↓ – 5%↑) | 4%↑ | (3%↓ – 10%↑) | 4%↑ | (2%↓ – 10%↑) |
| Shigella | 47%↓ | (28%↓ – 62%↓) | 16%↓ | (35%↓ – 9%↑) | 2%↓ | (24%↓ – 27%↑) |
| STEC¶ O157 | 44%↓ | (30%↓ – 55%↓) | 30%↓ | (16%↓ – 42%↓) | 14%↓ | (28%↓ – 4%↑) |
| STEC non-O157 | N/A** | N/A | 40%↑ | (21%↑ – 62%↑) | ||
| Vibrio | 112%↑ | (58%↑ – 185%↑) | 34%↑ | (7%↑ – 67%↑) | 16%↓ | (32%↓ – 4%↑) |
| Yersinia | 58%↓ | (46%↓ – 68%↓) | 17%↓ | (35%↓ – 5%↑) | 10%↓ | (29%↓ – 15%↑) |
| Cryptosporidium | 65%↑ | (10%↑ – 147%↑) | 77%↑ | (34%↑ – 132%↑) | 57%↑ | (20%↑ – 106%↑) |
| Cyclospora | N/A | N/A | N/A | |||
| HUS†† | N/A | 49%↓ | (25%↓ – 65%↓ ) | 29%↓ | (52%↓ – 6%↑) | |
*Data are preliminary
†Percentage change reported as increase (↑) or as decrease (↓)
§Listeria cases defined as isolation of L. monocytogenes from a normally sterile site or, in the setting of miscarriage or stillbirth, isolation of L. monocytogenes from placental or fetal tissue
¶Shiga toxin-producing Escherichia coli
**Changes over time not evaluated
††Change in incidence of postdiarrheal HUS in children aged <5 years for 2014, comparison period is 2011-2013
Download the table: Table 8. Percentage Change in Incidence of Infections, 2015 Cdc-excel[XLS – 11KB]
By Salmonella serotype
Figure 8. Percentage change in incidence* of culture-confirmed Salmonella infections with the top Salmonella serotypes in 2015† compared with average annual incidence during 1996–1998, by serotype, FoodNet
*The estimates and confidence intervals presented indicate the relative change in the incidence of that serotype compared with 1996–1998. The actual incidences of these infections cannot be determined from the graph.
†Data are preliminary. Percentage change was not evaluated for serotypes Javiana, I 4,[5],12:i:-, and Poona.
§No significant change = 95% confidence interval is both above and below the no change line; significant increase = estimate and entire 95% confidence interval are above the no change line; significant decrease = estimate and entire 95% confidence interval are below the no change line
Figure 9. Relative rates of culture-confirmed Salmonella infections with the top Salmonella serotypes in 2015* compared with 1996–1998 rates, by year, FoodNet 1996–2015†
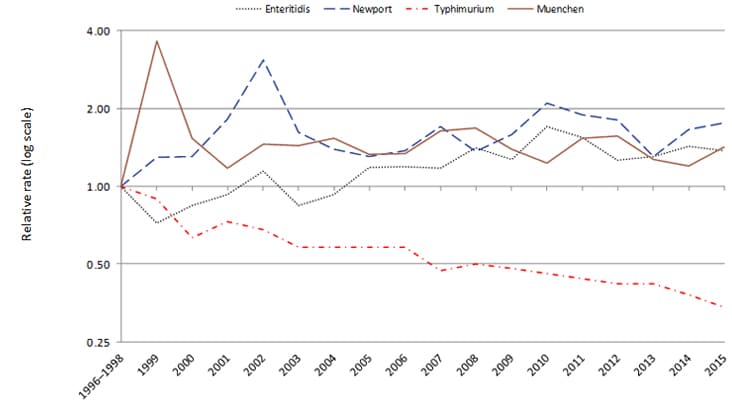
*Data for 2015 are preliminary. Salmonella serotypes included are: Enteritidis, Typhimurium, Newport, and Muenchen. Changes over time for serotypes Javiana, I 4,[5],12:i:-, and Poona were not evaluated.
†The position of each line indicates the relative change in the incidence of that serotype compared with 1996–1998. The actual incidences of these infections cannot be determined from this graph.
Figure 10. Relative rates of culture-confirmed Salmonella infections with the top Salmonella serotypes in 2015* compared with 1996–1998 rates, by year, FoodNet 1996–2015†
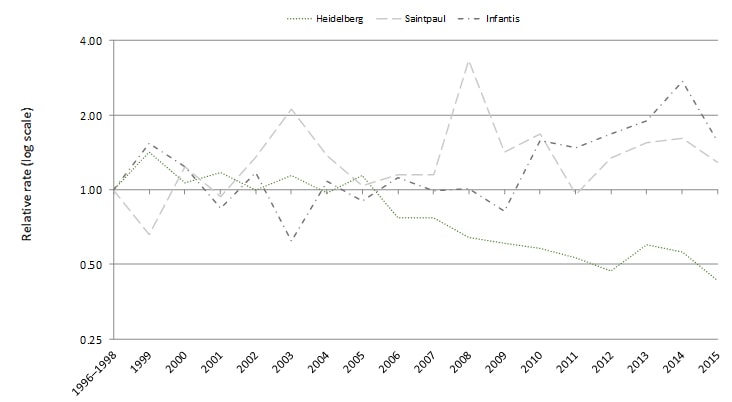
*Data for 2015 are preliminary. Salmonella serotypes included are: Heidelberg, Saintpaul, and Infantis. Changes over time for serotypes Javiana , I 4,[5],12:i:-, and Poona were not evaluated.
†The position of each line indicates the relative change in the incidence of that serotype compared with 1996–1998. The actual incidences of these infections cannot be determined from this graph.
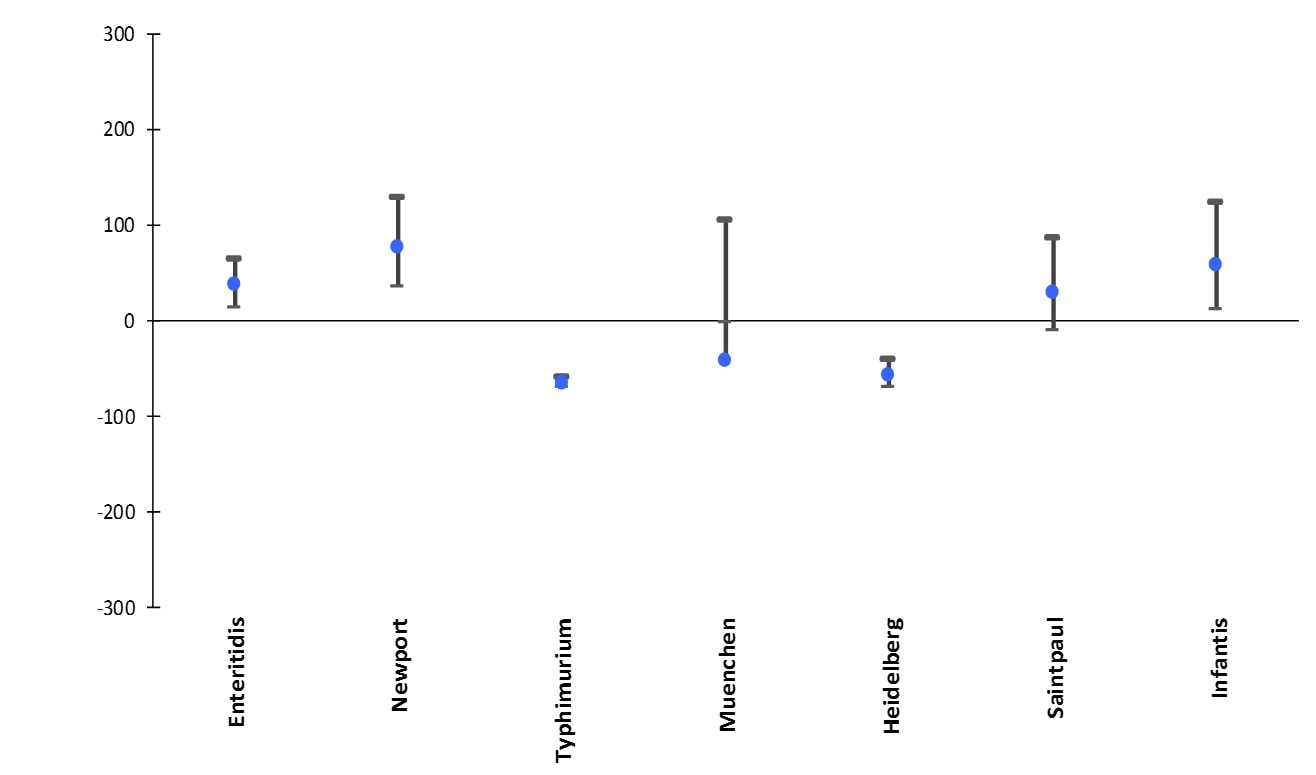
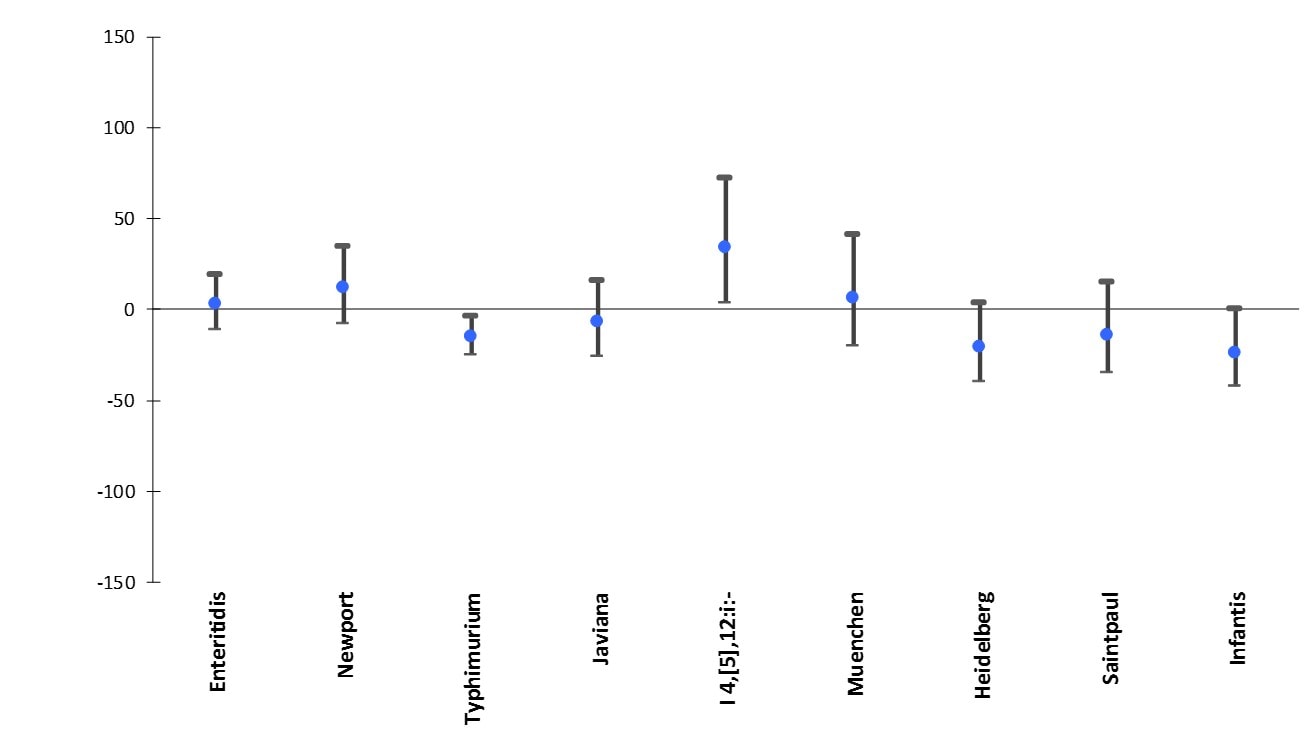
Figure 5. Percentage change in incidence* of culture-confirmed Salmonella infections with the top Salmonella serotypes in 2015† compared with average annual incidence during 2006–2008, by serotype, FoodNet
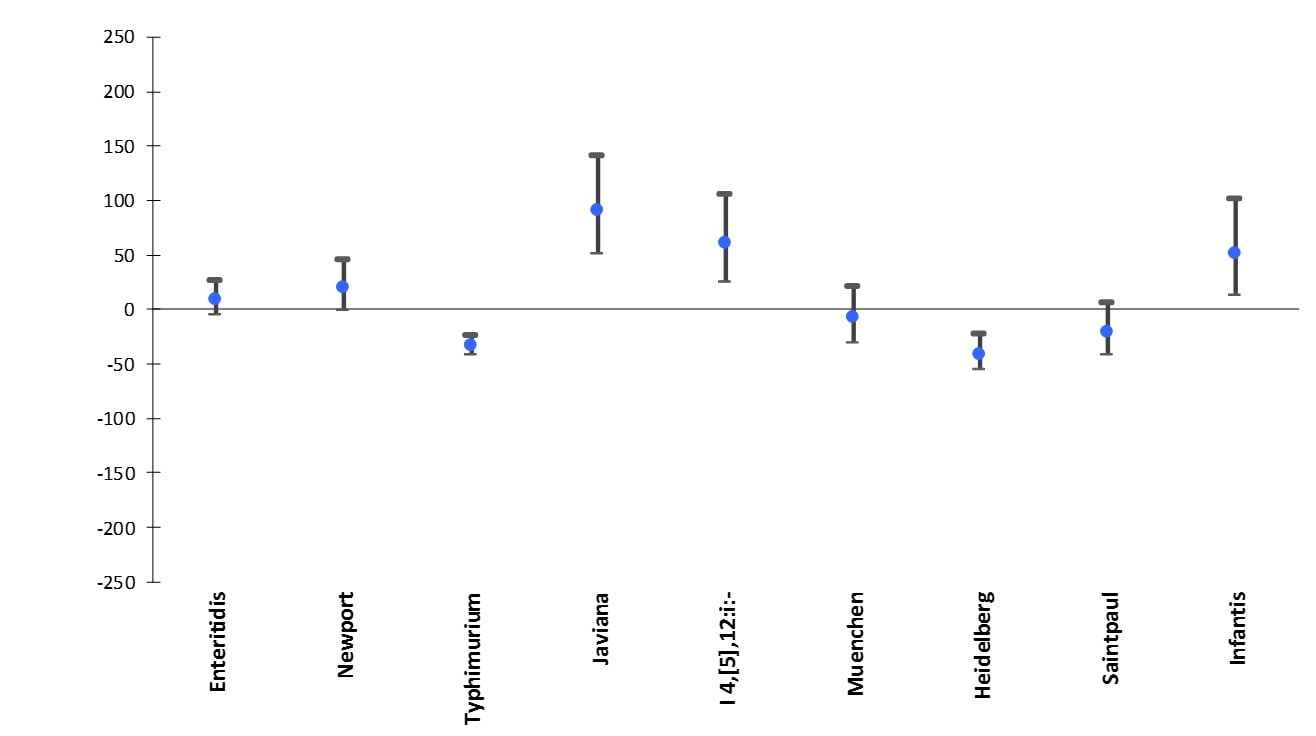
Salmonella serotype
*The estimates and confidence intervals presented indicate the relative change in the incidence of that serotype compared with 2006–2008. The actual incidences of these infections cannot be determined from the graph.
†Data are preliminary. Percentage change was not evaluated for serotype I 13,23:b:-.
§No significant change = 95% confidence interval is both above and below the no change line; significant increase = estimate and entire 95% confidence interval are above the no change line; significant decrease = estimate and entire 95% confidence interval are below the no change line
Figure 6. Relative rates of culture-confirmed Salmonella infections with the top Salmonella serotypes in 2015* compared with 2006–2008 rates, by year, FoodNet 2006–2015†
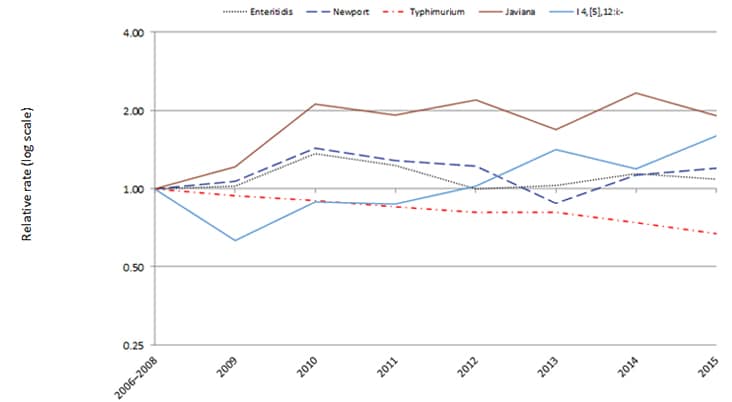
*Data for 2015 are preliminary. Salmonella serotypes included are: Enteritidis, Newport,Typhimurium, Javiana, and I 4,[5],12:i:-. Percentage change was not evaluated for serotype Poona.
†The position of each line indicates the relative change in the incidence of that serotype compared with 2006–2008. The actual incidences of these infections cannot be determined from this graph.
Figure 7. Relative rates of culture-confirmed Salmonella infections with the top Salmonella serotypes in 2015* compared with 2006–2008 rates, by year, FoodNet 2006–2015†
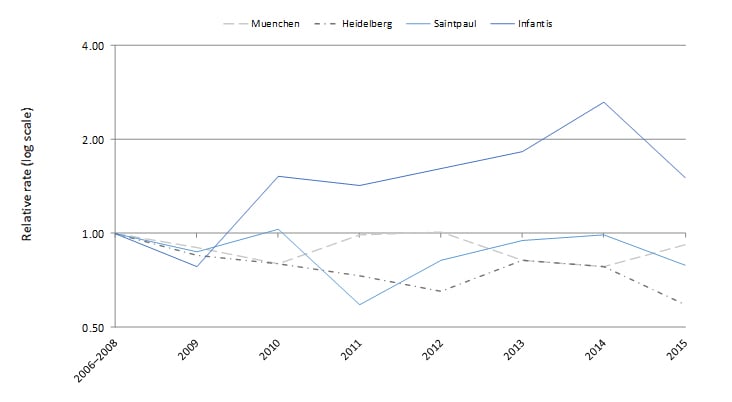
*Data for 2015 are preliminary. Salmonella serotypes included are: Muenchen, Heidelberg, Saintpaul, and Infantis. Percentage change was not evaluated for serotype Poona.
The position of each line indicates the relative change in the incidence of that serotype compared with 2006-2008. The actual incidences of these infections cannot be determined from this graph.
Figure 8. Percentage change in incidence* of culture-confirmed Salmonella infections with the top Salmonella serotypes in 2015† compared with average annual incidence during 2012–2014, by serotype, FoodNet
Salmonella serotype
*The estimates and confidence intervals presented indicate the relative change in the incidence of that serotype compared with 2012–2014. The actual incidences of these infections cannot be determined from the graph.
†Data are preliminary. Percentage change was not evaluated for serotype Poona.
§No significant change = 95% confidence interval is both above and below the no change line; significant increase = estimate and entire 95% confidence interval are above the no change line; significant decrease = estimate and entire 95% confidence interval are below the no change line
| Salmonella serotype | Serotype Rank in 2015 | 1996–1998 comparison period |
2006–2008 comparison period |
2012–2014 comparison period |
|||
|---|---|---|---|---|---|---|---|
| % change† | (95% CI) | % change† | (95% CI) | % change† | (95% CI) | ||
| Enteritidis | 1 | 37%↑ | (14%↑ – 65%↑) | 9%↑ | (5%↓ – 26%↑) | 3%↑ | (11%↓ – 19%↑) |
| Newport | 2 | 76%↑ | (36%↑ – 128%↑) | 20%↑ | (1%↓ – 45%↑) | 12%↑ | (8%↓ – 35%↑) |
| Typhimurium | 3 | 66%↓ | (60%↓ – 70%↓) | 33%↓ | (24%↓ – 41%↓) | 15%↓ | (4%↓ – 25%↓) |
| Javiana | 4 | N/A§ | 91%↑ | (51%↑ – 141%↑) | 7%↓ | (26%↓ – 16%↑) | |
| I 4,[5],12:i:- | 5 | N/A | 60%↑ | (25%↑ – 106%↑) | 34%↑ | (4%↑ – 72%↑) | |
| Poona | 6 | N/A§ | N/A§ | N/A§ | |||
| Muenchen | 7 | 42%↑ | (2%↓ – 105%↑) | 8%↓ | (31%↓ – 21%↑) | 6%↑ | (20%↓ – 41%↑) |
| Heidelberg | 8 | 57%↓ | (6%↑ – 124%↑) | 4%↓ | (28%↓ – 28%↑) | 24%↑ | (7%↓ – 66%↑) |
| Sanitpaul | 9 | 29%↑ | (19%↓ – 77%↑) | 22%↓ | (42%↓ – 5%↑) | 19%↓ | (40%↓ – 10%↑) |
| Infantis | 10 | N/A | N/A | N/A | |||
*Data are preliminary
†Percentage change reported as increase (↑) or as decrease (↓)
§Change over time not evaluated
Download the table: Table 9. Percentage Change in Incidence of Salmonella Infections, 2015 Cdc-excel[XLS – 11KB] Table
Overall change in incidence
| Period of Interest | 1996–1998 comparison period % change* (95% CI) |
2006–2008 comparison period % change* (95% CI) |
2012–2014 comparison period % change* (95% CI) |
|---|---|---|---|
| 2015 | 30%↓ (19%↓ – 38%↓) | 4%↓ (14%↓ – 6%↑) | 7%↓ (17%↓ – 3%↑) |
*Overall change reported as increase (↑) or as decrease (↓). This measure does not allow for assessment of changes in infections of individual pathogens.
†The measure of overall trends in incidence combines data for Campylobacter, Listeria, Salmonella, STEC O157, Vibrio, and Yersinia, the six key bacterial pathogens for which >50% of illnesses are estimated to be transmitted by food. The model weights by incidence of infection for each pathogen.
§Data are preliminary
Download the data: Table 10. Overall Change in Incidence of Infections, 2015 Cdc-excel[XLS – 10KB]
Figure 15. Relative rates of culture-confirmed infections with Campylobacter, STEC* O157, Listeria, Salmonella, Vibrio, and Yersinia, and overall measure of change, compared with 1996–1998 rates, by year, FoodNet 1996–2015†
*Shiga toxin-producing Escherichia coli
†The position of each line indicates the relative change in the incidence of that pathogen compared with 1996–1998. The actual incidences of these infections cannot be determined from this graph. Data for 2015 are preliminary.
§The measure of overall trends in incidence combines data for Campylobacter, Listeria, Salmonella, STEC O157, Vibrio, and Yersinia, the six key bacterial pathogens for which >50% of illnesses are estimated to be transmitted by food. The model weights by incidence of infection for each pathogen.