Contact CDC
- 800-CDC-INFO
888-232-6348 (TTY)
cdcinfo@cdc.gov - Report a Foodborne Illness
Infections with the outbreak strain of E. coli O157:H7 by illness onset
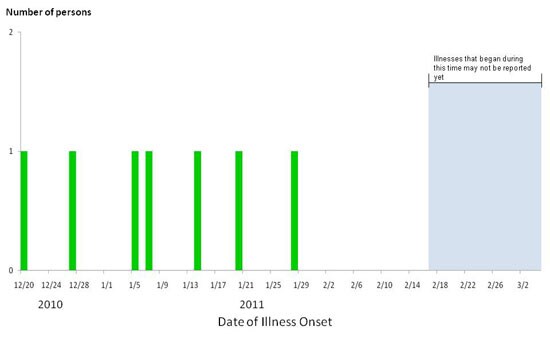
N=7 for whom information was reported as of March 4, 2011
The outbreak can be visually described with a chart showing the number of people who became ill each day. This chart is called an epidemic curve or epi curve. Illnesses that occurred after February 17, 2011, might not be reported yet due to the time it takes between when a person becomes ill and when the illness is reported. This takes an average of 2 to 3 weeks. Please see the Timeline for Reporting of E. coli Cases for more details.
Page last modified: March 5, 2011
Content source: Centers for Disease Control and Prevention
National Center for Emerging and Zoonotic Infectious Diseases (NCEZID)
Division of Foodborne, Waterborne, and Environmental Diseases (DFWED)