Map Details – Lifestyle and Risk Behavior, Adults in Hennepin County, Minnesota
Impact Statement
This map presents population-level data on rates of obesity, smoking, lack of leisure-time activity, and prevalence of eating more than 5 servings of fruits and vegetables per day.
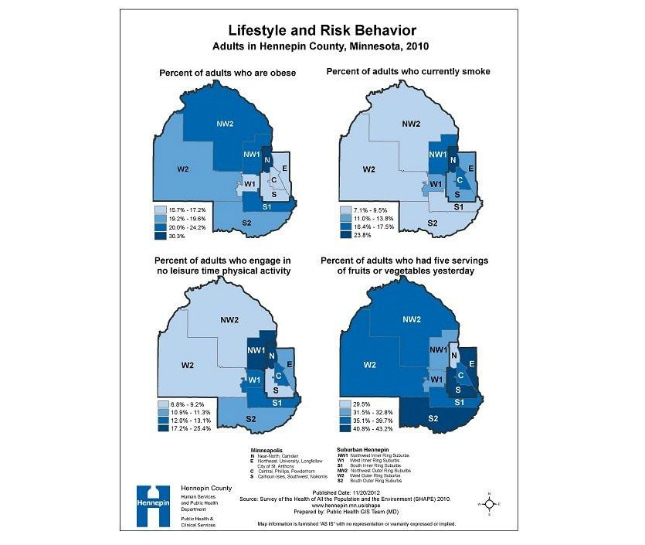
For smoking, rates range from below 10% in suburban Hennepin County regions to 23.8% in North Minneapolis. A similar pattern is found in the rate of lacking leisure time physical activity. The inverse pattern is observed for eating five or more fruits or vegetables per day, with the rate in North Minneapolis is lowest, and the rates among North and West suburban inner ring are second lowest, however, this is expected as this is the one measure that would be considered health-promoting, as opposed to the others which are detrimental.
This map supports the contention that population measures of physical activity, smoking, nutrition, and obesity are correlated at the population level and demonstrate similar geographic distribution. This map shows the geographic variation of four lifestyle and risk behaviors and allows examination in a single map for patterns and correlations. Along with the map on cardiovascular death rates and map on cardiovascular disease and related prevalence it informs local health department management, program staff, and relevant community groups and organizations on the current status and distribution of lifestyle and risk behaviors contributing to the burdens of cardiovascular disease and stroke, and to guide and monitor the focus of public health intervention.
Arc GIS 10
Hennepin County Human Services and Public Health Department, Survey of the Health of All the Population and the Environment (SHAPE), 2010. SHAPE reporting regions were created by HSPHD staff based on former Human Service Council areas and aggregated Minneapolis communities.
SHAPE 2010 Adult Survey is a self-administrated mail survey to randomly selected adults. Rates for risk factors displayed on this map were calculated from the responses provided by 7000 adults age 18 and over who answered the survey. All data represent self-report of the specified condition or behavior. Respondent addresses were geocoded and aggregated within10 sub-county areas. Data was weighted to represent county population and data analyses were performed using STATA to account for complex survey design. The definition of each of the indicators can be found in the technical notes of SHAPE 2010 Adult Data Book, accessible at www.hennepin.us/shape. Geographic areas were defined according to the Hennepin County and the City of Minneapolis planning districts.
Mei Ding, Principal Planning Analyst, Hennepin County Human Services and Public Health Department (HSPHD)
(612) 348-6309
mei.ding@co.hennepin.mn.us
Lifestyle and risk behavior, adults in Hennepin County, Minnesota, 2010 Mei Ding, HSPHD; Jay Meehl, GIS Coordinator, HSPHD, [TODAY’S DATE].