Indicator Definitions – Alcohol
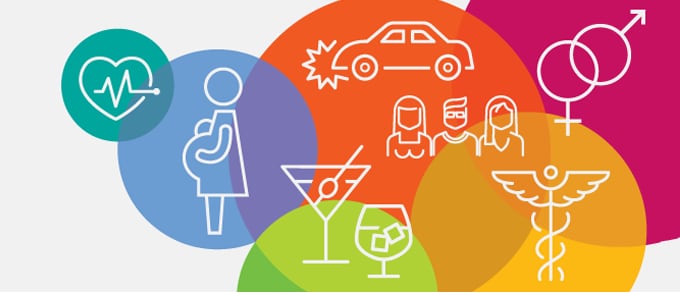
Excessive alcohol use includes binge drinking and heavy drinking, in addition to any alcohol consumption by pregnant women or individuals under the age of 21 and is a leading preventable cause of death in the United States. It is responsible for more than 140,000 deaths in the United States each year and nearly 3.6 million years of potential life lost. In 2010 alone, excessive alcohol use had an economic cost of $249 billion. Binge drinking accounts for more than 40% of these alcohol-related deaths and three quarters of the economic costs. Over 90% of people who drink excessively report binge drinking.
Binge drinking is most common among younger adults aged 18–34 years, adults who have higher household incomes ($75,000 or more), are non-Hispanic White, or live in the Midwest. This pattern of alcohol consumption is nearly twice as common among men than among women, yet overall, one in six US adults binge drinks. Among adults who binge drink, 25% report doing so at least once a week. Evidence-based strategies to prevent excessive drinking and its impact include implementing and enforcing policies to reduce the availability and accessibility of alcohol, increasing the price of alcoholic beverages, and increasing the routine use of alcohol screening and brief intervention.
Visit the CDC’s Alcohol and Public Health website for more information about this topic area.
Definition Details
| Population: | Students in grades 9–12 |
| Numerator: | Students in grades 9–12 who reported consumption of ≥ 1 drink of alcohol during the past 30 days. |
| Denominator: | Students in grades 9–12 who reported having a specific number of drinks of alcohol, including zero, during the past 30 days |
| Measure: | Prevalence (crude) |
| Time Period of Case Definition: | Past 30 days |
| Summary: | In 2021, 23% of high school students reported drinking alcohol on at least one day during the past 30 days.1 The prevalence of current drinking is greater for girls than boys, and increases by grade. On average, excessive alcohol use is responsible for the deaths of approximately 4,000 people under the age of 21 each year in the United States.2 Underage drinking cost the U.S. $24 billion in 2010.3 Delaying the age when drinking is initiated until age 21 years or later substantially reduces the risk of experiencing alcohol-related problems.4 Youth who drink alcohol are more likely to experience increased risk of injuries, violence, other substance use, other acute and chronic health effects, and reduced academic performance.5 |
| Notes: | The indicator does not convey the frequency of drinking or the specific amount of alcohol consumed. |
| Data Source: | Youth Risk Behavior Surveillance System (YRBSS). |
| Related CDI Topic Area: | Student Health |
| Reference 1: | National Center for Chronic Disease Prevention and Health Promotion. 1991-2021 High School Youth Risk Behavior Survey Data. Centers for Disease Control and Prevention. Accessed May 1, 2023. https://nccd.cdc.gov/Youthonline |
| Reference 2: | National Center for Chronic Disease Prevention and Health Promotion. 1991-2021 High School Youth Risk Behavior Survey Data. Centers for Disease Control and Prevention. Accessed May 1, 2023. https://nccd.cdc.gov/Youthonline |
| Reference 3: | Sacks JJ, Gonzales KR, Bouchery EE, Tomedi LE, Brewer RD. 2010 national and state costs of excessive alcohol consumption. Am J Prev Med.2015;49(5):E73–E79. doi:10.1016/j.amepre.2015.05.031 |
| Reference 4: | National Center for Chronic Disease Prevention and Health Promotion. Age 21 Minimum Legal Drinking Age. Centers for Disease Control and Prevention. Updated December 7, 2022. Accessed April 3, 2023. https://www.cdc.gov/alcohol/fact-sheets/minimum-legal-drinking-age.htm |
| Reference 5: | National Center for Chronic Disease Prevention and Health Promotion. Underage Drinking. Centers for Disease Control and Prevention. Updated November 14, 2022. Accessed April 3, 2023. https://www.cdc.gov/alcohol/fact-sheets/underage-drinking.htm |
| Population: | Women who have had a recent live birth |
| Numerator: | Number of women who reported they used alcohol during their most recent pregnancy resulting in a live birth. |
| Denominator: | Number of women who reported that they did or did not use alcohol during their most recent pregnancy resulting in a live birth. |
| Measure: | Prevalence (crude) |
| Time Period of Case Definition: | During the pregnancy resulting in the most recent live birth |
| Summary: | Approximately one in seven pregnant adults drank alcohol in the past 30 days.1 Alcohol use during pregnancy is associated with many adverse pregnancy and birth outcomes, such as fetal alcohol spectrum disorders, miscarriage, stillbirth, preterm delivery, and sudden infant death syndrome.2 Clinical intervention, such as routine alcohol use screening during prenatal care3, and patient counseling4 may reduce use and subsequently prevent adverse outcomes.3,4 |
| Notes: | This indicator results from a new question in a new phase of the PRAMS survey, Phase 9. Phase 9 PRAMS data will not be available until 2024 (Phase 9 will begin with 2023 births). |
| Data Source: | Pregnancy Risk Assessment Monitoring System (PRAMS) |
| Related Objectives or Recommendations: | Healthy People 2030 objective: MICH-09. Increase abstinence from alcohol among pregnant women |
| Related CDI Topic Area: | Maternal Health |
| Reference 1: | Gosdin LK, Deputy NP, Kim SY, Dang EP, Denny CH. Alcohol consumption and binge drinking during pregnancy among adults aged 18–49 years — United States, 2018–2020. MMWR Morb Mortal Wkly Rep. 2022;71(1):10–13. doi:10.15585/mmwr.mm7101a2 |
| Reference 2: | Bailey BA, Sokol RJ. Prenatal alcohol exposure and miscarriage, stillbirth, preterm delivery, and sudden infant death syndrome. Alcohol Res Health. 2011;34(1):86–91. |
| Reference 3: | American College of Obstetricians and Gynecologists. Committee opinion no. 633: alcohol abuse and other substance use disorders ethical issues in obstetric and gynecologic practice. Obstet Gynecol. 2015;125(6):1529–1537. doi:10.1097/01.AOG.0000466371.86393.9b |
| Reference 4: | US Preventive Services Task Force, Curry SJ, Krist AH, et al. Screening and behavioral counseling interventions to reduce unhealthy alcohol use in adolescents and adults: US Preventive Services Task Force recommendation statement. JAMA. 2018;320(18):1899–1909. doi:10.1001/jama.2018.16789 |
| Alcohol use during pregnancy among women with a recent live birth |
| Population: | Women who have had a recent live birth and use alcohol |
| Numerator: | Number of women who reported that they had 4 or more alcoholic drinks in a 2-hour time span during their most recent pregnancy resulting in a live birth. |
| Denominator: | Number of women who reported that they used alcohol during their most recent pregnancy resulting in a live birth. |
| Measure: | Prevalence (crude) |
| Time Period of Case Definition: | During the pregnancy resulting in the most recent live birth |
| Summary: | In findings from 2018–2020, approximately 40% of pregnant adults who reported alcohol use in the past 30 days also reported binge drinking.1 Prevalence of binge drinking during pregnancy increased slightly from 2011 to 2020.2 Alcohol use during pregnancy is associated with many adverse pregnancy and birth outcomes,3 and binge drinking may be particularly harmful to fetal development compared to other drinking patterns.4 Routine alcohol use screening and behavioral counseling may reduce use and subsequently prevent adverse outcomes.5,6 |
| Notes: | This indicator results from a new question in a new phase of the PRAMS survey, Phase 9. Phase 9 PRAMS data will not be available until 2024 (Phase 9 will begin with 2023 births). |
| Data Source: | Pregnancy Risk Assessment Monitoring System (PRAMS) |
| Related Objectives or Recommendations: | Healthy People 2030 objective: MICH-09. Increase abstinence from alcohol among pregnant women |
| Related CDI Topic Area: | Maternal Health |
| Reference 1: | Gosdin LK, Deputy NP, Kim SY, Dang EP, Denny CH. Alcohol consumption and binge drinking during pregnancy among adults aged 18–49 years — United States, 2018–2020. MMWR Morb Mortal Wkly Rep. 2022;71(1):10–13. doi:10.15585/mmwr.mm7101a2 |
| Reference 2: | Denny CH, Acero CS, Terplan M, Kim SY. Trends in alcohol use among pregnant women in the U.S., 2011–2018. Am J Prev Med 2020;59:768–9. doi:10.1016/j.amepre.2020.05.017 |
| Reference 3: | Bailey BA, Sokol RJ. Prenatal alcohol exposure and miscarriage, stillbirth, preterm delivery, and sudden infant death syndrome. Alcohol Res Health. 2011;34(1):86–91. |
| Reference 4: | Maier SE, West JR. Drinking patterns and alcohol-related birth defects. Alcohol Res Health. 2001;25(3):168–174. |
| Reference 5: | American College of Obstetricians and Gynecologists. Committee opinion no. 633: alcohol abuse and other substance use disorders ethical issues in obstetric and gynecologic practice. Obstet Gynecol. 2015;125(6):1529–1537. doi:10.1097/01.AOG.0000466371.86393.9b |
| Reference 6: | US Preventive Services Task Force. Screening and behavioral counseling interventions to reduce unhealthy alcohol use in adolescents and adults: US Preventive Services Task Force recommendation statement. JAMA. 2018;320(18):1899–1909. doi:10.1001/jama.2018.16789 |
| Population: | All adults |
| Numerator: | Number of binge drinking (≥ 5 drinks for men or ≥ 4 drinks for women on ≥ 1 occasion) episodes during the previous 30 days |
| Denominator: | Adults who report having ≥ 5 drinks (men) or ≥ 4 drinks (women) on ≥ 1 occasion during the previous 30 days |
| Measure: | Median and 75th percentile |
| Time Period of Case Definition: | Past 30 days |
| Summary: | In 2018, among adults who reported binge drinking, the median frequency was 1.7 binge drinking occasions during the past 30 days.1 However, frequent binge drinking is common, with 25% of adults who binge drink (i.e., the 75th percentile) reporting doing so at least 4 times during the past 30 days. Binge drinking frequency was significantly higher among men (median: 1.9 occasions; 75th percentile: 4.6 occasions) than among women (median: 1.4 occasions; 75th percentile: 3.3 occasions) and decreased with education level.1 Adults in the lowest income level binge drank more frequently than did adults in the highest income level. The median and 75th percentile of binge drinking frequency varies by state.1 Binge drinking is associated with many health problems including unintentional injuries, violence, sexually transmitted diseases, poor pregnancy outcomes, fetal alcohol spectrum disorders, and chronic diseases (e.g., high blood pressure, cancer).2 The risk of these outcomes generally increases with the frequency of binge drinking. Assessing the frequency of binge drinking may be useful for planning and evaluating alcohol policies, such as those recommended in the Community Guide for preventing excessive alcohol use.3 |
| Notes: | The median and 75th percentiles for binge drinking frequency might not capture changes in binge drinking frequency among adults at the lower or upper ends of the distribution. The 75th percentile of binge drinking frequency is helpful to characterize the binge drinking frequency distribution, as it reflects the frequency at which 25% of the adults who binge drink engage in this risk behavior. |
| Data Source: | Behavioral Risk Factor Surveillance System (BRFSS) |
| Related Objectives or Recommendations: | Healthy People 2030 objective: SU-10. Reduce the proportion of people aged 21 years and over who engaged in binge drinking in the past month |
| Related CDI Topic Area: | None |
| Reference 1: | Bohm MK, Liu Y, Esser MB, et al. Binge drinking among adults, by select characteristics and state — United States, 2018. MMWR Morb Mortal Wkly Rep. 2021;70(41):1441–1446. doi:10.15585/mmwr.mm7041a2 |
| Reference 2: | National Center for Chronic Disease Prevention and Health Promotion. Binge Drinking. Centers for Disease Control and Prevention. Updated November 14, 2022. Accessed April 3, 2023. https://www.cdc.gov/alcohol/fact-sheets/binge-drinking.htm |
| Reference 3: | Community Preventive Services Task Force. Excessive Alcohol Consumption. The Community Guide. Accessed April 3, 2023. https://www.thecommunityguide.org/topics/excessive-alcohol-consumption.html |
| Population: | All adults |
| Numerator: | Largest number of drinks consumed on an occasion in the previous 30 days among adults who binge drink. |
| Denominator: | Adults who report having ≥ 5 drinks (men) or ≥ 4 drinks (women) on ≥ 1 occasion during the previous 30 days |
| Measure: | Median and 75th percentile |
| Time Period of Case Definition: | Past 30 days |
| Summary: | In 2018, among adults who reported binge drinking, the median binge drinking intensity was 5.5 drinks (5.9 drinks among men and 4.5 drinks among women).1 Among adults who binge drink, 25% of them (i.e., the 75th percentile) drank at least 7.7 drinks per binge drinking occasion (at least 9.3 drinks among men and at least 5.6 drinks among women).1 Median binge drinking intensity was highest among adults aged 18–24 years and decreased with age.1 Binge drinking is associated with many health problems including unintentional injuries, violence, sexually transmitted diseases, poor pregnancy outcomes, fetal alcohol spectrum disorders, and chronic diseases (e.g., high blood pressure, cancer).2 The risk of these outcomes generally increases with the intensity of binge drinking. Assessing the intensity of binge drinking may be useful for planning and evaluating alcohol policies, such as those recommended in the Community Guide for preventing excessive alcohol use.3 |
| Notes: | The median binge drinking intensity might not capture changes in binge drinking intensity among adults at the lower and upper ends of the distribution. The 75th percentile of binge drinking intensity is helpful to characterize the binge drinking intensity distribution, as it reflects the number of drinks consumed among the 25% of adults who binge drink and consume higher amounts of alcohol during their binge drinking occasion, which increases the risk for adverse outcomes. |
| Data Source: | Behavioral Risk Factor Surveillance System (BRFSS) |
| Related Objectives or Recommendations: | Healthy People 2030 objective: SU-10. Reduce the proportion of people aged 21 years and over who engaged in binge drinking in the past month |
| Related CDI Topic Area: | None |
| Reference 1: | Bohm MK, Liu Y, Esser MB, et al. Binge drinking among adults, by select characteristics and state — United States, 2018. MMWR Morb Mortal Wkly Rep. 2021;70(41):1441–1446. doi:10.15585/mmwr.mm7041a2 |
| Reference 2: | National Center for Chronic Disease Prevention and Health Promotion. Binge Drinking. Centers for Disease Control and Prevention. Updated November 14, 2022. Accessed April 3, 2023. https://www.cdc.gov/alcohol/fact-sheets/binge-drinking.htm |
| Reference 3: | Community Preventive Services Task Force. Excessive Alcohol Consumption. The Community Guide. Accessed April 3, 2023. https://www.thecommunityguide.org/topics/excessive-alcohol-consumption.html |
| Population: | All adults |
| Numerator: | Adults who report having ≥ 5 drinks (men) or ≥ 4 drinks (women) on ≥ 1 occasion during the previous 30 days |
| Denominator: | Adults who report having a specific number, including zero, of drinks on one occasion during the previous 30 days |
| Measure: | Prevalence (crude and age-adjusted) |
| Time Period of Case Definition: | Past 30 days |
| Summary: | In 2018, the age-standardized binge drinking prevalence among adults was 17.4%.1 Binge drinking prevalence was significantly higher among men (22.5%) than among women (12.6%) and was highest among non-Hispanic White adults (19.7%), those with annual household incomes of $75,000 or more (21.4%), those who were never married (18.5%) or were divorced/separated/widowed (19.4%), and veterans (20.9%).1 Binge drinking prevalence was significantly higher among adults with a college degree (18.9%) than among adults with less than a high school diploma (14.9%).1 States with higher binge drinking prevalence estimates clustered in the Midwest and Northeast. Binge drinking is associated with many health problems including unintentional injuries, violence, sexually transmitted diseases, poor pregnancy outcomes, fetal alcohol spectrum disorders, and chronic diseases (e.g., high blood pressure, cancer).2 Evidence-based alcohol policies, such as those recommended in the Community Guide, can be effective for preventing excessive alcohol use, including binge drinking.3 |
| Notes: | The indicator does not convey the frequency or intensity of binge drinking or the specific amount of alcohol consumed, both of which affect the risks of alcohol-related harms. |
| Data Source: | Behavioral Risk Factor Surveillance System (BRFSS) |
| Related Objectives or Recommendations: | Healthy People 2030 objective: SU-10. Reduce the proportion of people aged 21 years and over who engaged in binge drinking in the past month |
| Related CDI Topic Area: | None |
| Reference 1: | Bohm MK, Liu Y, Esser MB, et al. Binge drinking among adults, by select characteristics and state — United States, 2018. MMWR Morb Mortal Wkly Rep. 2021;70(41):1441–1446. doi:10.15585/mmwr.mm7041a2 |
| Reference 2: | National Center for Chronic Disease Prevention and Health Promotion. Binge Drinking. Centers for Disease Control and Prevention. Updated November 14, 2022. Accessed April 3, 2023. https://www.cdc.gov/alcohol/fact-sheets/binge-drinking.htm |
| Reference 3: | Community Preventive Services Task Force. Excessive Alcohol Consumption. The Community Guide. Accessed April 3, 2023. https://www.thecommunityguide.org/topics/excessive-alcohol-consumption.html |
| Population: | Students in grades 9–12 |
| Numerator: | Students in grades 9–12 who report having ≥ 5 drinks (male) students or ≥ 4 drinks (female students) of alcohol within a couple of hours on ≥ 1 day during the past 30 days |
| Denominator: | Students in grades 9–12 who report having a specific number, including zero, of drinks of alcohol within a couple of hours on ≥ 1 day during the past 30 days |
| Measure: | Prevalence (crude) |
| Time Period of Case Definition: | Past 30 days |
| Summary: | In 2021, 10.5% of high school students reported binge drinking on at least one day during the past 30 days.1 The prevalence of current binge drinking is greater for female students than male students , and increases by grade. It is most common among high school students who are White.1 On average, excessive alcohol use is responsible for the deaths of approximately 4,000 people under the age of 21 each year in the United States.2 Underage drinking cost the U.S. $24 billion in 2010.3 Delaying the age when drinking is initiated until age 21 years or later substantially reduces the risk of experiencing alcohol-related problems.4 Youth who drink alcohol are more likely to experience increased risk of injuries, violence, other substance use, other acute and chronic health effects, and reduced academic performance.5 |
| Notes: | The indicator does not convey the frequency of binge drinking or the specific amount of alcohol consumed. This indicator is available every other year. |
| Data Source: | Youth Risk Behavior Surveillance System (YRBSS) |
| Related Objectives or Recommendations: | Healthy People 2030 objective: SU-09. Reduce the proportion of people under 21 years who engaged in binge drinking in the past month |
| Related CDI Topic Area: | Student Health |
| Reference 1: | National Center for Chronic Disease Prevention and Health Promotion. 1991-2021 High School Youth Risk Behavior Survey Data. Centers for Disease Control and Prevention. Accessed April 3, 2023. https://nccd.cdc.gov/Youthonline |
| Reference 2: | National Center for Chronic Disease Prevention and Health Promotion. Alcohol-Related Disease Impact (ARDI) application. Centers for Disease Control and Prevention. Accessed April 3, 2023. www.cdc.gov/ARDI |
| Reference 3: | Sacks JJ, Gonzales KR, Bouchery EE, Tomedi LE, Brewer RD. 2010 national and state costs of excessive alcohol consumption. Am J Prev Med. 2015;49(5):E73–E79. doi:10.1016/j.amepre.2015.05.031 |
| Reference 4: | National Center for Chronic Disease Prevention and Health Promotion. Age 21 Minimum Legal Drinking Age. Centers for Disease Control and Prevention. Updated December 7, 2022. Accessed April 3, 2023. https://www.cdc.gov/alcohol/fact-sheets/minimum-legal-drinking-age.htm |
| Reference 5: | National Center for Chronic Disease Prevention and Health Promotion. Underage Drinking. Centers for Disease Control and Prevention. Updated December 7, 2022. Accessed April 3, 2023. https://www.cdc.gov/alcohol/fact-sheets/underage-drinking.htm |
| Population: | People aged 14 years and older |
| Numerator: | Gallons of pure alcohol consumed during a calendar year. |
| Denominator: | Mid-year resident population aged 14 and older for the same calendar year. |
| Measure: | Annual alcohol consumption per capita |
| Time Period of Case Definition: | Calendar year |
| Summary: | From 1995 to 2020, per capita alcohol consumption increased 14% (from 2.15 to 2.45 gallons), with the largest single year increase from 2019 (2.38 gallons) to 2020 (2.45 gallons), representing a 2.9% single year increase.1 There is strong scientific evidence supporting the usefulness of per capita alcohol consumption as a proxy measure of excessive alcohol use.2 This indicator provides a more complete accounting of alcohol consumption in states than self-reported consumption indicators.4 A study using 2011–2015 Behavioral Risk Factor Surveillance System data found that self-reported alcohol use captures only 31% of the alcohol purchased in states, based on tax and shipment data used in this per capita alcohol consumption indicator.3 This indicator could serve as a broad environmental indicator of changes in factors that influence excessive drinking, such as price, retail availability and accessibility, and the regulatory environment. |
| Notes: | This indicator does not support local analyses of alcohol consumption (e.g., by county or city), or the analysis of alcohol consumption among specific demographic groups (e.g., age, sex, race/ethnicity). |
| Data Source: | Alcohol Epidemiologic Data System (AEDS) |
| Related Objectives or Recommendations: | None |
| Related CDI Topic Area: | None |
| Reference 1: | Slater ME, Alpert HR. Surveillance Report #119: Apparent Per Capita Alcohol Consumption: National, State, and Regional Trends, 1977–2020. National Institute on Alcohol Abuse and Alcoholism, Division of Epidemiology and Prevention Research, Alcohol Epidemiologic Data System; 2022. https://pubs.niaaa.nih.gov/publications/surveillance119/CONS20.htm |
| Reference 2: | Elder RW, Lawrence B, Ferguson A, et al. The effectiveness of tax policy interventions for reducing excessive alcohol consumption and related harms. Am J Prev Med. 2010;38(2):P217–229. doi:10.1016/j.amepre.2009.11.005 |
| Reference 3: | Esser MB, Sherk A, Subbaraman MS, et al. Improving estimates of alcohol-attributable deaths in the United States: impact of adjusting for the underreporting of alcohol consumption. J Stud Alcohol Drugs. 2022;83(1):134–144. doi:10.15288/jsad.2022.83.134 |
| Population: | All people |
| Numerator: | Deaths with International Classification of Diseases (ICD)-10 codes K70 or K73–K74 as the underlying cause of death among residents during a calendar year. |
| Denominator: | Midyear resident population for the same calendar year. |
| Measure: | Mortality rate (crude and age-adjusted); number [cases per 100,000] |
| Time Period of Case Definition: | Calendar year |
| Summary: | In 2018, 4.5 million adults had a liver disease diagnosis.1 In 2021, more than 56,000 people died from chronic liver disease.1 In 2021, it was also the 7th leading cause of death among adults aged 25–44 years and the 5th leading cause of death among people aged 45–64 years.2 Excessive alcohol consumption is a leading risk factor for chronic liver disease. This indicator could serve as an outcome measure to assess changes in factors that influence excessive drinking, such as price, retail availability and accessibility, and the regulatory environment. |
| Notes: | Because alcohol-related disease can have a long latency, changes in behavior or clinical practice affecting population mortality might not be apparent for years. Not all chronic liver disease deaths are attributable to alcohol use. However, in 2019, about 50% of cirrhosis deaths in the United States were attributable to alcohol use.3 |
| Data Source: | National Vital Statistics System (NVSS) |
| Related Objectives or Recommendations: | Healthy People 2030 objective: SU-02. Reduce cirrhosis deaths |
| Related CDI Topic Area: | None |
| Reference 1: | National Center for Health Statistics. Chronic Liver Disease and Cirrhosis. . Centers for Disease Control and Prevention. Updated January 17, 2023. Accessed April 3, 2023. https://www.cdc.gov/nchs/fastats/liver-disease.htm |
| Reference 2: | Centers for Disease Control and Prevention. CDC WONDER. Underlying Cause of Death, 2018-2021. Accessed May 1, 2023. https://wonder.cdc.gov/ucd-icd10-expanded.html |
