Stuck in Neutral: Stalled Progress in Statewide Comprehensive Smoke-Free Laws and Cigarette Excise Taxes, United States, 2000–2014
ORIGINAL RESEARCH — Volume 13 — June 16, 2016
Carissa Baker Holmes, MPH; Brian A. King, PhD, MPH; Stephen D. Babb, MPH
Suggested citation for this article: Holmes CB, King BA, Babb SD. Stuck in Neutral: Stalled Progress in Statewide Comprehensive Smoke-Free Laws and Cigarette Excise Taxes, United States, 2000–2014. Prev Chronic Dis 2016;13:150409. DOI: http://dx.doi.org/10.5888/pcd13.150409external icon.
PEER REVIEWED
Abstract
Introduction
Increasing tobacco excise taxes and implementing comprehensive smoke-free laws are two of the most effective population-level strategies to reduce tobacco use, prevent tobacco use initiation, and protect nonsmokers from secondhand smoke. We examined state laws related to smoke-free buildings and to cigarette excise taxes from 2000 through 2014 to see how implementation of these laws from 2000 through 2009 differs from implementation in more recent years (2010–2014).
Methods
We used legislative data from LexisNexis, an online legal research database, to examine changes in statewide smoke-free laws and cigarette excise taxes in effect from January 1, 2000, through December 31, 2014. A comprehensive smoke-free law was defined as a statewide law prohibiting smoking in all indoor areas of private work sites, restaurants, and bars.
Results
From 2000 through 2009, 21 states and the District of Columbia implemented comprehensive smoke-free laws prohibiting smoking in work sites, restaurants, and bars. In 2010, 4 states implemented comprehensive smoke-free laws. The last state to implement a comprehensive smoke-free law was North Dakota in 2012, bringing the total number to 26 states and the District of Columbia. From 2000 through 2009, 46 states and the District of Columbia implemented laws increasing their cigarette excise tax, which increased the national average state excise tax rate by $0.92. However, from 2010 through 2014, only 14 states and the District of Columbia increased their excise tax, which increased the national average state excise tax rate by $0.20.
Conclusion
The recent stall in progress in enacting and implementing statewide comprehensive smoke-free laws and increasing cigarette excise taxes may undermine tobacco prevention and control efforts in the United States, undercutting efforts to reduce tobacco use, exposure to secondhand smoke, health disparities, and tobacco-related illness and death.
Introduction
Tobacco use causes more than 480,000 premature deaths in the United States annually (1). Smoke-free policies and tobacco taxes reduce tobacco use, increase tobacco use cessation, reduce initiation of tobacco use, and reduce tobacco-related illness and death, including deaths related to exposure to secondhand smoke (1,2). Both population-level interventions contributed, in part, to the major public health achievement of averting 8 million premature smoking-attributable deaths from 1964 through 2014 (3).
The United States has made substantial progress in implementing comprehensive smoke-free laws and cigarette excise taxes (1). Since 2000, the number of states with comprehensive smoke-free laws increased from 0 to 26 states and the District of Columbia (4). Furthermore, cigarette prices increased significantly over the past decade, driven in part by numerous state and local tax increases and a 2009 federal tax increase (1). As of December 31, 2014, the average state cigarette excise tax rate was at an all-time high of $1.54 per pack (5).
Previous studies examined state-specific trends for comprehensive smoke-free laws from 2000 to 2010 and laws that increase cigarette excise tax rates from 2010 to 2011; however, more recent trends have not been assessed (4,6). The objective of this study was to examine state-specific data for both types of laws (smoke-free laws and cigarette excise tax laws) from 2000 through 2014, to determine how implementation of these laws from 2000 through 2009 differs from implementation in more recent years (2010–2014).
Methods
Data were obtained from the Centers for Disease Control and Prevention’s (CDC’s) State Tobacco Activities Tracking and Evaluation (STATE) system, which contains tobacco-related epidemiologic and economic data and information on state tobacco-related legislation for all 50 US states and the District of Columbia (7). Data are collected quarterly from LexisNexis (RELX Group), an online legal research database, and are then analyzed, coded, and entered into the STATE system (7).
We examined changes in comprehensive state smoke-free laws and state cigarette excise tax laws in effect from January 1, 2000, through December 31, 2014. A law was considered in effect in a specific year if the law was implemented during that year (determined by the date the law took effect, rather than the date the law was enacted). CDC defines a state smoke-free law as comprehensive if it prohibits smoking in private work sites, restaurants, and bars (1,8). To be considered comprehensive, a law must prohibit smoking in all indoor areas in these settings with no exceptions. Some states have laws in effect with less stringent smoking restrictions, such as laws establishing designated smoking areas or permitting smoking in separately ventilated areas. Other states have laws in effect that prohibit smoking at all times in 1 or 2 of these settings, but not all 3; such laws were not considered comprehensive for this assessment, because evidence indicates that they are not as effective as comprehensive smoke-free laws in eliminating population-level exposure to secondhand smoke (1,8). We examined state cigarette excise tax laws in terms of the price per pack; we did not address increases in the tax on other tobacco products (eg, cigars, smokeless tobacco). We used US Census Bureau definitions to categorize states into 4 regions: Northeast, South, Midwest, and West (9).
We assessed changes in state comprehensive smoke-free laws and cigarette excise taxes in effect that occurred from 2000 through 2014, and also compared changes in laws from 2000 through 2009 with changes in laws from 2010 through 2014. We examined the number of laws in effect, changes in state excise tax rates per pack of cigarettes, and the change in the average state excise tax rate per pack over time.
Results
In 2002, Delaware became the first state to implement a comprehensive smoke-free law. In the following years, several states followed suit, especially during the latter half of the past decade (2005 to 2009). By December 31, 2009, 21 states and the District of Columbia had comprehensive smoke-free laws in effect ( Table 1); of these 21 states, 6 had laws go into effect in 2009 (Figure 1).
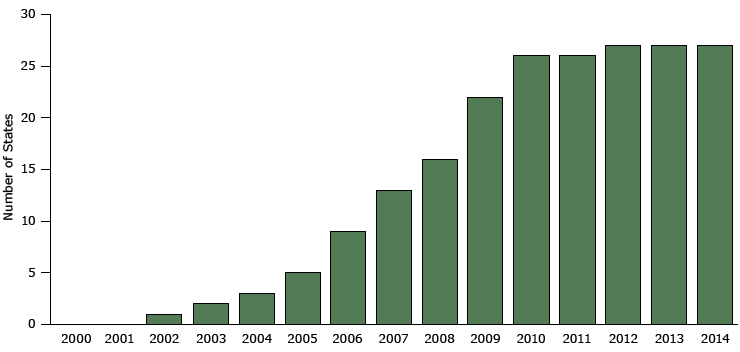
Figure 1. Number of states with comprehensive smoke free laws, 2000–2014. A comprehensive law is one that prohibits smoking at all times in all indoor areas of private work sites, restaurants, and bars. Data are for the year the law went into effect rather than the year it was enacted. Source: Centers for Disease Control and Prevention’s State Tobacco Activities Tracking and Evaluation System. [A tabular description of this figure is also available.]
By December 31, 2009, 10 states had laws in effect that prohibited smoking in all indoor areas of work sites, restaurants, or bars but did not prohibit all smoking in all 3 areas. From 2000 through 2009, 19 states made no changes to their smoking laws.
In 2010, comprehensive smoke-free laws went into effect in 4 additional states (Kansas, Michigan, South Dakota, and Wisconsin). No new comprehensive state smoke-free laws went into effect in 2011, and in 2012 a comprehensive smoke-free law went into effect in North Dakota. From 2012 through 2014, no state passed a comprehensive smoke-free law (Figure 1).
As of December 31, 2014, 24 states had no comprehensive smoke-free laws in place; 11 states had not changed their smoking laws since before 2000 and had no laws partially or totally restricting smoking.
As of December 31, 2014, statewide comprehensive smoke-free laws, by US Census region, ranged from 18% of the 17 states in the South region to 83% in the Midwest region ( Table 2). From 2000 through 2009, 6 southern states (Arkansas, Delaware, Florida, Louisiana, Maryland, and Tennessee) and the District of Columbia had laws go into effect that created more stringent smoking restrictions in public places (Table 1). The most stringent laws were comprehensive smoke-free laws that went into effect in Delaware (2002), the District of Columbia (2007) and Maryland (2008). Less stringent restrictions also went into effect, prohibiting smoking in at least one location (work sites, restaurants, or bars) in 4 southern states (Arkansas, Florida, Louisiana, and Tennessee). Between 2010 and 2014, North Carolina was the only southern state to change its statewide smoking prohibitions, prohibiting smoking in 2 locations (restaurants and bars) in 2010. No southern state has had a comprehensive statewide smoke-free law go into effect since 2008.
From 2000 through 2009, the average state cigarette excise tax increased by $0.92 per pack, from $0.42 in 2000 to $1.34 in 2009 (Figure 2). During this period, 46 states and the District of Columbia increased their state excise tax rates at least once, and 102 laws went into effect that increased excise taxes (Table 1). Only 4 states — California, Missouri, North Dakota, and South Carolina — did not change their excise tax rate during this period. The largest number of state cigarette excise tax increases (in 21 states) occurred in 2002. These 21 laws produced the largest annual increase in the national average state excise tax rate — $0.18 (Figure 2).
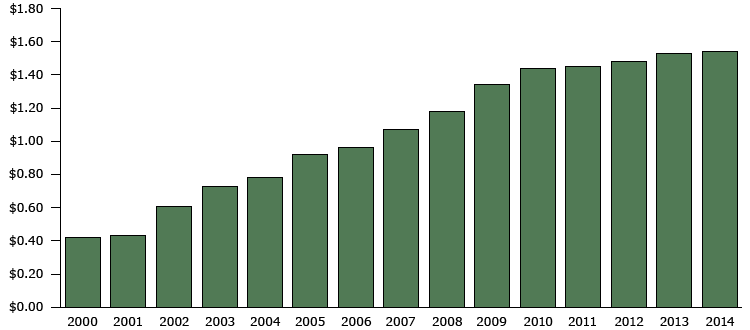
Figure 2. State cigarette excise tax laws and the national average state cigarette excise tax rate per pack in effect, by year, 2000–2014. Source: CDC’s State Tobacco Activities Tracking and Evaluation System. [A tabular description of this figure is also available.]
From 2000 through 2009, 23 states and the District of Columbia increased their cigarette excise tax rates by $1.00 or more (Table 1). By December 31, 2009, 19 states and the District of Columbia had cigarette excise tax rates of $1.50 or more (Table 1). Furthermore, 2 states increased their cigarette excise taxes by over $2.00 during the same period: Connecticut implemented 4 increases totaling $2.50, and Rhode Island implemented 5 increases totaling $2.75.
From January 1, 2010, through December 31, 2014, the national average cigarette excise tax increased by $0.20 per pack, from $1.34 to $1.54 (Figure 2). During this period, 14 states and the District of Columbia increased their state excise tax rates at least once. Changes in the average excise tax rate during this period peaked in 2010, when 6 states raised their cigarette excise tax (Table 1). State legislative activity in this area slowed after 2010; for example, only 3 states implemented increases in 2014. One of these states (Oregon) increased its excise tax by $0.13, reversing a 2004 $0.10 decrease in the excise tax per pack, thus effectively raising the excise tax by only $0.03 per pack.
Between 2010 and 2014, only 6 states increased their excise tax rate by $1.00 or more; 2 of those states, Minnesota and New York, increased their excise tax rates by $1.60. Eleven states did not increase their cigarette excise tax rates from 2004 to 2014. Tax rates in 4 of these states — California, Missouri, Nevada, and North Dakota — were unchanged since before 2000. Furthermore, no state in the southern region increased its cigarette excise tax rate from 2010 (when South Carolina increased its excise tax by $0.50, to $0.57 per pack) through 2014 (Table 1). In contrast, 6 northeastern states increased their cigarette excise tax from 2010 through 2014 (Connecticut by $0.40 in 2011, Massachusetts by $1.00 in 2013, New Hampshire by $0.10 in 2013 (to reverse a $0.10 decrease in 2011), New York by $1.60 in 2010, Rhode Island by $0.04 in 2012, and Vermont by $0.38 in 2011 and $0.13 in 2014) (Table 1).
Discussion
The findings from this study indicate that 2000 to 2009 was a decade of major progress in state implementation of comprehensive smoke-free laws and cigarette excise tax increases. However, progress has slowed considerably since 2009. Only one state, (North Dakota) had a comprehensive smoke-free law go into effect between 2012 and 2016; on June 9, 2016, new California provisions go into effect that make the state’s smoke-free law comprehensive. Twenty-four states currently have minimal or no statewide smoking restrictions in effect. Increases in state cigarette excise taxes also slowed; between 2010 and 2014, 14 states and the District of Columbia had excise tax increases take effect. In contrast, 14 states and the District of Columbia had increases take effect in 2009 alone. If progress in implementing these evidence-based interventions does not resume, the United States may not achieve its Healthy People 2020 objectives to establish smoke-free indoor air laws in all 50 states and the District of Columbia, and to increase cigarette excise taxes by at least $1.50 per pack in all 50 states and the District of Columbia by the end of the current decade (objectives TU13 and TU-17.1, respectively) (10). This stalled progress in both policy areas may contribute to excess, preventable tobacco-related illness and death (1).
Comprehensive smoke-free laws reduce exposure to secondhand smoke, help smokers quit, and improve health outcomes; these laws typically have high levels of public support and compliance and do not have an adverse economic impact on the hospitality industry (eg, restaurants, bars) (1,2,8,11). However, this strong evidence base has not translated into continued progress in state implementation of comprehensive smoke-free laws in recent years, although such progress has continued at the local level. With a few exceptions, state laws adopted in more recent years are more often comprehensive laws, rather than partial laws (12). Research indicates that once states pass partial smoking restrictions, they are slow to revisit these laws and strengthen them (1,12).
The Institute of Medicine, the US Surgeon General, and the World Health Organization all agree that increasing the price of tobacco products is the single most effective way to reduce tobacco use (1,13,14). Increases in the price of tobacco products, including increases through state excise taxes, prevent smoking initiation, promote smoking cessation, and reduce the prevalence and intensity of tobacco use by adolescents and adults, thereby improving health outcomes (1,15–17). The recent slowed progress in cigarette excise tax increases is significant for 3 reasons. First, state excise tax rates vary widely — from $0.17 per pack in Missouri to $4.35 per pack in New York (1). Without sustained progress in increasing state excise taxes, especially in states where such taxes are low, low cigarette prices will contribute to smoking-related health disparities between states. State variations in cigarette tax rates and prices encourage tax avoidance and evasion, decreasing state revenues and undercutting health protection by perpetuating access to less expensive cigarettes (1). Second, excise taxes are levied as static dollar amounts per unit; if not periodically increased, these amounts do not keep pace with inflation (1). Third, the tobacco industry often responds to tax increases with promotions, such as offering coupons and discounts, to offset the projected decline in cigarette use (1,18). These 3 factors undermine the impact of tax increases on public health, especially when those increases are infrequent or small.
This study also highlights clear regional disparities. With the exception of Delaware, the District of Columbia, and Maryland, the remaining 14 states in the southern US Census region lack comprehensive smoke-free protections at the state level (Table 2). As of December 31, 2014, nine of these states either did not have any statewide smoking restrictions or had laws requiring only designated smoking areas or separately ventilated areas in work sites, restaurants, and bars (Table 2). Except for Delaware, the District of Columbia, and Maryland, North Carolina is the only southern state with a state law prohibiting smoking in restaurants and bars (Table 2). Furthermore, the average state excise tax for southern states is $0.96 per pack, which is considerably lower than the national average of $1.54 per pack (5). In addition to often lacking comprehensive smoke-free laws and high excise taxes, southern states also tend to provide low levels of funding for state tobacco control programs and to experience smoking prevalence and smoking-related diseases at higher rates than other regions (1,19–22). In the absence of more consistent state implementation of evidence-based tobacco control interventions across regions, these regional health disparities are likely to persist (1).
Despite stalled progress at the state level, progress continued in implementing comprehensive smoke-free laws at the local level. At least 697 localities have ordinances in place that prohibit smoking in restaurants, work sites, and bars, and this number continued to increase during the same period when state progress in this area stalled (23,24). Local progress in this area occurred in numerous states that lack comprehensive state laws, including in several southern states. In some southern states, such as Kentucky, Mississippi, South Carolina, Texas, and West Virginia, a substantial portion of the state’s population lives under comprehensive local smoke-free laws (25,26). Experience suggests that a critical mass of comprehensive local smoke-free laws in a state may lay the groundwork for the eventual adoption of a statewide comprehensive law (8,12). However, in 8 states that lack comprehensive state smoke-free laws, local jurisdictions are preempted from enacting smoking restrictions that are more restrictive than state law in some or all settings (7). Examining how local smoking restrictions evolved in recent years and their impact on public health merits further research. However, statewide legislation remains the only way to ensure that local laws do not lead to disparities in protections between localities.
The patterns observed in the local and state policy domains could be the result of multiple factors. For example, tobacco control efforts in some states may give priority to local policies over state policies in one or both of these domains because of the greater challenges associated with making progress at the state level and in the hope that local progress could eventually lay the groundwork for state progress. Another contributing factor could be the emergence of electronic cigarettes and other electronic nicotine delivery systems (27). The rapid spread and increasing use of these novel products may contribute to the stall in adopting additional state smoke-free laws, because decision makers may be uncertain whether to include these products in smoking restrictions, or they may perceive them as complicating implementation and enforcement of smoke-free laws (27). Another potential explanation is the recent reduction in funding for state tobacco prevention and control programs (20,28). The stall in adopting smoke-free laws may also be due, in part, to longstanding and continued efforts by the tobacco industry to interfere with the implementation of these efforts at the state and local levels (29).
The findings in this study are subject to at least 5 limitations. First, the study considered only comprehensive smoke-free policies and not less restrictive policies that provide some level of protection from secondhand smoke. For example, California has substantial statewide smoking restrictions that were enacted in 1994, at an early point in the evolution of smoke-free policies, but they do not meet current definitions of comprehensive smoke-free laws. The state has recently updated these provisions to enact a law making California comprehensively smoke-free, effective June 9, 2016. Second, although progress in enacting smoke-free legislation at the local level continued, local smoke-free ordinances were not taken into account in this study. Third, our analysis does not include information on the price per pack of cigarettes, which varies considerably from state to state, even between states with similar excise tax rates, because of differences in manufacturer, wholesaler, and retailer pricing and discounting practices. Fourth, state excise taxes were examined for cigarettes only, excluding taxes on other tobacco products. In general, state cigarette excise taxes tend to be substantially higher than state taxes on other tobacco products (7). Increasing the price of cigarettes without increasing the price of other combustible tobacco products may lead smokers to switch from an expensive tobacco product to a cheaper one instead of quitting all tobacco use and may lead adolescents to initiate tobacco use with cheaper products, such as little cigars (30). Finally, the study did not capture administrative decisions, including rule-making, opinions of attorneys general, or court decisions.
Recent slowdowns in implementing new statewide comprehensive smoke-free laws and state excise taxes may jeopardize progress in reducing tobacco use and the health and economic burdens it imposes. Although some progress was made at the local level, the first half of the current decade (2010–2014) was marked by a lack of momentum in both of these key policy areas at the state level, especially when compared with the considerable progress from 2000 through 2009. This stall also highlights regional disparities in tobacco prevention and control, particularly the lack of progress in the South. Without accelerated progress in implementing both of these important interventions, efforts to reduce tobacco use, exposure to secondhand smoke, health disparities, and tobacco-related illness and death in the United States could be undermined.
Acknowledgments
We thank Kisha Ann Smith-Williams for her thoughtful quality assurance of these data. This study was supported by the Centers for Disease Control and Prevention’s Office on Smoking and Health. The findings and conclusions in this report are those of the authors and do not necessarily represent the official position of the Centers for Disease Control and Prevention.
Author Information
Corresponding Author: Carissa Baker Holmes, MPH, Centers for Disease Control and Prevention, National Center for Chronic Disease Prevention and Health Promotion, Office on Smoking and Health, 4770 Buford Highway, NE, Mailstop F-79, Atlanta, GA 30341. Telephone: 770-488-5286. Email: CBHolmes@cdc.gov.
Author Affiliations: Brian A. King, Stephen D. Babb, Office on Smoking and Health, National Center for Chronic Disease Prevention and Health Promotion, Centers for Disease Control and Prevention, Atlanta, Georgia.
References
- Centers for Disease Control and Prevention. The health consequences of smoking — 50 years of progress: a report of the Surgeon General. Atlanta (GA): US Department of Health and Human Services; 2014.
- Guide to Community Preventive Services. Reducing tobacco use and secondhand smoke exposure. www.thecommunityguide.org/tobacco/index.html. Accessed January 23, 2015.
- Holford TR, Meza R, Warner KE, Meernik C, Jeon J, Moolgavkar SH, et al. Tobacco control and the reduction in smoking-related premature deaths in the United States, 1964–2012. JAMA 2014;311(2):164–71. CrossRefexternal icon PubMedexternal icon
- Centers for Disease Control and Prevention (CDC). State smoke-free laws for worksites, restaurants, and bars—United States, 2000-2010. MMWR Morb Mortal Wkly Rep 2011;60(15):472–5. PubMedexternal icon
- Campaign for Tobacco-Free Kids. State cigarette excise tax rates and rankings. Washington (DC): Campaign for Tobacco-Free Kids; 2014. http://www.tobaccofreekids.org/research/factsheets/pdf/0097.pdf. Accessed January 16, 2015.
- Centers for Disease Control and Prevention (CDC). State cigarette excise taxes — United States, 2010–2011. MMWR Morb Mortal Wkly Rep 2012;61(12):201–4. PubMedexternal icon
- Centers for Disease Control and Prevention. State Tobacco Activities Tracking and Evaluation (STATE) System. Atlanta (GA): Centers for Disease Control and Prevention; 2015. http://www2.cdc.gov/nccdphp/osh/state. Accessed January 16, 2015.
- Centers for Disease Control and Prevention. The health consequences of involuntary exposure to tobacco smoke: a report of the Surgeon General. Atlanta (GA): US Department of Health and Human Services; 2006.
- US Census Bureau. Census regions and divisions in the United States. Washington (DC): US Census Bureau; 2013. https://www.census.gov/geo/maps-data/maps/pdfs/reference/us_regdiv.pdf. Accessed January 29, 2015.
- US Department of Health and Human Services. Healthy People 2020: tobacco use objectives. Washington (DC): US Department of Health and Human Services; 2015. http://www.healthypeople.gov/2020/topics-objectives/topic/tobacco-use/objectives. Accessed July 27, 2015.
- International Agency for Research on Cancer. Evaluating the effectiveness of smoke-free policies. Geneva, Switzerland: World Health Organization; 2009.
- Sanders-Jackson A, Gonzalez M, Zerbe B, Song AV, Glantz SA. The pattern of indoor smoking restriction law transitions, 1970–2009: laws are sticky. Am J Public Health 2013;103(8):e44–51. CrossRefexternal icon PubMedexternal icon
- Institute of Medicine. Ending the tobacco problem: a blueprint for the nation. Washington (DC): The National Academies Press; 2007.
- World Health Organization. WHO report on the global tobacco epidemic, 2008 — the MPOWER package. Geneva (CH): World Health Organization; 2008.
- Centers for Disease Control and Prevention. Preventing tobacco use among youth and young adults: a report of the Surgeon General. Atlanta (GA): US Department of Health and Human Services; 2012.
- Chaloupka FJ, Straif K, Leon ME; Working Group, International Agency for Research on Cancer. Effectiveness of tax and price policies in tobacco control. Tob Control 2011;20(3):235–8. CrossRefexternal icon PubMedexternal icon
- International Agency for Research on Cancer. Effectiveness of tax and price policies for tobacco control. IARC handbooks of cancer prevention, Volume 14. Geneva (CH): International Agency for Research on Cancer; 2011.
- Chaloupka FJ, Cummings KM, Morley CP, Horan JK. Tax, price and cigarette smoking: evidence from the tobacco documents and implications for tobacco company marketing strategies. Tob Control 2002;11(Suppl 1):I62–72. CrossRefexternal icon PubMedexternal icon
- Campaign for Tobacco-Free Kids. Top combined state-local cigarette tax rates (state plus county plus city). Washington (DC): Campaign for Tobacco-Free Kids; 2014. http://www.tobaccofreekids.org/research/factsheets/pdf/0304.pdf. Accessed January 29, 2015.
- Centers for Disease Control and Prevention (CDC). State tobacco revenues compared with tobacco control appropriations — United States, 1998–2010. MMWR Morb Mortal Wkly Rep 2012;61(20):370–4. PubMedexternal icon
- Agaku IT, King BA, Dube SR; Centers for Disease Control and Prevention (CDC). Current cigarette smoking among adults — United States, 2005–2012. MMWR Morb Mortal Wkly Rep 2014;63(2):29–34. PubMedexternal icon
- Centers for Disease Control and Prevention. Best practices for comprehensive tobacco control programs — 2014. Atlanta (GA): Centers for Disease Control and Prevention; 2014.
- Americans for Nonsmokers’ Rights Foundation. Overview list: how many smoke-free laws? Americans for Nonsmokers Rights Foundation; 2015. http://www.no-smoke.org/pdf/mediaordlist.pdf. Accessed January 29, 2015.
- Local 100% smoke-free laws in all workplaces, restaurants, and bars: effective by year. Berkeley (CA): Americans for Nonsmokers Rights Foundation; 2015. http://www.no-smoke.org/pdf/current_smoke-free_ordinances_by_year.pdf. Accessed January 29, 2015.
- Chronological table of US population protected by 100% smoke-free state or local laws. Berkeley (CA): Americans for Nonsmokers Rights Foundation; 2015. http://www.no-smoke.org/pdf/EffectivePopulationList.pdf. Accessed January 29, 2015.
- Percent of US state populations covered by 100% smoke-free air laws. Berkeley (CA): Americans for Nonsmokers Rights Foundation; 2015. http://no-smoke.org/pdf/percentstatepops.pdf. Accessed January 29, 2015.
- Marynak K, Holmes CB, King BA, Promoff G, Bunnell R, McAfee T; Centers for Disease Control and Prevention (CDC). State laws prohibiting sales to minors and indoor use of electronic nicotine delivery systems — United States, November 2014. MMWR Morb Mortal Wkly Rep 2014;63(49):1145–50. PubMedexternal icon
- Campaign for Tobacco-Free Kids. Broken promises to our children: a state-by-state look at the 1998 state tobacco settlement 16 years later. Washington (DC): Campaign for Tobacco-Free Kids; 2015.
- World Health Organization. Tobacco industry interference with tobacco control. Geneva (CH): World Health Organization; 2008.
- Centers for Disease Control and Prevention (CDC). Consumption of cigarettes and combustible tobacco — United States, 2000–2011. MMWR Morb Mortal Wkly Rep 2012;61(30):565–9. PubMedexternal icon
Tables
 Table 1. Smoke-Free Laws and Cigarette Excise Tax Rates, by State, 2000–2014a
| State | State Smoke-Free Law | Cigarette Excise Tax | |||||
|---|---|---|---|---|---|---|---|
| Characteristica | Year Law in Effect | Excise Tax Rates | Amount of Tax Increase or Decrease | Year Tax Increase or Decrease Implemented | Percentage Change in Tax, 2000–2009 | Relative Percentage Change in Tax, 2010–2014 | |
| Alabama | Partial/none | —b | $0.425 | $0.260 | 2004 | 158 | 0 |
| Alaska | Partial/none | —b | $1.600 | $0.600 | 2005 | 100 | 0 |
| $1.800 | $0.200 | 2006 | |||||
| $2.000 | $0.200 | 2007 | |||||
| Arizona | Comprehensive | 2007 | $1.180 | $0.600 | 2002 | 245 | 0 |
| $2.000 | $0.820 | 2006 | 265 | 0 | |||
| Arkansas | Work sites | 2006 | $0.340 | $0.025 | 2001 | ||
| $0.590 | $0.250 | 2003 | |||||
| $1.150 | $0.560 | 2009 | |||||
| California | Partial/none | —b | $0.870 | $0.050 | 1999 | 0 | 0 |
| Colorado | Comprehensive | 2006 | $0.840 | $0.640 | 2005 | 320 | 0 |
| Connecticut | Partial/none | —b | $1.110 | $0.610 | 2002 | 500 | 13 |
| $1.510 | $0.400 | 2003 | |||||
| $2.000 | $0.490 | 2007 | |||||
| $3.000 | $1.000 | 2009 | |||||
| $3.400 | $0.40 | 2011 | |||||
| Delaware | Comprehensive | 2002 | $0.550 | $0.310 | 2003 | 567 | 0 |
| $1.150 | $0.600 | 2007 | |||||
| $1.600 | $0.450 | 2009 | |||||
| District of Columbia | Work sites | 2006 | $1.000 | $0.350 | 2003 | 285 | 16 |
| Comprehensive | 2007 | $2.000 | $1.000 | 2008 | |||
| $2.500 | $0.500 | 2009 | |||||
| $2.900 | $0.400 | 2014 | |||||
| Florida | Work sites, Restaurants | 2003 | $1.339 | $1.000 | 2009 | 295 | 0 |
| Georgia | Partial/none | —b | $0.370 | $0.250 | 2003 | 208 | 0 |
| Hawaii | Comprehensive | 2006 | $1.200 | $0.200 | 2002 | 160 | 23 |
| $1.300 | $0.100 | 2003 | |||||
| $1.400 | $0.100 | 2004 | |||||
| $1.600 | $0.200 | 2006 | |||||
| $1.800 | $0.200 | 2007 | |||||
| $2.000 | $0.200 | 2008 | |||||
| $2.600 | $0.600 | 2009 | |||||
| $3.000 | $0.400 | 2010 | |||||
| $3.200 | $0.200 | 2011 | |||||
| Idaho | Restaurants | 2004 | $0.570 | $0.290 | 2003 | 104 | 0 |
| Illinois | Comprehensive | 2008 | $0.980 | $0.400 | 2002 | 69 | 102 |
| $1.980 | $1.000 | 2012 | |||||
| Indiana | Work sites, restaurants | 2012 | $0.555 | $0.400 | 2002 | 542 | 0 |
| $0.995 | $0.440 | 2007 | |||||
| Iowa | Comprehensive | 2008 | $1.360 | $1.000 | 2007 | 278 | 0 |
| Kansas | Comprehensive | 2010 | $0.700 | $0.460 | 2002 | 229 | 0 |
| $0.790 | $0.090 | 2003 | |||||
| Kentucky | Partial/none | —b | $0.300 | $0.270 | 2005 | 1900 | 0 |
| $0.600 | $0.300 | 2009 | |||||
| Louisiana | Work sites, Restaurants | 2007 | $0.240 | $0.040 | 2000 | 80 | 0 |
| $0.360 | $0.120 | 2002 | |||||
| Maine | Restaurants, bars | 2004 | $1.000 | $0.260 | 2001 | 170 | 0 |
| Comprehensive | 2009 | $2.000 | $1.000 | 2005 | |||
| Maryland | Comprehensive | 2008 | $1.000 | $0.340 | 2002 | 203 | 0 |
| $2.000 | $1.000 | 2008 | |||||
| Massachusetts | Comprehensive | 2004 | $1.510 | $0.750 | 2002 | 230 | 40 |
| $2.510 | $1.000 | 2008 | |||||
| $3.510 | $1.000 | 2013 | |||||
| Michigan | Comprehensive | 2010 | $1.250 | $0.500 | 2002 | 167 | 0 |
| $2.000 | $0.750 | 2004 | |||||
| Minnesota | Comprehensive | 2007 | $1.230 | $0.750 | 2005 | 156 | 130 |
| $2.830 | $1.600 | 2013 | |||||
| Mississippi | Partial/none | —b | $0.680 | $0.500 | 2009 | 278 | 0 |
| Missouri | Partial/none | —b | $0.170 | $0.040 | 1993 | 0 | 0 |
| Montana | Work sites, restaurants | 2005 | $0.700 | $0.520 | 2003 | 844 | 0 |
| Comprehensive | 2009 | $1.700 | $1.000 | 2005 | |||
| Nebraska | Comprehensive | 2009 | $0.640 | $0.300 | 2002 | 88 | 0 |
| Nevada | Work sites, restaurants | 2006 | $0.800 | $0.450 | 2003 | 129 | 0 |
| New Hampshire | Restaurants | 2007 | $0.800 | $0.280 | 2005 | 242 | 0 |
| $1.080 | $0.280 | 2007 | |||||
| $1.330 | $0.250 | 2008 | |||||
| $1.780 | $0.450 | 2009 | |||||
| $1.680 | ($0.100) | 2011 | |||||
| $1.780 | $0.100 | 2013 | |||||
| New Jersey | Comprehensive | 2006 | $1.500 | $0.700 | 2002 | 238 | 0 |
| $2.050 | $0.550 | 2003 | |||||
| $2.400 | $0.350 | 2004 | |||||
| $2.575 | $0.175 | 2006 | |||||
| $2.700 | $0.125 | 2009 | |||||
| New Mexico | Comprehensive | 2007 | $0.910 | $0.70 | 2003 | 333 | 82 |
| $1.660 | $0.750 | 2010 | |||||
| New York | Comprehensive | 2003 | $1.110 | $0.550 | 2000 | 391 | 58 |
| $1.500 | $0.390 | 2002 | |||||
| $2.750 | $1.250 | 2008 | |||||
| $4.350 | $1.600 | 2010 | |||||
| North Carolina | Restaurants, bars | 2010 | $0.300 | $0.250 | 2005 | 800 | 0 |
| $0.350 | $0.050 | 2006 | |||||
| $0.450 | $0.100 | 2009 | |||||
| North Dakota | Work sites | 2005 | $0.440 | $0.150 | 1993 | 0 | 0 |
| Comprehensive | 2012 | ||||||
| Ohio | Comprehensive | 2006 | $0.550 | $0.310 | 2002 | 421 | 0 |
| $1.250 | $0.700 | 2005 | |||||
| Oklahoma | Partial/none | —b | $1.030 | $0.800 | 2005 | 348 | 0 |
| Oregon | Comprehensive | 2009 | $1.280 | $0.600 | 2002 | 74 | 11 |
| $1.180 | ($0.100) | 2004 | |||||
| $1.310 | $0.130 | 2014 | |||||
| Pennsylvania | Work sites | 2008 | $1.000 | $0.690 | 2002 | 416 | 0 |
| $1.350 | $0.350 | 2004 | |||||
| $1.600 | $0.250 | 2009 | |||||
| Rhode Island | Comprehensive | 2005 | $1.000 | $0.290 | 2001 | 387 | 1 |
| $1.320 | $0.320 | 2002 | |||||
| $1.710 | $0.390 | 2003 | |||||
| $2.460 | $0.750 | 2004 | |||||
| $3.460 | $1.000 | 2009 | |||||
| $3.500 | $0.040 | 2012 | |||||
| South Carolina | Partial/none | —b | $0.570 | $0.500 | 2010 | 0 | 714 |
| South Dakota | Work sites | 2002 | $0.530 | $0.200 | 2003 | 364 | 0 |
| Work sites, restaurants | 2008 | $1.530 | $1.000 | 2007 | |||
| Comprehensive | 2010 | ||||||
| Tennessee | Work sites | 2007 | $0.200 | $0.070 | 2002 | 377 | 0 |
| $0.620 | $0.420 | 2007 | |||||
| Texas | Partial/none | —b | $1.410 | $1.000 | 2007 | 244 | 0 |
| Utah | Work sites, restaurants | 2006 | $0.695 | $0.180 | 2002 | 35 | 145 |
| Comprehensive | 2009 | $1.70 | $1.005 | 2010 | |||
| Vermont | Comprehensive | 2009 | $0.930 | $0.490 | 2002 | 409 | 23 |
| $1.190 | $0.260 | 2003 | |||||
| $1.790 | $0.600 | 2006 | |||||
| $1.990 | $0.200 | 2008 | |||||
| $2.240 | $0.250 | 2009 | |||||
| $2.620 | $0.380 | 2011 | |||||
| $2.750 | $0.130 | 2014 | |||||
| Virginia | Partial/none | —b | $0.200 | $0.175 | 2004 | 1100 | 0 |
| $0.300 | $0.100 | 2005 | |||||
| Washington | Comprehensive | 2005 | $1.425 | $0.600 | 2002 | 145 | 49 |
| $2.025 | $0.600 | 2005 | |||||
| $3.025 | $1.000 | 2010 | |||||
| West Virginia | Partial/none | —b | $0.550 | $0.380 | 2003 | 224 | 0 |
| Wisconsin | Comprehensive | 2010 | $0.770 | $0.180 | 2001 | 327 | 0 |
| $1.770 | $1.000 | 2008 | |||||
| $2.520 | $0.750 | 2009 | |||||
| Wyoming | Partial/none | —b | $0.600 | $0.480 | 2003 | 400 | 0 |
a “Comprehensive” indicates a law that prohibits smoking in all indoor areas of private work sites, restaurants, and bars. Smoke-free restrictions in 1 or 2 of these 3 areas — private work sites, restaurants, bars — are indicated by listing the places where smoking is prohibited. “Partial/none” indicates a law that does not prohibit smoking in all indoor areas but permits it in designated smoking areas or separately ventilated areas or no smoke-free law.
b Year of relevant smoke-free law or excise tax increase or decrease is not applicable because the state did not implement a smoke-free law or excise tax increase or decrease from 2000 through 2014.
Table 2. State Smoke-Free Laws and State Cigarette Excise Tax Rates Per Pack, by State and US Census Region, 2014
| US Census Region | Type of Smoke-Free Lawa | State Cigarette Excise Tax Rate, Per Pack |
|---|---|---|
| Northeast | ||
| Connecticut | Partial/none | $3.400 |
| Maine | Comprehensive | $2.000 |
| Massachusetts | Comprehensive | $3.510 |
| New Hampshire | Restaurants | $1.780 |
| New Jersey | Comprehensive | $2.700 |
| New York | Comprehensive | $4.350 |
| Pennsylvania | Work sites | $1.600 |
| Rhode Island | Comprehensive | $3.500 |
| Vermont | Comprehensive | $2.750 |
| Average for region | $2.84 | |
| South | ||
| Alabama | Partial/none | $0.425 |
| Arkansas | Work sites | $1.150 |
| Delaware | Comprehensive | $1.600 |
| District of Columbia | Comprehensive | $2.900 |
| Florida | Work sites, restaurants | $1.339 |
| Georgia | Partial/none | $0.370 |
| Kentucky | Partial/none | $0.600 |
| Louisiana | Work sites, restaurants | $0.360 |
| Maryland | Comprehensive | $2.000 |
| Mississippi | Partial/none | $0.680 |
| North Carolina | Restaurants, bars | $0.450 |
| Oklahoma | Partial/none | $1.030 |
| South Carolina | Partial/none | $0.570 |
| Tennessee | Work sites | $0.620 |
| Texas | Partial/none | $1.410 |
| Virginia | Partial/none | $0.300 |
| West Virginia | Partial/none | $0.550 |
| Average for region | $0.96 | |
| Midwest | ||
| Illinois | Comprehensive | $1.980 |
| Indiana | Work sites, restaurants | $0.995 |
| Iowa | Comprehensive | $1.360 |
| Kansas | Comprehensive | $0.790 |
| Michigan | Comprehensive | $2.000 |
| Minnesota | Comprehensive | $2.830 |
| Missouri | Partial/none | $0.170 |
| Nebraska | Comprehensive | $0.640 |
| North Dakota | Comprehensive | $0.440 |
| Ohio | Comprehensive | $1.250 |
| South Dakota | Comprehensive | $1.530 |
| Wisconsin | Comprehensive | $2.520 |
| Average for region | $1.38 | |
| West | ||
| Alaska | Partial/none | $2.000 |
| Arizona | Comprehensive | $2.000 |
| California | Partial/none | $0.870 |
| Colorado | Comprehensive | $0.840 |
| Hawaii | Comprehensive | $3.200 |
| Idaho | Restaurants | $0.570 |
| Montana | Comprehensive | $1.700 |
| Nevada | Work sites, restaurants | $0.800 |
| New Mexico | Comprehensive | $1.660 |
| Oregon | Comprehensive | $1.310 |
| Utah | Comprehensive | $1.700 |
| Washington | Comprehensive | $3.025 |
| Wyoming | Partial/none | $0.600 |
| Average for region | $1.56 | |
a “Comprehensive” indicates a law that prohibits smoking in all indoor areas of private work sites, restaurants, and bars. Smoke-free restrictions in 1 or 2 of these 3 areas — private work sites, restaurants, bars — are indicated by listing the places where smoking is prohibited. “Partial/none” indicates a law that does not prohibit smoking in all indoor areas but permits it in designated smoking areas or in separately ventilated areas, or state has no smoke-free law.
The opinions expressed by authors contributing to this journal do not necessarily reflect the opinions of the U.S. Department of Health and Human Services, the Public Health Service, the Centers for Disease Control and Prevention, or the authors’ affiliated institutions.