Volume
8: No. 1, January 2011
Shuqian Liu, MD; Wenyu Wang, PhD; Jian Zhang, PhD; Yuna He, MS; Chonghua Yao, MD; Zhechun Zeng, MD; Jianhua Piao; Barbara V. Howard, PhD; Richard R. Fabsitz, PhD; Lyle Best, PhD; Xiaoguang Yang, MD, PhD; Elisa T. Lee, PhD
Suggested citation for this article: Liu S, Wang W, Zhang J, He Y, Yao C, Zeng Z, et al.
Prevalence of diabetes and impaired fasting glucose in Chinese adults, China National Nutrition and Health Survey, 2002. Prev Chronic Dis 2011;8(1):A13.
http://www.cdc.gov/pcd/issues/2011/jan/10_0008.htm. Accessed [date].
PEER REVIEWED
Abstract
Introduction
As a result of rapid economic development in China, the lifestyles and dietary habits of its people have been changing, and the rates of obesity, diabetes, and other chronic conditions have increased
substantially. We report the prevalence of type 2 diabetes and impaired fasting glucose (IFG) and the association between diabetes and overweight and obesity in Chinese adults. We also compare the results with
those from the US National Health and Nutrition Examination Survey, 1999-2002.
Methods
Data were from adults aged 20 years or older who participated in the China National Nutrition and Health Survey, 2002 (n = 47,729). Diabetes and IFG were defined by the American Diabetes Association 2009 criteria. We assessed the prevalence of diabetes, IFG,
and overweight and obesity by sex, age, region of residence, and ethnicity.
Results
The prevalence of diabetes and IFG in Chinese adults was 2.7% and 4.9%, respectively. The prevalence of diabetes increased with age and body mass index. Men and women had a similar prevalence of diabetes, but men had a significantly higher prevalence of IFG.
The prevalence of diabetes among Chinese who lived in urban areas was 2 to 3 times higher
than the prevalence among those who lived in rural areas (3.9% for urban areas and 6.1% for large cities vs 1.9% for rural areas), and
the prevalence of IFG was 1.5 to 2 times higher
(6.1% and 8.1% vs 4.2%, respectively). The prevalence of diabetes among Chinese women and young (20-39 y) and
middle-aged (40-59 y) adults who lived in large cities was similar to the prevalence
of diabetes in the US population.
Conclusion
The prevalence of diabetes and IFG was much higher in urban than rural areas, particularly in the large cities of China. Prevention must be emphasized among adults to reduce the future social and economic
burden of diabetes in China.
Back to top
Introduction
China has undergone rapid social and economic changes in the last 20 years.
The lifestyle and dietary habits of its people have also been changing, and the
rates of obesity, diabetes, and other chronic conditions have increased
dramatically over the past decades (1). Several previous large cross-sectional studies have reported the prevalence of diabetes in China (2-4). However, these studies either did not use a nationwide population-based representative random sample (2,4) or assessed populations limited by age, geographic region, or economic status (5). The International Collaborative Study of Cardiovascular
Disease in Asia (InterASIA) (3,5) considered Chinese adults aged 35 to 74 years, emphasized the geographic and economic differences between northern and southern regions (5 provinces in each), and examined differences between urban and rural areas. The China National Nutrition and Health Survey (CNNHS)
2002, on the other hand, included
all of mainland China, all adults and ethnic groups, and the entire economic spectrum
(6,7). Therefore, the data from the CNNHS 2002 are expected to provide a
comprehensive update to the results of InterASIA.
CNNHS 2002 was conducted by the
Ministry of Health, the Ministry of Science and Technology, and the State Statistical Bureau to obtain a timely understanding of the changes in dietary consumption and health status. This was the first nationwide population-based comprehensive nutrition and health survey in China. It included components on diabetes, hypertension, and dyslipidemia and was conducted in 31 provinces, autonomous regions, and municipalities.
We used data from CNNHS 2002 to estimate the prevalence
of type 2 diabetes and impaired fasting glucose (IFG) and the association between diabetes and obesity in Chinese adults, and to compare the results
with those reported from the US National Health and Nutrition Examination Survey (NHANES) 1999-2002 (8).
Back to top
Methods
The design and detailed methods of CNNHS 2002 have been described previously (6,9). Briefly, all of the 2,860 counties, districts, and cities in China were classified into 6 economic strata (large cities; medium or small cities; rural 1, 2, 3, and 4) by the government,
on the basis of their administrative division, population, and level of economic development (eg, gross of products and personal income). A stratified 4-stage random cluster sampling procedure was used (6,9). A response rate of
approximately 90% resulted in 272,023 participants, aged 2 to 101 years. About one-third of them were randomly selected to complete additional dietary and physical activity assessments and laboratory tests. The response rate was 91% for the additional tests. The data from 47,729 participants aged 20 years or older who completed the survey and the additional dietary, physical activity, and laboratory assessments were used in this analysis. All medical history interviews and
physical examinations were conducted by trained physicians following a standardized protocol. The procedures for blood collection and processing have been described previously (7).
We defined diabetes by using the American Diabetes Association (ADA) 2009 criteria (10) (fasting plasma glucose ≥7.0 mmol/L [≥126 mg/dL]) or self-reported current diabetes treatments in the survey. We defined IFG by using ADA criteria (fasting plasma glucose of 5.6-6.9 mmol/L [100-125 mg/dL]) in people who were not diagnosed with diabetes. Body mass index (BMI) was calculated as weight in kilograms divided by height in meters squared. Overweight was defined as a BMI of 25.0
kg/m2 to 29.9 kg/m2, and obesity was defined as a BMI of at least 30.0 kg/m2 (11). For comparison purposes, we also used the World Health Organization (WHO) recommendation for Asian populations (12), which defined overweight as a BMI of 23.0 kg/m2 to 24.9 kg/m2 and obesity as a BMI of at least 25.0 kg/m2.
The following 18 cities were designated as “large cities,” which are also the most economically developed cities in China: Beijing, Shanghai, Tianjin, Chongqing, Harbin, Shenyang, Dalian, Jinan, Qingdao, Ningbo, Nanjing, Zhengzhou, Shenzhen, Guangzhou, Chengdu,
Xian, Wuhan, and Xiamen. Residents of rural areas
of China are predominately engaged in farm work and live in villages but not in cities or towns, and residents
of urban areas are not engaged in farm work and live in cities or towns.
Although the living standard of the people in China has improved because of economic reforms
during the past 2 decades, the improvements are uneven between urban and rural areas. Rural areas are much less developed than urban areas, especially large cities. The lifestyles of Chinese in urban areas in 2002, particularly in large cities, were also quite different from those
of Chinese in rural areas. Residents of urban areas were more sedentary and more exposed to high-calorie foods than residents
of
rural areas (1).
China has 56 ethnic groups. Han is the largest and constitutes most of the population in China. The other 55 ethnic groups reside in 50% to 60% of the total geographic area and constitute only 6.6% of the population. Therefore, we divided CNNHS
2002 data into rural areas (rural 1, 2, 3, and 4) and urban areas (all
large, medium, and small cities), or large cities only, or into Han and all
minorities to explore possible differences in the
prevalence of diabetes or IFG by these economic, lifestyle, and ethnic differences. The US data used for comparisons were from NHANES 1999-2002, the survey design of which was adopted by CNNHS 2002.
The protocol of the survey was approved by the Ethical Committee of the National Institute for Nutrition and Food Safety and Chinese Center for Disease Control and Prevention. Signed informed consent forms were obtained from the participants.
To provide estimates that were representative of the Chinese population, we used sampling weights. These weights account for the stratified multistage random cluster design and the unequal probabilities of selection resulting from the design (6,9). For comparison purposes, we estimated sex- and age-standardized (by direct method) prevalence
rates and their 95% confidence intervals (CIs) (13). Two estimated proportions are considered significantly different at P < .05 if one does not
fall within the 95% CI of the other. The standard population used in the direct method was the US 2000 census population or the China 2000 census population. A t test (13), which is equivalent to testing the difference of 2 proportions, was also used to test prevalence differences among subgroups. Logistic regression with sampling weights was used to assess association between BMI categories and prevalence of diabetes while adjusting for conventional variables. Significance was set at
P < .05. SAS version 9.1 (SAS Institute, Inc, Cary, North Carolina) was used for all analyses.
Back to top
Results
The overall prevalence of diabetes (standardized
to the China 2000 census population) was 2.7% (Table
1). Prevalence of diabetes was similar among men and women overall; this was
also true by region and ethnicity. Prevalence increased with age in each
regional, ethnic, and sex group. Prevalence was approximately 2 times higher
overall and by age group among people who lived in urban rather than rural
areas. Prevalence of diabetes was highest (6.1%) among people who lived in
the 18 large cities. Among all minorities, overall and sex-specific
prevalence of diabetes was significantly lower than that among Han.
The overall prevalence of IFG was 4.9%
(Table
2). Prevalence among men was significantly higher than that among women; this
was also true by ethnicity and in urban areas and in large cities but not in
rural areas. The prevalence of IFG increased with age for each regional,
ethnic, and sex group. Among people who lived in urban areas, prevalence of
IFG was approximately 1.5 times higher overall and by age than that among
those who lived in rural areas. Prevalence of IFG was highest (8.1%) among
people who lived in large cities. Overall prevalence of IFG was
significantly lower among all minorities than among Han.
The overall
standardized
prevalence of diabetes in China (standardized to the
US 2000 census population)
(3.3%) was significantly lower than that in the United States (9.3%) (8)
(Table 3). The
standardized prevalence of diabetes among residents of the 18 large cities
was also significantly lower than that among the US population (8). However,
prevalence of diabetes was similar in China and the United States among
women and young (20-39 y) and middle-aged (40-59 y) adults who lived in
large cities (8). The overall standardized prevalence of IFG in
China (5.5%) was significantly lower than that in the United States (26%)
(8); this was also true by age and sex for IFG. In the United States, IFG
was consistently much more prevalent than diabetes among every age group,
but in China, the differences were smaller.
Obesity was strongly associated with diabetes. The
overall prevalence of diabetes (standardized to the China 2000 census
population) was 1.8%, 4.2%, and 7.8% in the normal, overweight, and obese
groups, respectively. According to WHO’s suggested BMI categories for
Asians, the corresponding proportions were 1.4%, 3.3%, and 4.7%. The
prevalence of diabetes increased significantly (P < .01) with BMI
category for all age groups (Figure 1). Overweight and obesity were
significantly (P < .01) more prevalent in urban areas than in rural
areas (29.4% vs 20.1% on the basis of the general BMI categories, or 49.1%
vs 38.0% on the basis of WHO’s suggested BMI categories for Asians) (Figure
2). The 18 large cities had the highest prevalence among all areas
regardless of which BMI category was used; this was also true by age group
(Figure 2). Approximately half of women and men aged 40 years or older were
overweight or obese (BMI ≥25 kg/m2). Prevalence of diabetes was
significantly higher among obese and overweight participants than among
normal-weight participants (odds ratio [OR], 4.12; 95% CI, 4.12-4.13, and
OR, 2.18; 95% CI, 2.18-2.18, respectively) after adjusting for age, sex,
region, ethnicity, education, and smoking (data not shown).
Figure 1. Prevalence of diabetes by age and BMI category, China National Nutrition and Health Survey, 2002. Standardized by age and sex to the 2000 China census population. All values are significantly
higher at P < .01 compared with the same age group of the lower body mass index (BMI) categories.
[A tabular version of this figure is also
available.]
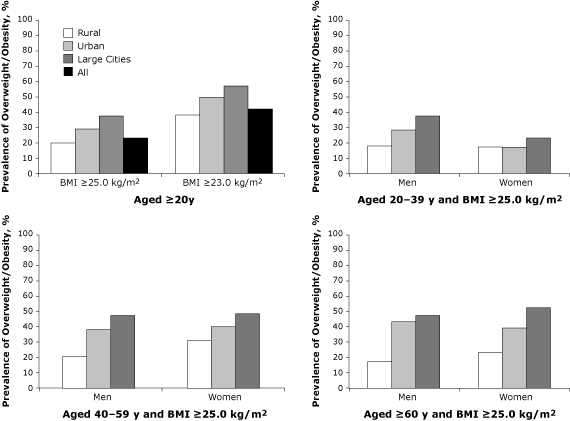
Figure 2. Prevalence of overweight and obesity by region, or by
age, sex, and region, China National Nutrition and Health Survey, 2002. Standardized by age and sex to the 2000 China census population. Residents of urban areas are not engaged in farm work and live in large, medium, or small cities or towns. Large cities are Beijing, Shanghai, Tianjin, Chongqing, Harbin, Shenyang, Dalian, Jinan, Qingdao, Ningbo, Nanjing,
Zhengzhou, Shenzhen, Guangzhou, Chengdu, Xi’an, Wuhan, and Xiamen. Residents of rural areas are predominately engaged in farm work and live in villages but not in cities or towns. All values for urban areas and large cities are significant at P < .01 compared with rural areas. Abbreviation: BMI, body mass index.
[A tabular version of this figure is also
available.]
Back to top
Discussion
Our findings of higher prevalence of overweight and obesity, diabetes, and IFG in urban areas, especially large cities, compared with rural areas, may be explained by the improved standard of living in China
during the past 2 decades. These improvements also led to considerable reduction in daily physical activity and
to an increase in consumption of high-calorie foods, especially in urban areas (1,14). In 2002, urban residents consumed an average of 35.4% of their energy from fat; the upper limit
suggested by WHO is 30% (1).
Our findings that the prevalence of diabetes was higher among urban than
rural residents and was similar among men and women but that the prevalence of
IFG was significantly higher
among men than women were also observed in InterASIA (3). However, contrary to our finding, InterASIA reported that urban and rural residents had similar prevalence of IFG (3).
Among participants aged 35 to 74 years who lived in urban areas, the overall and sex-specific prevalence of diabetes from the present
study were significantly lower than those reported from InterASIA (3) (6.0% [95% CI, 5.5%-6.6%] vs 7.8%); the same finding was true for rural areas (2.6% [95% CI, 2.3%-2.9%] vs 5.1%). These differences may be because CNNHS 2002 covered more cities and underdeveloped rural areas than did InterASIA (3,5). Our results,
which are based on more representative national data, update those reported from InterASIA.
Contrary to findings among US minorities, such as American Indians (15), the prevalence of diabetes and
of IFG among all minorities in China was significantly lower than that among Han. This difference may be because more than 80% of minorities in China reside in rural areas. Economic developments between urban and rural areas have been uneven, and residents
of rural areas are still predominately engaged in labor-intensive farm work or labor-intensive temporary work in cities.
The finding that the prevalence of diabetes among young and middle-aged adults who lived in large cities
was similar to the prevalence among those age groups in the United States (8) was consistent with the rapidly rising prevalence of overweight and obesity in China, especially
among young and middle-aged adults (1). The prevalence of overweight
and obesity (BMI ≥25.0 kg/m2) among adults aged 18 years or older increased by 49.3%, from 14.6% in 1992 to 21.8% in 2002, and the prevalence
among adults aged 18
to 44 years
almost tripled (1). The data from CNNHS 2002 showed an even higher prevalence of overweight
and obesity among adults aged 20 years or older, particularly those who lived in large cities. Overweight and obesity are typically associated with sustained peripheral and hepatic insulin resistance, which may eventually lead to diabetes (16). IFG was consistently much more prevalent than diabetes in each age group in the United States, but the
reasons for the smaller differences in China are unclear and need further study.
Our study has several limitations. First, the CNNHS 2002 provided only cross-sectional data and did not permit further study of risk factors for incident diabetes or IFG. Second, related social data
about people’s knowledge, attitudes, and beliefs about the factors contributing to health and disease
were unavailable. This limited our ability to further explore why diabetes and IFG were less prevalent
among all minorities than among Han or were less prevalent in rural areas than in
urban areas, although in general residents of rural areas in China had lower living standards, lower income, and fewer benefits such as retirement and health care than residents
of urban areas. This pattern of lower socioeconomic status being associated with lower prevalence of diabetes and
of IFG is the reverse of the disease patterns usually observed in the United States. Third, the comparisons in this study were done only for diabetes defined by the ADA fasting plasma glucose criteria
because oral
glucose tolerance tests were not performed in NHANES 1999-2002 (8). However, from CNNHS 2002 data, the prevalence of diabetes
found by including the additional diabetes cases detected by oral glucose tolerance testing
of participants with fasting plasma glucose of 5.6 mmol/L to 6.9 mmol/L was similar
to, though slightly higher than the prevalence based on the ADA criteria in China (data not shown).
Our observations suggest that, in view of China’s rapid urbanization, the prevalence of diabetes there may increase to a level similar to that of the United States
soon. Adults who live in urban areas of China, especially in large cities, should modify their lifestyles to reduce weight and
to minimize the future social and economic burden of diabetes.
Back to top
Acknowledgments
CNNHS 2002 was supported by the China Ministry of Health Special Fund and the China Ministry of Science and Technology Key Research Fund (contracts no. 2001DEA30035, no. 2002D2A40022, and no. 2003DIA6N008); the State Statistical Bureau, China;
United Nations Children's Fund; WHO; Food Unilever Co, Ltd, China; and Danone nutrition centers, China. We thank all investigators who conducted CNNHS 2002 for their efforts and all participants for their cooperation. Dr Liu is partially supported by a National Institutes of
Health grant (no. HL41654). Dr Liu had full access to all of the data in the study and takes responsibility for the integrity of the data and the accuracy of the data analysis. The statistical analyses were performed by Dr Liu and Dr Wang. No conflict of interest was declared.
Back to top
Author Information
Corresponding Authors: Wenyu Wang, PhD, Center for American Indian Health Research, College of Public Health, University of Oklahoma HSC, PO Box 26901, Oklahoma City, OK 73190. Telephone: 405-271-3090. E-mail:
wenyu-wang@ouhsc.edu. Xiaoguang Yang, MD, PhD, National Institute of Nutrition and Food Safety, Chinese Center for Disease Control and Prevention, Key Laboratory of Trace Element Nutrition, Ministry of Health, 29 Nan Wei Rd, Beijing 100050, China. Telephone: 8610-83132798. E-mail:
xgyangcdc@vip.sina.com.
Author Affiliations: Shuqian Liu, Elisa T. Lee, College of Public Health, University of Oklahoma, Oklahoma City, Oklahoma; Jian Zhang, Yuna He, Jianhua Piao, National Institute for Nutrition and Food Safety, Chinese Center for Disease Control and Prevention, Beijing, China; Chonghua Yao, Zhechun Zeng, Beijing Institute of Heart, Lung and Blood Vessel Diseases, Beijing Anzhen Hospital of the Capital University of Medical Sciences, Beijing, China; Barbara V. Howard, MedStar Research Institute,
Washington, DC; Richard R. Fabsitz, Epidemiology and Biometry Program, National Heart, Lung, and Blood Institute, Bethesda, Maryland; Lyle Best, Missouri Breaks Industries Research, Inc, Timber Lake, South Dakota. Dr Liu is also affiliated with the Beijing Institute of Heart, Lung and Blood Vessel Diseases, Beijing Anzhen Hospital of the Capital University of Medical Sciences, Beijing, China.
Back to top
References
- Wang Y, Mi J, Shan XY, Wang QJ, Ge KY, Wang Y, et al.
Is China facing an obesity epidemic and the consequences? The trends in obesity and chronic disease in China. Int J Obes
(London) 2007;31(1):177-88.
- Pan XR, Yang WY, Li GW, Liu J.
Prevalence of diabetes and its risk factors in China, 1994. National Diabetes Prevention and Control Cooperative Group. Diabetes Care 1997;20(11):1664-9.
- Gu D, Reynolds K, Duan X, Xin X, Chen J, Wu X, et al.
Prevalence of diabetes and impaired fasting glucose in the Chinese adult population: International Collaborative Study of Cardiovascular Disease in Asia (InterASIA). Diabetologia 2003;46(9):1190-8.
- Wang K, Li T, Xiang H.
Study on the epidemiological characteristics of diabetes mellitus and IGT in China
[in Chinese]. Zhonghua Liu Xing Bing Xue Za Zhi 1998;19(5):282-5.
- He J, Neal B, Gu D, Suriyawongpaisal P, Xin X, Reynolds R, et al.
International
Collaborative Study of Cardiovascular Disease in Asia: design, rationale, and preliminary results. Ethn Dis 2004;14(2):260-8.
- Wu Y, Huxley R, Li L, Anna V, Xie G, Yao C, et al.
Prevalence, awareness, treatment, and control of hypertension in China: data
from the China National Nutrition and Health Survey 2002. Circulation
2008;118(25):2679-86.
- Li Y, Yang X, Zhai F, Kok FJ, Zhao W, Piao J, et al.
Prevalence of the metabolic syndrome in Chinese adolescents. Br J Nutr
2008;99(3):565-70.
- Cowie CC, Rust KF, Byrd-Holt DD, Eberhardt MS, Flegal KM, Engelgau MM, et
al.
Prevalence of diabetes and impaired fasting glucose in adults in the US
population: National Health and Nutrition Examination Survey 1999-2002.
Diabetes Care 2006;29(6):1263-8.
- Li Y, Zhai F, Yang X, Schouten EG, Hu X, He Y, et al.
Determinants of childhood overweight and obesity in China. Br J Nutr 2007;97(1):210-5.
- American Diabetes Association.
Diagnosis and classification of diabetes mellitus. Diabetes Care
2009;32 Suppl 1:S62-7.
- Obesity: preventing and managing the global epidemic. Report of a WHO consultation. Geneva (CH): World Health Organization; 2000.
- World Health Organization, International Association for the Study of Obesity, International Obesity Task Force. The Asia-Pacific perspective: redefining obesity and its treatment. Sydney (AU): Health Communications Australia; 2000.
- Woodruff R. A simple method for approximating the variance of a complicated estimate. J Am Stat Assoc 1971;66(334):411-4.
- Popkin BM. The world is fat. Sci Am 2007;297:88-95.
- Lee ET, Howard BV, Go O, Savage PJ, Fabsitz RR, Robbins DR.
Prevalence of undiagnosed diabetes in three American Indian populations. A comparison of the 1997 American Diabetes Association diagnostic criteria and the 1985 World Health Organization diagnostic criteria: the Strong Heart Study. Diabetes Care 2000;23(2):181-6.
- Felber JP, Golay A.
Pathways from obesity to diabetes. Int J Obes Relat Metab Disord 2002;26 Suppl 2:S39-45.
Back to top
