
|
|
Volume
3:
No. 4, October 2006
ORIGINAL RESEARCH
Initiatives of 11 Rural Appalachian Cancer Coalitions in Pennsylvania and New York
Brenda C. Kluhsman, MSS, Marcyann Bencivenga, Ann J. Ward, MA, Erik Lehman, MS, Eugene J. Lengerich, VMD, MS
Suggested citation for this article: Kluhsman BC, Bencivenga M, Ward AJ, Lehman E, Lengerich EJ. Initiatives of 11 rural Appalachian cancer coalitions in Pennsylvania and New York. Prev Chronic Dis [serial online] 2006 Oct [date cited]. Available from:
http://www.cdc.gov/pcd/issues/2006/
oct/06_0045.htm.
PEER REVIEWED
Abstract
Introduction
Local coalitions combine the knowledge, expertise, and resources of many individuals and organizations to improve community health. This article describes data from 11 rural cancer coalitions in Pennsylvania and New York collected through a model-based data system.
Methods
The coalition data collection system was adapted from a conceptual model designed to monitor the activities and impact of cardiovascular disease coalitions. Community Coalition Action Theory was used during implementation and validation of the data system. Primary components of the data system were organizational capacity, process, and outcome/impact.
Results
From 2002 to 2004, the 11 coalitions conducted 1369 initiatives, including 1147 (83.8%) interventions and 222 (16.2%) development activities. Among interventions, 776 (56.7%) were outreach only, 158 (11.5%) education only, 117 (8.5%) outreach and education, and 96 (7.0%) screening. Differences in the distribution of initiatives by coalition, cancer site, and target audience were statistically
significant (P < .05). The majority of interventions focused on
colorectal (37.0%) and breast (32.9%) cancer. Target groups included women
(71.3%), rural residents (32.6%), survivors (21.8%), and low-income (21.8%)
individuals. Although not statistically significant, an observed 3-year trend
was shown for decreased outreach interventiions and increased education and
screening interventions. In total, 1951 of 3981 individuals who were
offered a cancer screening (49%) completed
screening, and 15 sustainable community changes were documented.
Conclusion
This study reports the initiatives and impact of 11 rural community cancer coalitions over a 3-year period. This study estimates the mix of development activities and community interventions,
against which this coalition network and others may be compared.
Back to top
Introduction
Local coalitions combine the knowledge, expertise, and resources of multiple individuals and organizations to improve community health (1,2). However, measurement of the process and impact of coalitions is difficult because of the complexity of coalitions and because traditional methods are poorly suited for capturing information on coalitions (3). Program planning, implementation, and
monitoring processes that are based in theory are more likely to succeed than those
processes developed without a theoretical perspective (4). Therefore, systems to monitor and evaluate coalition processes and impact should be based
on sound theoretical and conceptual frameworks. To date, few theory-based coalition data collection and evaluation systems have been reported in the literature.
Methods to better understand and measure the processes and impact of community coalitions include performance monitoring (5,6); ecological assessment (7); mixed-methods evaluation (8,9); and process evaluation, monitoring, and feedback (10-14). Early conceptual models developed to guide the capacity-building
of coalitions include the PRECEDE–PROCEED Planning Model (15,16) and the Planned
Approach To Community Health (PATCH) (17). In addition, researchers at the University of Kansas developed a data system and toolbox (18) based on a logic model approach to community change to enhance the potential of community health coalitions to address various disease conditions (10).
More recently, Butterfoss and Francisco (19) recommended measurement of health status and community change in coalition-based studies in addition to measurement of coalition capacity and sustainability. The Community Coalition Action Theory (CCAT) model identifies internal coalition factors and processes that lead to implementation of strategies and community change (20) and thereby provides a
method to assess coalition efforts. Additionally, the Reach, Efficacy, Adoption, Implementation, and Maintenance (RE-AIM)
evaluation framework uses quantifiable evaluation measures through each phase of research (21,22) to increase the likelihood of program adoption by coalitions in applied settings (23).
The potential for community coalitions as cancer prevention and control agents has been reported previously (24-29). In a recent controlled community intervention study, Ward et al (30) found that nine cancer coalitions in 13 rural Appalachian counties of Pennsylvania
and New York recruited almost three times as many local organizations to a cancer education intervention than did
matched control counties that did not have a cancer coalition.
As cancer coalitions increasingly engage in protocol-driven research,
activities, and interventions, they will need theory-based data systems to
monitor processes and assess impact. Coalitions will use these systems and the
data that result from them to help describe intervention processes and impact,
develop community cancer plans, and prepare funding proposals. Although recent
advances have been made in the development of Web-based applications for public
health education and data collection (31-33), data collection systems designed
specifically for community-based cancer coalitions have not been reported
previously. The purpose of this paper is to describe a model-based data system
and the data of 11 rural cancer coalitions in Pennsylvania and New York
collected from 2002 through 2004. The coalitions were part of the Appalachia
Cancer Network (ACN) (2000–2005), an academic–community partnership for community-based participatory research in cancer prevention and control (34,35). The coalitions were formed during the Appalachia Leadership Initiative on Cancer (1992–2000) and currently are part of the Appalachia Community Cancer Network (2005–2010). This study
included the nine coalitions that participated in the Ward et al (30) study.
Back to top
Methods
The coalition data collection system was initially adapted from a conceptual model designed to monitor the activities and impact of cardiovascular disease coalitions (10). The CCAT
model
(20) provided the conceptual framework for coalition development activities and
interventions. Data collected from 2002 through 2004 from 11 coalitions were included in
the analysis. One coalition had recorded data for only the first 1.5 years of
the study period due to loss of field staff. The data collection system contained three primary components (Figure).
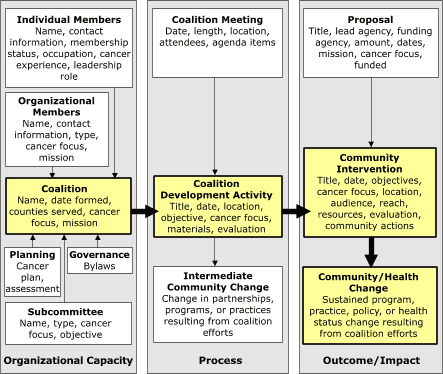
Figure. Coalition conceptual model, 11 rural
Appalachian coalitions in Pennsylvania and New York, 2002–2004. Adapted from:
Francisco et al (10). [A text description of this flow chart is also available.]
Organizational capacity included data on each coalition, including individual and organizational members, geographic service area, mission and focus, cancer control plans, governance, and subcommittees.
Process included coalition development activities, defined as “a planned gathering of some or all coalition members primarily intended to educate, equip, or enlarge coalition membership.” The primary audience for development activities was current or potential coalition members. Examples of development activities included member recruitment, training and recognition, and
community needs assessment. Data items included meeting information, development activity, and intermediate community change. Unlike Francisco et al (10), our model included intermediate community change, such as development of partnerships with new organizations or a change in practices or policies of partner organizations.
Outcome/Impact included intermediate outcomes such as community interventions, funded proposals, and impact such as community changes and cancer screenings. Community interventions were defined as “planned events sponsored or cosponsored by the coalition and primarily intended to directly change behavior, detect risk or disease, or educate persons who are not in the coalition
(nonmembers).” Community interventions were the primary mechanism by which the coalition fulfilled its mission of cancer control. Similar to Francisco et al (10), community change met the following criteria: 1) included members
outside of the coalition; 2) was related to the coalition’s mission; 3)
was facilitated by coalition members; 4) generated new or modified programs,
policies, or practices that were likely to occur without coalition influence in the future; and 5) occurred (was not just planned).
The cancer coalition data system was a secure, password-protected, Web-based
data application designed and beta tested by programming and field staff. Field
staff received approximately 40 hours of initial training in data collection,
coding, and data entry, with continued training for 3 months to maximize data validity and reliability. A training manual, data coding criteria, and system
operating procedures were also developed.
Data were collected by northern ACN field staff on nine distinct data collection forms: coalition information, coalition meeting, coalition meeting attendees, coalition individual member, coalition organization member, subcommittee, coalition development activity, community intervention, and proposal/fundraiser. Identical
computer screen forms were developed for electronic data entry. Field staff had primary responsibility
for completing initial data entry based on their attendance at coalition
meetings and collection of follow-up data related to coalition initiatives. Quality assurance was provided by the project director and data managers.
For analysis purposes, coalition initiatives were defined as either a coalition development activity or a community intervention. The objectives of the community interventions were determined and recorded; each intervention could have more than one objective. Objectives were used to group interventions into education-only, outreach-only, education and outreach, and screening interventions.
Statistical analyses of coalition initiatives were completed with SAS version 9.1 (SAS Institute, Cary, NC). Because there were multiple observations from each coalition within each type of initiative, a generalized estimating equations model was used to test for a temporal trend in the proportion of each initiative. A Pearson χ2 test was used within each type of initiative to
test for differences in the proportions of the initiatives between coalitions because there was only one observation per coalition per initiative. Generalized estimating equations were used to test for differences between proportions of the rows of cancer focus or audience within each type of initiative because there were potentially multiple observations from each coalition within each type of
initiative. The significance level was set at 0.05.
This research was approved by the institutional review board of The Pennsylvania State University. Coalition members demonstrated consent by completion of individual member forms.
Back to top
Results
From 2002 to 2004, the 11 Pennsylvania and New York coalitions conducted 1369 initiatives, including 222 (16.2%)
development activities and 1147 (83.8%) interventions (Table 1). Of the interventions, 776 (56.7%) were outreach only, 158 (11.5%) education only, 117 (8.5%) outreach and education, and 96 (7.0%) screening. Outreach-only
interventions decreased from two
in every three interventions to one in every two interventions, whereas the number and percentage of screening interventions
(and education interventions generally) increased each year; neither trend was statistically significant.
The median number of initiatives per coalition was 112 (range, 18–274)
(Table 2). Except in two cases, each coalition completed at least one of each type of initiative during the
3-year study period. The median number of screening interventions was four (range, 0–50). The distribution of the specific coalitions by each type of initiative was statistically significant (P
< .001).
The primary cancer focus of slightly more than one third (37.0%) of the interventions was colorectal cancer (n = 423) and another one third (32.9%) was breast cancer (n = 376)
(Table 3). Among screening interventions, 51 (50.5%) were focused on breast cancer, and 28 (27.7%) were focused on colorectal cancer. The distribution of primary cancer focus by each type of intervention was
statistically significant (P < .001 for outreach-only, education-only, and outreach and education
interventions; P = .006 for screening interventions).
Of the 1164 interventions that targeted an age group, almost half (47.2%) were targeted to individuals aged 50 to 64 years with another one third (34.9%) targeted to individuals aged 65
years or older
(Table 4). Approximately 71% of the
567 interventions that targeted a specific sex
were targeted to women (n = 404). Of the 472 interventions that targeted a particular audience, 154 (32.6%) were targeted to rural residents. Almost
a quarter of the interventions each were targeted to survivors (21.8%) or
low-income individuals (21.8%). Of the 63 interventions that targeted health care providers, half
(52.4%) were targeted to nurses. Among the 91 screening interventions that
targeted a specific age group, 79 were targeted to individuals aged 50 years and
older. Among the 80 screening interventions that targeted a specific sex, 56
were targeted to women.
From 2002 to 2004, of 3981 community residents reached through screening interventions, 1951 (49%) completed cancer screening
(data not shown). In addition, 15 sustainable community changes were reported by three of the 11 coalitions. The foci of these community changes were colorectal cancer (n = 11), breast and cervical cancer (n = 4), tobacco (n = 1) and prostate cancer (n= 1). These sustainable community
changes included primary care clinics that signed contracts to offer free and low-cost breast and cervical cancer screening services to underinsured individuals; clinic space made available for screening services for underinsured individuals; funding provided for cancer screening among underinsured individuals; and restaurants that became smoke-free.
Back to top
Discussion
From 2002 to 2004, the 11 rural cancer coalitions in Pennsylvania and New York completed 1369 coalition initiatives. Of these initiatives, six of every seven were community interventions with one in seven being coalition development activities. Development activities are necessary for long-term sustainability of a cancer coalition because it is through these activities that coalitions recruit, educate, and
equip coalition members. However, the appropriate ratio of community interventions to development activities for effective, efficient, and sustainable cancer coalitions has not been estimated.
The ratio of community interventions to development activities for the 11 coalitions in this study was substantial and ranged from 1.3:1.0 to 16.8:1.0; the
overall ratio of community interventions to development activities for this study
was 5.2:1.0.
Within community interventions, the number and percentage of screening
interventions (and education interventions generally) increased during the study period, whereas the number and percentage of outreach-only interventions decreased during the study period. In fact, outreach-only activities decreased from two in every three interventions to one in every two interventions. This appropriate increase in proportion of interventions may
be partially attributed to the participatory partnership between the coalitions and the academic researchers.
The research team provided monthly technical assistance, support, and training
that strengthened coalition efforts, focus, and direction. We are encouraged by these changes because
education and screening interventions are more likely to have a direct impact on cancer prevention and control
than are outreach-only interventions. Additional years of data may establish that the temporal trend for these 11 coalitions was statistically significant.
It is difficult to associate specific outcomes, such as a community change in cancer risk, to outreach-only interventions because outreach-only interventions tend to be nonspecific and difficult to measure. Interventions that are more individualized and easier to measure would include those with an education or screening objective. However, outreach-only interventions may be an important
component in a comprehensive mix of coalition interventions. Although the ideal
ratio of outreach-only to targeted interventions is not known, the range for the
11 individual coalitions was 0.5:1.0 to 9.0:1.0, and the ratio for all coalitions was 2.1:1.0.
The measures and observed results of coalition effectiveness in this study, including the increasing trend in interventions, the substantial number of completed screenings, and documented community changes, are indicators of the success of the 11 coalitions over the 3-year study period.
The CCAT model (20) posits that the combined resources and intervention strategies of coalition members and their
partners can improve health outcomes and lead to sustainable community change. The 11 coalitions and their academic partners in this study were able to achieve more through their participatory partnership than any one of the coalitions or the research team alone could have achieved,
which is a principal tenet of community-based participatory research (36). Interventions were possible because of the long
history and trusted relationships between the coalitions and their communities. The researchers added scientific rigor and a system for documenting processes and impact of the coalitions’ development activities and interventions. Thus, the partnership of coalitions and academic researchers greatly enhanced the potential to reduce the cancer burden in this rural Appalachian population.
This study is limited in several aspects. First, the validity and reliability
of this coalition data system have not been formally tested. However, extensive
training of field staff, their ongoing use of data manuals, as well as
quality-control procedures and oversight of the project director improved
reliability and reduced potential misclassification bias. In addition, this data
system was developed from an established community-based intervention model.
Second, a primary impact, community change, was infrequently reported. Many
coalitions rarely focused on community change as a primary objective and focused instead on community education, screening recruitment, and cancer prevention. Anecdotal reports indicate that community changes occurred more frequently than were recorded in
the data system. This is partially because a substantial amount of time frequently lapsed between an intervention and the resulting sustainable community change. This time delay may be responsible for the lack of recorded data on community change in the data system. Therefore, we believe that we have underestimated the true number of community changes that resulted, at least in part,
from these 11 rural coalitions. Third and finally, because the population was mostly rural and white, the results cannot be generalized to other populations. Further studies are needed to establish external validity to nonrural and diverse racial and ethnic groups.
Despite these limitations, this study has several strengths. First, this study documents the activities and impact of 11 community cancer coalitions over a 3-year study period. These coalitions have been in existence for more than a decade, so these results represent coalitions with an extensive history. More importantly, these data were captured through a model- and
Web-based approach for
coalition-driven, community interventions in cancer prevention and control. The
Web-based data system is mutually beneficial to both researchers and
communities, particularly those in rural, less accessible areas. By allowing
remote data entry by regional field staff who reside near coalitions that are dispersed across a wide geographical area, the data system enhances timely
submission of coalition data, provides technical assistance and communication
with the coalitions, and reduces travel costs. In turn, coalitions receive data for strategic planning, new member recruitment,
and program evaluation and report these data back to their communities. The Internet has been used to assist women in rural areas with day-to-day
management of breast cancer (37), provide electronic support groups for breast cancer patients (38), and improve quality of life for low-income women with breast cancer (39). However, to our knowledge, this data collection system is
relatively unique for evaluating community-based cancer prevention and control
initiatives. Finally, this study provided estimates of a mix of various development activities and community interventions, aggregated and compared across
3 years, against which comparisons with this network or other networks of community coalitions may be made. Analyses of future coalition outcomes examined in
comparison with the current study will help establish the long-term sustainability of these coalitions and
provide recommendations for an appropriate mix of coalition development activities and interventions that achieve measurable reduction in cancer burden for underserved populations.
This study demonstrates that community cancer coalitions in Pennsylvania and New York reached rural residents through cancer prevention and early detection education and screening interventions. Additional research is needed to determine the appropriate mix of development activities and community interventions for coalitions to achieve their cancer prevention and control goals. In addition,
evidence-based interventions are needed for coalitions to meet the cancer-related needs of specific populations. Finally, improved measurement of cancer screenings and community change will help coalitions document progress toward their overall goal of reducing cancer disparities in rural Appalachia.
Back to top
Acknowledgments
The authors acknowledge the members of the cancer coalitions that participated in the development and implementation of these initiatives: in Pennsylvania, ACTION Health Cancer Task Force (Columbia, Montour, Northumberland, Snyder, and Union counties), Coalition for People Against Cancer (Clearfield County), Crawford County Cancer Coalition, Elk County Cancer
and Tobacco Education Coalition, Greene
County Cancer Coalition, Indiana County Cancer Coalition, Lawrence County Cancer Coalition, Wyoming County Cancer/Tobacco Partnership; and in New York, Chautauqua County Partners for Prevention and Delaware County Cancer Coalition. We especially thank coalition members Marcia Anderson
(Lawrence County) and Valerie Bell (Wyoming County) for their editorial review and guidance. This project was partially supported by
grants nos. U01 CA
86096-02 and U01 CA 114622-01 from the National Cancer Institute.
Back to top
Author Information
Corresponding Author: Eugene J. Lengerich, The Pennsylvania State University, Department of Health Evaluation Sciences, PO Box 855, Mail Stop A210, Suite 2200, 600 Centerview Dr, Hershey, PA 17033. Telephone: 717-531-7178. E-mail:
elengerich@psu.edu. Dr Lengerich is also affiliated with the Penn State Cancer Institute, Hershey, Pa.
Author Affiliations: Brenda C. Kluhsman, Marcyann Bencivenga, Erik Lehman, Department of Health Evaluation Sciences, College of Medicine, The Pennsylvania State University, Hershey, Pa; Ann J. Ward, Community Cancer Control, Research, and Education, Lemont, Pa.
Back to top
References
- Feighery E, Rogers T. How-to guides on community health promotion. Guide 12:
building and maintaining effective coalitions. Palo Alto (CA): Stanford Health Promotion Resource Center; 1990.
- Butterfoss FD, Goodman RM, Wandersman A.
Community coalitions for disease prevention and health promotion. Health Educ Res 1993;8(3):315-30.
- Berkowitz B.
Studying the outcomes of community-based coalitions. Am J Community Psychol 2001;29(2):213-27; discussion 229-39.
- National Cancer Institute. Theory at a glance: a guide for health promotion practice.
2nd ed. Bethesda (MD): National Cancer Institute, Division of Cancer Control
and Population Sciences; 2005. Available from: http://www.cancer.gov/PDF/481f5d53-63df-41bc-bfaf-5aa48ee1da4d/TAAG3.pdf
- JS Durch, LA Bailey, MA Stoto, editors. Improving health in the
community: a role for performance monitoring. Washington (DC): National Academy Press; 1997.
- Payne CA.
The challenges of employing performance monitoring in public health community-based efforts: a case study. J Community Health 1999;24(2):159-70.
- Goodman RM, Wandersman A, Chinman M, Imm P, Morrissey E.
An ecological assessment of community-based interventions for prevention and health promotion: approaches to measuring community coalitions. Am J Community Psychol 1996;24(1):33-61.
- Goodman RM, Wandersman A. FORECAST: a formative approach to evaluating community coalitions and community-based initiatives. J Community Psychol Monograph Series; 1994.
- Gallagher K, Stanley A, Shearer D, Klerman LV.
Challenges in data collection, analysis, and distribution of information in community coalition demonstration projects. J Adolesc Health 2005;37(3 Suppl):S53-60.
- Francisco VT, Paine AL, Fawcett SB.
A methodology for monitoring and evaluating community health coalitions. Health Educ Res 1993;8(3):403-16.
- Fawcett, SB, Paine-Andrews A, Harris KJ, Francisco VT, Richter KP, Lewis,
RK. Evaluating community efforts to prevent cardiovascular diseases. Lawrence
(KS): Work Group on Health Promotion and Community Development, University of
Kansas; 1995.
- Fawcett SB, Paine-Andrews A, Francisco VT, Schultz J, Richter KP,
Berkley-Patton J, et al.
Evaluating community initiatives for health and development. WHO Reg Publ Eur Ser 2001;92:241-70.
- Fawcett SB, Lewis RK, Paine-Andrews A, Francisco VT, Richter KP, Williams
EL, et al.
Evaluating community coalitions for prevention of substance abuse: the case of
Project Freedom. Health Educ Behav 1997;24(6):812-28.
- Chalmers ML, Housemann RA, Wiggs I, Newcomb-Hagood L, Malone B, Brownson
RC.
Process evaluation of a monitoring log system for community coalition activities: five-year results and lessons learned. Am J Health Promot 2003;17(3):190-6.
- Green LW, Kreuter MW, Deeds SG, Partridge KB. Health education planning: a diagnostic approach. Palo Alto (CA): Mayfield; 1980.
- Green LW, Kreuter MW. Health promotion planning: an educational and environmental approach. 2nd ed. Mountain View (CA): Mayfield; 1991.
- Green LW, Kreuter MW. CDC’s planned approach to community health as an application of PRECEDE and an inspiration for PROCEED. J Health Educ 1992;23(3):140-7.
- Fawcett SB, Francisco VT, Schultz JA, Berkowitz B, Wolff TJ, Nagy G.
The
community tool box: a web-based resource for building healthier communities.
Public Health Rep 2000;115(2-3):274-8.
- Butterfoss FD, Francisco VT.
Evaluating community partnerships and coalitions with practitioners in mind.
Health Promot Pract 2004;5(2):108-14.
- Butterfoss FD, Kegler MC. Toward a comprehensive understanding of community coalitions: moving from practice to theory. In: DiClemente RJ, Crosby RA, Kegler MC, editors. Emerging theories in health promotion practice and research. San Francisco (CA): Jossey-Bass; 2002. p. 157–93.
- Glasgow RE, Vogt TM, Boles SM.
Evaluating the public health impact of health promotion interventions: the RE-AIM framework. Am J Public Health
1999;89(9):1322-7.
- Glasgow RE, McKay HG, Piette JD, Reynolds KD.
The RE-AIM framework for evaluating interventions: what can it tell us about
approaches to chronic illness management? Patient Educ Couns
2001;44(2):119-27.
- Glasgow RE. Evaluation models for theory-based interventions: the RE-AIM model. In: Glanz
K, Rimer B, Lewis F, editors. Health behavior and health education: theory, research, and practice. 3rd ed. San Francisco (CA): John Wiley and Sons; 2002. p. 531-44.
- National Cancer Institute. Pink book: making health communication programs work.
Bethesda (MD): National Cancer Institute, Office of Communications; 2002. Available from: http://www.cancer.gov/pinkbook/page15
- Alfano MC, Horowitz AM.
Professional and community efforts to prevent morbidity and mortality from oral cancer. J Am Dent Assoc 2001;132(Suppl):24S-9S.
- Bigby J, Ko LK, Johnson N, David MM, Ferrer B; REACH Boston 2010 Breast
and Cervical Cancer Coalition.
A community approach to addressing excess breast and cervical cancer mortality among women of African descent in Boston. Public Health Rep 2003;118(4):338-47.
- Fouad MN, Nagy MC, Johnson RE, Wynn TA, Partridge EE, Dignan M.
The development of a community action plan to reduce breast and cervical cancer disparities between African-American and
white women. Ethn Dis 2004;14(3 Suppl 1):S53-60.
- Garland B, Crane M, Marino C, Stone-Wiggins B, Ward A, Friedell G.
Effect of community coalition structure and preparation on the subsequent implementation of cancer control activities. Am J Health Promot 2004;18(6):424-34.
- National Comprehensive Cancer Control Program. Atlanta (GA): Centers for
Disease Control and Prevention [cited 2006 Mar 26]. Available from: http://www.cdc.gov/cancer/ncccp/index.htm
- Ward AJ, Coffey Kluhsman B, Lengerich EJ, Piccinin AM.
The impact of cancer coalitions
on the dissemination of colorectal cancer materials to community organizations
in rural Appalachia. Prev Chronic Dis [serial online] 2006 Apr.
- Cooper CJ, Cooper SP, Del Junco DJ, Shipp EM, Whitworth R, Cooper SR.
Web-based data collection: detailed methods of a questionnaire and data gathering tool. Epidemiol Perspect
Innov 2006;3:1.
- Young WF, Montgomery D, Nycum C, Burns-Martin L, Buller DB.
Web-based technical assistance and training to promote community tobacco control policy change. Health Promot Pract 2006;7(1):78-85.
- Turner C, Yorkston E, Hart K, Drew L, McClure R.
Simplifying data collection for process evaluation of community coalition activities: an electronic web-based application. Health Promot J Austr 2006;17(1):48-53.
- Friedell GH, Rubio A, Maretzki A, Garland B, Brown P, Crane M, et al.
Community cancer control in a rural, underserved population: the Appalachian Leadership Initiative on Cancer Project. J Health Care Poor Underserved 2001;12(1):5-19.
- Lengerich EJ, Wyatt SW, Rubio A, Beaulieu JE, Coyne CA, Fleisher L, et al.
The Appalachia
Cancer Network: cancer control research among a rural, medically underserved population. J Rural Health 2004;20(2):181-7.
- Israel BA, Schulz AJ, Parker EA, Becker AB.
Review of community-based research: assessing partnership approaches to improve public health. Annu Rev Public Health 1998;19:173-202.
- Weinert C, Cudney S, Winters C.
Social support in cyberspace: the next generation. Comput Inform Nurs
2005;23(1):7-15.
- Lieberman MA, Golant M, Giese-Davis J, Winzlenberg A, Benjamin H, Humphreys K, et al.
Electronic support groups for breast carcinoma: a clinical trial of effectiveness. Cancer 2003;97(4):920-5.
- Gustafson DH, McTavish FM, Stengle W, Ballard D, Hawkins R, Shaw BR, et al.
Use and impact of eHealth
System by low-income women with breast cancer. J Health Commun 2005;10(Suppl 1):195-218.
Back to top
|
|
