
|
|
Volume
3:
No. 3, July 2006
ORIGINAL RESEARCH
Progress in Pediatric Asthma Surveillance I: The Application of Health Care Use Data
in Alameda County, California
Eric M. Roberts, MD, PhD, Paul B. English, PhD, MPH, Stephen K. Van den Eeden, G. Thomas Ray
Suggested citation for this article: Roberts EM, English PB, Van den Eeden SK, Ray GT. Progress in pediatric asthma surveillance I: the application of health care use data
in Alameda County, California. Prev Chronic Dis [serial online] 2006 Jul [date cited]. Available from: URL:
http://www.cdc.gov/pcd/issues/2006/
jul/05_0186.htm.
PEER REVIEWED
Abstract
Introduction
The ability to conduct community-level asthma surveillance is increasingly crucial for public health programming and child health advocacy. We explored the potential and limitations of health care use records from both public and private sources for asthma surveillance in
a California county.
Methods
We combined administrative patient record data from Kaiser Permanente of Northern California and
Medi-Cal (the California Medicaid program) for Alameda County residents during 2001. We assessed the resulting
data set for completeness, population representation, consistency with external data, and internal indicator consistency.
Results
Our resulting data set included records for 226,383 children younger than 18 years. Completeness of Medicaid data was affected by managed care market share, reducing our usable
data set size to 176,789, approximately equal to one of every two children in the county or one of every 3
person-months. External data documenting hospitalization rates due to asthma were poorly correlated with
hospitalization rates (r = 0.2120, P = .20) but highly correlated with emergency department visits (r = 0.8607, P <.001) in the resulting
data set. High internal consistency of indicators suggested that the data set represented a broad spectrum of health care access and quality of care congruent with clinical aspects of the disease.
Conclusion
The utility of these data is affected by logistical and administrative factors, including the health care payment structure and the market shares of care providers. These factors can be expected to similarly affect the utility of this approach in other counties. Our ability to generate county-level health statistics for comparison with other locations was limited, although the
data set appeared
well suited for within-county geographic analysis. In light of these findings, these data have the potential to expand the local health surveillance capacity of communities.
Back to top
Introduction
Although asthma has emerged as a major public health challenge (1), our current needs for asthma surveillance have far outpaced our capabilities. This problem comes as no surprise because there is no single test or entirely objective definition for either the disease or its resolution (2-4). Historically, surveys of patients and
their parents have been the backbone of asthma surveillance. Cultural
differences and inconsistencies in reporting (5-8), however, as well as the high cost of survey studies (2,9) make such methods problematic for ongoing monitoring. At the national level, asthma surveillance takes the form of a patchwork of surveys that report symptoms, diagnoses, emergency department and clinic visits, and hospitalizations (1,10). A few states have also taken steps toward
asthma surveillance (11-13). During the past several years, a consistent picture has emerged of generally rising morbidity and stark social disparities of the disease, but the causes of both the spread and the disparities remain controversial.
Increasingly, childhood asthma prevention and management have become a state and local issue as state health care expenditures have increased and communities have focused on the impacts of the disease on school districts, local economic development, and questions of environmental justice (14-17). Communities seek local asthma surveillance data to enable them to assess small-area variations in
the burden of disease, identify subpopulations at risk, and plan health resource allocation; however, such data are generally scarce (18,19). As asthma is increasingly recognized
as being tied to issues of neighborhood segregation, local air quality, and distribution of health resources, the demand for local surveillance of the disease can be expected to increase.
As part of the California Environmental Public Health Tracking Program (CEHTP),
funded by the Centers for Disease Control and Prevention (CDC), we collaborated with a private health care provider, Kaiser Permanente of Northern California; Medi-Cal, California’s Medicaid program; and an array of community-based and nongovernmental organizations to develop asthma surveillance that would meet the
needs of stakeholders in Alameda County, a mostly urban county in the metropolitan San Francisco Bay area. We were interested in our ability to generate high-quality data that 1) represented the county population, 2) provided a complete picture of the geography of asthma using
various asthma-related health events, and 3) included patient home addresses to enable high-resolution geographic
analysis.
The use of health care services claims for monitoring asthma morbidity, health care access, and management has been emphasized as an important next step (20,21), although few (13,22-24) have described in detail the possibilities, pitfalls, and limitations of such work. In this
article, we describe our process of evaluating the utility of health care
use data for asthma surveillance and
discuss the logistical and administrative factors affecting data utility. Technical and statistical procedures for data analysis, visualization, and surveillance findings are described in a companion article (25) in this issue of Preventing Chronic Disease.
Health care use records for asthma surveillance
Analysis of hospitalization rates to reflect the impact of asthma in populations is a long-standing practice (26), although it
has several limitations. Among children, only those with asthma that is severe, poorly controlled, or both are hospitalized, which means that hospitalization rates are confounded by differences in access to care among populations (10,27,28). Furthermore,
hospitalization is a comparatively rare event relative to overall disease prevalence, so small-area rates are usually difficult to calculate with any precision. Some epidemiologists have used 3-year averages to gain statistical stability at the
postal ZIP-code level, but this seems to be the limit of geographic resolution for hospitalization data (29). Oyana et al (30) were able to analyze geographic
clustering of asthma hospitalizations around the Peace Bridge complex in Buffalo,
NY, by aggregating 5 years of such data.
Several investigators have explored the use of health care billing records for asthma surveillance,
an approach that offers several advantages. Interest has centered on the possibility that health care events other than hospitalization, such as
emergency department visits, outpatient visits, and symptom and maintenance
medication purchases, may be available for surveillance purposes, which could
greatly expand the pool of people identified as having asthma. In populations
with good access to care, mortality, hospitalizations, and
emergency department visits would not be expected to be elevated even with a relatively high prevalence of asthma (31) (Figure 1). Similarly, among populations with poor access to care, these indicators
would be expected to be elevated out of proportion to the asthma prevalence.
Our hope is that assessing the rates of lower acuity or routine
events will lead to a more complete picture of asthma in geographically defined populations.
Figure 1. The spectrum of health care use indicators for asthma by quality of care. [A text description of this figure is also available.]
Some efforts have been made to evaluate the usefulness of billing records for
asthma surveillance in Canada (32). A few studies have also used insurance
claims data for the study of occupational disease (33-35). A group of
investigators in Milwaukee (23) sought out records from area hospitals, clinics,
and health maintenance organizations (HMOs) to estimate asthma burden. They were
able to monitor both emergency department and outpatient visits (in addition to hospitalizations) for asthma in a relatively low-cost, potentially sustainable manner.
Other researchers have attempted to use medication purchasing patterns to construct indices of asthma in populations. This approach is consistent with U.S. national guidelines, which explicitly include medication use when classifying asthma severity (31). A Canadian group was able to roughly classify patients
according to the severity of their asthma using medication records (24),
although it cautions that such an approach in the United States would be confounded by differences in health care access among populations. A North Carolina group examined health care use, including medication purchasing, among Medicaid beneficiaries and was successful in quantifying prevalence by age, race, and rural or urban residence (36). A consensus is emerging that medication purchasing information
is an important component of records-based asthma surveillance that requires development (10,26).
All of these studies have cited the need for comprehensive indicators of asthma impact beyond hospitalization rates as a motivation for investigating the use of health care billing records. Curiously, none mentions an additional advantage related to the use of such records — the availability of patient address data to enable surveillance of asthma in small geographic areas. Advances in
geographic coding, spatial statistics, and geographic information mapping have made possible the calculation and presentation of disease rates at sub–ZIP-code resolution while preserving patient confidentiality (37).
Evaluating health care use records for surveillance purposes
We evaluated the utility of health care use records from public and private sources for monitoring asthma among children. We were particularly interested in the feasibility of using these data to meet the surveillance needs of local stakeholders, which included quantifying and visualizing health disparities, identifying populations at elevated risk for asthma, and
informing discussions of environmental justice by linking them to broader population health issues.
To evaluate this feasibility, we constructed a working data set for Alameda County, a diverse, urban county in Northern California of 1.4 million residents. We examined 1) data completeness, 2) resulting population representation, 3) external consistency of the data with the previously understood distribution of asthma in Alameda County, and 4) internal consistency of the indicators with each
other.
Back to top
Methods
Data sources
Health care use data were drawn from two sources. The first was Kaiser Permanente of Northern California (KPNC), an integrated health care delivery system that is the region’s largest single provider of health services. Out of the total 3.1 million members of KPNC,
577,687 were residents of Alameda County during 2001; approximately 40% of county residents received their care at KPNC during
that year. Kaiser Permanente maintains a complete list of enrollees (denominator
data) and databases describing hospitalizations, clinic visits, referrals,
external claims, and medication purchases by members (numerator data) and uses these for both administrative and health
care services research purposes. (For examples, see Davis et al [38]
and Schoen et al [39].)
The second source was Medi-Cal, which covered 227,086 beneficiaries in Alameda County during 2001. Medi-Cal is a complicated data source because the state has subcontracted patient care through HMOs since 2001. As of 2001 in Alameda County, all patients qualifying for zero share-of-cost Medicaid benefits were required to enroll in one of the two managed care plans in the
county, Blue Cross of California or Alameda Alliance for Health. (Other beneficiaries are given the option to join.) We investigated the reporting rates of health care
use by the HMOs to the state Department of Health Services in Sacramento by comparing them to
use rates under the fee-for-service arrangement. Finally, a small portion of Kaiser Permanente enrollees (1.7% of the total, 3.2% of
children) are also Medi-Cal patients subcontracted through the Alameda Alliance for Health (Figure 2).
Figure 2. Administrative sources for health care billing records in Alameda County, California. Shaded circles indicate enrollee populations able to be included in the analysis because of completeness of records. Approximately 3.9% of Kaiser Permanente person-months represent Medi-Cal beneficiaries subcontracted through Alameda Alliance for Health. [A text description of this figure is also available.]
We compared these data to hospitalization counts abstracted by the California Office of Statewide Healthcare Planning and Development (OSHPD).
Hospitals are required by law to report these data to OSHPD; the data represent 100% of hospitalizations
in the state. Although hospitalizations are the only asthma-related event recorded by OSHPD, and the patient’s ZIP code of residence
is the sole geographic field available, these data are the nearest thing to a gold standard to which we can compare numbers generated from the Kaiser Permanente and Medi-Cal
data sets.
Defining asthma events
Hospitalizations, emergency department visits, and outpatient visits in the
data sets included fields for primary and, in certain cases, secondary
diagnoses. For comparisons with existing
data sets, such events were considered asthma-related if the primary diagnosis began with the digits 493, the International Classification of Diseases, Ninth Revision,
Clinical Modification (ICD-9-CM) code for asthma. For health
surveillance, however, we also included events with asthma as the secondary diagnosis and a primary diagnosis of pneumonia, respiratory failure, or another condition for which an asthma exacerbation was likely to be the cause.
We classified medications as asthma related based on their functional class and divided them into symptom (or
rescue) and maintenance (or controller) medications. Symptom medications included long- and short-acting beta agonists and anticholinergics; maintenance medications included antileukotrienes, mast cell stabilizers, methylxanthines,
and inhaled corticosteroids. (The corticosteroids could be present alone or in combination with bronchodilating agents). Oral corticosteroids were omitted because of concern that their use for reasons other than asthma was commonplace enough to compromise the specificity of the indicator. The classification of long-acting beta agonists as symptom rather than maintenance medications was subject to extensive debate. In the end, the lack of
evidence (40) for long-term efficacy of these drugs, particularly in preventing hospitalizations, argued against their classification in the maintenance category. It was later noted that this classification algorithm is identical to that constructed independently by Buescher and Jones-Vessey (36).
Patient addresses
Home addresses were obtained from records directly maintained by KPNC and Medi-Cal. These were standardized using ZP4 (Semaphore Corp, Pismo Beach, Calif); they were subsequently geocoded using a custom application written in Java 2
Platform, Standard Edition (Sun Microsystems Inc, Santa Clara, Calif) and ArcSDE version 9.0 (ESRI, Redlands, Calif). Geocoded
address coordinates were taken from the first successful match of the following
four street centerline data sets (in order): Dynamap/2000 version 13 (Tele Atlas,
Lebanon, NH), Navstreets (Navteq, Chicago, Ill), Tele Atlas MultiNet (Tele Atlas, Lebanon, NH), and the Census
2000 TIGER/Line (U.S. Census Bureau, Washington, DC). For each street centerline
data set, the first attempt to match an address
was made by indexing the address’s ZIP code. Failing that, the soundex phonetic
code of the address’s city was matched against an index of the soundex phonetic
code of the street centerline’s post office name, based on its ZIP code. We have noted the spatial accuracy of assignment to census tracts by this method to be approximately 99%.
Statistical analysis
To measure data completeness, we used a straightforward frequency analysis.
For assessment of population representation, we used frequency analysis preceded by the coding of each patient to
the census tract of residence, roughly following the methods of Krieger (41).
To determine the consistency of indicators with external data sources and among each other,
we applied bivariate
correlation analysis to data aggregated to the ZIP-code and census-tract levels, respectively. For the ZIP-code level, we calculated the Pearson correlation coefficients between the OSHPD ZIP-code–level hospitalization rates and the Kaiser Permanente hospitalization rates, the Medi-Cal
fee-for-service rates, both combined, and the emergency department visit rates from both combined. For all
analyses, we used SAS version 8.02 (SAS Institute, Cary, NC).
Back to top
Results
The Medi-Cal fee-for-service and KPNC data combined to represent 226,383
children younger than 18 years, or 2.3 million person-months of information. Usable sample size was subsequently reduced in light of data quality considerations.
Data completeness
The hospitalization rate calculated for Medi-Cal fee-for-service seems to
be consistent with the rate calculated using the OSHPD data (Figure 3). Both
managed care subcontractors in the county, however, reported hospitalizations at
a substantially lower rate than either of these sources. Managed care rates of
emergency department visits, outpatient visits, and medication purchases also
consistently amounted to a small fraction of those calculated using Medi-Cal. For this reason, subsequent analyses excluded the managed care Medi-Cal population, reducing the total sample size to 176,789 children, or 1,656,266
person-months.
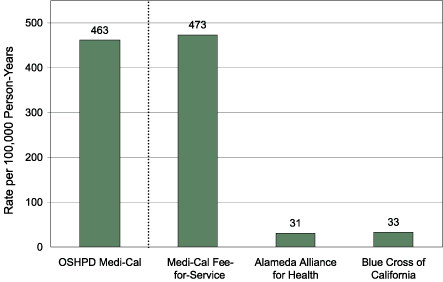
Figure 3. Hospitalization rates attributable to asthma (primary diagnosis only) among Medi-Cal beneficiaries during 2001 in Alameda County, California, by source of data. The Office of Statewide Healthcare Planning and Development (OSHPD) includes 100% of county residents receiving Medi-Cal benefits; the other three data sources include only their respective portions of this
population. The OSHPD rate is calculated for children aged 0 to 14 years; all other rates are for
children aged 0 to 17 years. [A tabular version of this chart is also available.]
Population representation
Comparison with fee-for-service beneficiaries revealed that managed care enrollees were more likely to be
younger than 18 years (61% compared with 21%), and among children, they were more likely to be enrolled in Medi-Cal for the entire 12 months of the year (55%
compared with 19%). For Kaiser Permanente data, we coded enrollees to their census tract of residence. In this manner, we could estimate the proportion of
the sample in each income stratum and compare these figures to those for the overall population using 2000 U.S. census data. The enrollee population shows high congruence with the
overall socioeconomic profile of the county, although it slightly underrepresents populations on either extreme of the continuum and overrepresents those in the middle (Figure 4).
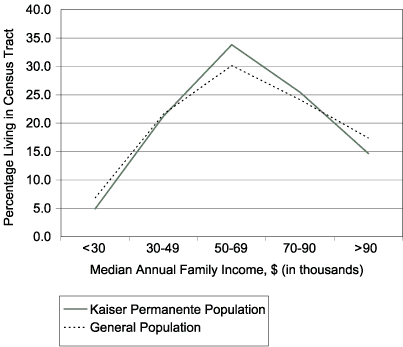
Figure 4. Population representation of Kaiser Permanente
of Northern California enrollee population, Alameda County, California, 2001. [A text description of this graph is also available.]
Consistency with external data
We assessed the validity of our data by comparing them with the OSHPD data set, from which hospitalization rates due to asthma
were available by ZIP code aggregated from 1998 to 2000. Neither
data set individually nor combined produced a picture of the geographic
distribution of asthma hospitalizations consistent with the
external data set
(Table 1). Among the county’s
health care providers, Kaiser Permanente hospitalization rates tend to be low (approximately 50% of the countywide rate in 2001); this reduction
seems to apply throughout the county,
because the variance across ZIP codes is much lower for KPNC enrollees (78.33) than it is for the population as a whole (1499.33). Given the large number of KPNC enrollees in the
data set, the low correlation of
hospitalization rates is likely to be because of this decrease in variance.
Rates of emergency department visits for the two data sets, however, were much more highly correlated with OSHPD asthma hospitalizations, and this correlation was higher for both of the
data sets combined (r = 0.8607, P < .001) than it was for either one alone. Thus, ZIP codes with high OSHPD
asthma hospitalization rates also tended to have high emergency department visit
rates as contained in our
data sets, which is
consistent with the notion that people in these areas may have more severe asthma, poorly controlled asthma, or both.
Internal consistency
We posited that the quality-of-care profile of each census tract within the county would fall along a spectrum of access and quality of care similar to that shown in Figure 1. Pearson correlation coefficients between the health
care use indicators at the census tract level are shown in
Table 2. The indicators closest to each other on the
spectrum of care (such as hospitalizations and emergency department
visits) in Figure 1 are indeed the most highly correlated, whereas those farther apart (such as hospitalizations and maintenance medication purchases) are progressively less correlated with each other.
After removal of incomplete records, the data set described a total of
311,774 asthma-related health care events among 1,656,266 person-months, not
including hospitalizations. The numbers of each event type are shown in
Table 3.
Back to top
Discussion
In this study, we evaluated the use of routinely collected health care use
data that could be used for an ongoing asthma surveillance system in
California. By focusing on administrative health care use data from private and
public sources, we were able to make available a range of asthma indicators much
broader than our previous hospitalization data alone. The use of
these databases also provides an additional advantage for surveillance because patient data are available
at the home-address level. We assessed the quality of the assembled data for completeness, population representation, consistency with external sources describing the distribution of asthma morbidity in the county, and internal consistency of the indicators with each other.
Data completeness
We knew at the outset that data completeness would be most open to questions concerning the state (Medicaid) data, and analysis showed that the key determinant of completeness was the
extent to which the beneficiary population was enrolled through managed care rather than fee-for-service systems. For Alameda County in 2001, fee-for-service enrollees had complete data through the state office in
Sacramento, whereas managed care enrollees did not. This finding has important implications for the development of asthma surveillance systems using Medicaid data, because 48 of the 53 U.S. states and territories with Medicaid programs use capitated managed care plans, with enrollment ranging from less than 10%
to up to 100% of the Medicaid population (42). The total proportion of Medicaid enrollees
served through managed care plans increased from 40% in 1996 to more than 60% in 2003 (42), and although some states have a uniform set of managed care options for all enrollees statewide, some (including California) vary by county (42). Under these arrangements, routine reporting of health care events and centralization by the state program is more likely to be incomplete or absent than under
traditional fee-for-service systems.
Population representation
Medicaid data provide a picture of health care use for the county’s lowest-income residents; our interest in working with Kaiser Permanente data, in contrast, stemmed from the possibility of representing health care use by people from
various socioeconomic strata. Consistent with the findings of Krieger in 1992 (41), we noted that the Kaiser Permanente data performed this role
well, although they slightly underrepresented individuals at either extreme of the spectrum and slightly overrepresented those in the middle. It is unclear to what extent the underrepresentation of these extremes may affect asthma surveillance; it is hoped that the inclusion of Medi-Cal enrollees may offset the underrepresentation of low-income communities. As with our findings on the
completeness of Medicaid managed care data, these findings should be expected to vary by county in California because multiple managed care entities control varying portions of the state health care market by region.
Our ability to assess the degree to which the fee-for-service portion of the Medi-Cal population was representative of the entire Medi-Cal population was limited. Racial and ethnic data recorded by Medi-Cal, when collected, are considered unreliable, although we could discern that managed care beneficiaries were more likely to be children, and among children they were more likely to be longer-term
beneficiaries. The process by which Medi-Cal beneficiaries are assigned to managed care or fee-for-service plans is complex, with choice of assignment contingent upon the administrative mechanism of eligibility. This finding suggests that episodic enrollment is more common among fee-for-service beneficiaries and that enrollment in managed care plans increases with the duration of eligibility.
Overall, the nonrandom nature of the study sample is a limitation; it precludes the calculation of countywide asthma-related health care use rates for comparison to state or national figures. On the other hand, one of every two child residents of the county is included in the
data set, or one in three if the figure is calculated using person-months. Because of this fact and the finding
that the data set had high external validity, we felt that the data set was useful for within-county sociodemographic and geographic comparisons.
External validity
Our ability to mirror the geographic patterns known from the OSHPD gold
standard data set using the health care event data sets could not be taken for
granted. On one hand, we had a private managed care data set with high overall
population representation but with a population for whom hospitalization rates
(but not emergency department visits) were known to be lower than the countywide average. On the other
hand, we had a public payer data set restricted to the communities with the
lowest incomes in the county — communities also known to experience a disproportionate share of hospitalizations due to asthma. It was not clear whether one of these
data sets, or both data sets combined, would most accurately reflect the overall geographic distribution of asthma events.
Neither the patient records for Medi-Cal, Kaiser Permanente, nor both
combined generated a geographic pattern of hospitalization rates particularly consistent with the OSHPD data. We believe this failure to be attributable
to the low hospitalization rates across the county for KPNC enrollees, which
compresses the variance of this variable. Rates of emergency department visits,
by contrast, correlated highly with OSHPD hospitalizations,
particularly for the combined data set. Part of the advantage of the combined
data set may originate from superior representation across ZIP codes of
socioeconomic strata since KPNC underrepresents families with very low incomes, who
are disproportionately represented among individuals hospitalized for asthma. Medi-Cal, by contrast, overrepresents those with low incomes but has beneficiaries in
fewer ZIP codes around the county. The combined data set may capitalize on the strengths of each. Finally, among children aged 0 to 14
years, the age distribution of the combined
data set more closely matches the general population than either one alone (data not shown).
Emergency department visits were highly correlated with hospitalization rates from OSHPD data
even though hospitalization rates and emergency department visit
rates, being separate phenomena, might not be expected to match each other
precisely. Because both hospitalizations and emergency department visits can be
expected to reflect the distribution of severe, poorly controlled asthma in the
county, however, it is logical that the geographic variations of each should
correlate somewhat. Furthermore, Kaiser Permanente, as a centrally coordinated
managed care organization, is able to steer patients away from hospital
admissions by encouraging extensive emergency department management before
making decisions to admit or discharge patients and implementing case management strategies
in the interests of both cost savings and quality of care. Because our
hospitalization rates are numerically driven by the Kaiser Permanente patients,
it makes sense that our hospitalization rates, but not our emergency department visit rates, would be depressed in both magnitude and variance relative to the countywide numbers from OSHPD.
Therefore, for analytical purposes (25), we focused on emergency department visits as our indicator of severe asthma, poorly controlled asthma, or both and excluded hospitalizations.
Countywide, rates of other asthma-related health care use were largely consistent with national data. Emergency
department visit rates based on the National Ambulatory Medical Care Survey (NAMCS) (1) for this age group are very close to the rates found in this study population. Medication purchasing rates reported from the Medical Expenditure Panel Survey (43) are also consistent with this population, although
the Alameda County population seems to purchase a greater proportion of maintenance medications than would be expected from the national numbers. Outpatient visit rates were also substantially higher in the Alameda County population than would be expected based on the national NAMCS numbers (1). Considering the large numbers of KPNC enrollees in the
data set, both of these differences may be
because of asthma management strategies promoting primary and preventive care within that organization.
Internal validity
The high degree of internal consistency of the health care use indicators
noted in this data set reinforced our view of these indicators as representing
various positions on a spectrum of asthma quality of care (Figure 1). Events
that would be expected to occur together (such as hospitalizations with
emergency department visits or symptom medication purchases with maintenance medication purchases) indeed did so,
and events associated with different standards of asthma primary care (such as hospitalizations and maintenance medication purchasing) did not. The ability to reflect this spectrum of quality
of care was a major objective for developing these
data sets because of stakeholder interest in comprehensively representing the problem of asthma in the county.
Other measures of data utility
Other authors have also discussed attributes for the assessment of data sources for health surveillance purposes (44). These include quantitative attributes such as sensitivity (completeness), representativeness, validity, and timeliness, as well as qualitative
attributes such as simplicity, acceptability, and cost. We directly assessed all of the qualitative attributes in
this study except
for timeliness. Medi-Cal patient encounter data have taken an average of 4 months for processing before becoming centrally available through the Medical Care Statistics Section
of the California Department of Health Services, although the speed of this process appears to be increasing. One problem with receiving data is the time needed to
screen it for quality assurance purposes. Sacrifices in data quality may be necessary to increase the value of the data for surveillance with the understanding that surveillance data results are preliminary. Similarly, it is the experience of KPNC’s
Division of Research that a lead time of approximately 6 months is required before complete patient encounter data are available. This provider is currently developing a comprehensive electronic medical record
system, however, which is expected to make data available almost in real-time.
External factors affecting data quality
The potential to adapt the data sources for surveillance, particularly
outside of the demonstration area of Alameda County, is affected by several
issues. A primary requirement for this approach to be adopted elsewhere would be
the ability to incorporate private sources of data that represent a large market share of health services coverage in that location. Similarly, the
proportion of Medi-Cal data that is fee-for-service or managed care varies by county. We expect that these two issues will play the greatest role in determining the extent to which similar systems could be implemented in
other localities in the state or nationally.
Automated geocoding and address verification systems that were developed for this project could be used in other counties to make the analytic process more efficient. Similarly, the adoption of data standards by all managed care entities would be of great value for surveillance.
With collaborations among private local providers of health care use data, data
costs could be minimal.
However, there are additional costs for data processing, data visualization and analysis, hardware, software, personnel, and data dissemination.
Finally, in contrast to concerns expressed by many colleagues, the provisions of the Health Insurance Portability and Accountability Act of 1996 (HIPAA) did not constitute an obstacle for the conduct of this work. The fundamentally research-oriented objectives of the project partly explain this lack of difficulty, as did the absence of intent to contact any of the patients described in the
database. Safeguards for the protection of confidential information were
prepared in advance, and the use of density estimation mapping for the visualization of the data (25) was seen as a further protection of confidentiality. Full authorization from the state Department of Health Services Committee for the Protection of Human Subjects was sought and obtained before the project began.
We constructed this working data set to increase asthma surveillance capacity to facilitate clinical and public health interventions. For two reasons, the result represents a substantial step forward. The first is the fact that we were able to incorporate a range of
asthma-related indicator variables into a single
data set with ample statistical power (Table 3), meeting
a need expressed by several researchers (10,24,26). Furthermore, because of the availability of patient address data, we enable high-resolution geographic analysis of asthma in the county, as demonstrated in our companion article (25). Through this activity, we are able to identify subpopulations facing increased vulnerability to asthma and barriers to care, quantify socioeconomic disparities in
patterns of asthma care, and formulate hypotheses about local sources of pollution or other environmental contributors to the impact of disease.
Back to top
Acknowledgments
This work was supported through a grant from the Centers for Disease Control and Prevention (#U50/CCU922449).
Back to top
Author Information
Corresponding Author: Paul B. English, California Department of Health Services, Environmental Health Investigations Branch, 850 Marina Bay Pkwy, Bldg P, 3rd floor,
Richmond, CA 94804. Telephone: 510-620-3684. E-mail: penglish@dhs.ca.gov.
Author Affiliations: Eric M. Roberts, California Department of Health Services, Environmental Health Investigations Branch; Stephen K. Van den Eeden, G. Thomas Ray, Kaiser Permanente of Northern California, Division of Research,
Oakland, Calif.
Back to top
References
- Mannino DM, Homa DM, Akinbami LJ, Moorman JE, Gwynn C, Redd SC.
Surveillance for asthma — United States, 1980-1999. MMWR Surveill Summ
2002;51(1):1-13.
- Boss LP, Kreutzer RA, Luttinger D, Leighton J, Wilcox K, Redd SC.
The public health surveillance of asthma. J Asthma 2001;38(1):83-9.
- Centers for Disease Control and Prevention (CDC).
Self-reported asthma in adults and proxy-reported asthma in
children — Washington, 1997-1998. MMWR Morb Mortal Wkly Rep
1999;48(40):918-20.
- Koutsavlis AT, Kosatsky T, Cox J, Goyer E.
Reporting childhood asthma: why? Why not? What else? J Public Health
Policy 2001;22(3):311-9.
- Cunningham J, Dockery DW, Speizer FE.
Race, asthma, and persistent wheeze in Philadelphia schoolchildren. Am J
Public Health 1996;86(10):1406-9.
- Ledogar RJ, Penchaszadeh A, Iglesias Garden CC, Garden Acosta L.
Asthma and Latino cultures: different prevalence reported among groups sharing
the same environment. Am J Public Health 2000;90(6):929-35.
- Roberts EM.
Racial and ethnic disparities in childhood asthma diagnosis: the role of
clinical findings. J Natl Med Assoc 2002;94(4):215-23.
- Yeatts K, Davis KJ, Sotir M, Herget C, Shy C.
Who gets diagnosed with asthma? Frequent wheeze among adolescents with and without a diagnosis of asthma. Pediatrics 2003;111(5
Pt 1):1046-54.
- Thacker SB, Stroup DF, Parrish RG, Anderson HA.
Surveillance in environmental public health: issues, systems, and sources.
[Published erratum in: Am J Public Health 1996;86(11):1526]. Am J Public
Health 1996;86(5):633-8.
- Lanphear BP, Gergen PJ.
Invited commentary: asthma surveillance in US children. Am J Epidemiol
2003;158(2):105-7; discussion 108-9.
- Centers for Disease Control and Prevention (CDC).
Asthma surveillance programs in public health departments — United States.
MMWR Morb Mortal Wkly Rep 1996;45(37):802-4.
- Centers for Disease Control and Prevention (CDC).
Monitoring environmental disease — United States, 1997. MMWR Morb Mortal
Wkly Rep 1998;47(25):522-5.
- Deprez RD, Asdigian NL, Oliver LC, Anderson N, Caldwell E, Baggott LA.
Development of a prototype system for statewide asthma surveillance. Am J
Public Health 2002;92(12):1946-51.
- Community Action to Fight Asthma. Reducing the risk for California's children.
Oakland (CA): CAFA News; 2004. Available from: URL: http://www.calendow.org/reference/publications/pdf/ disparities/TCE0622-2002_CAFA_news_Comm.pdf.*
- Kunzli N, McConnell R, Bates D, Bastain T, Hricko A, Lurmann F, et al.
Breathless in Los Angeles: the exhausting search for clean air. Am J
Public Health 2003;93(9):1494-9.
- McAvoy PV, Driscoll MB, Gramling BJ.
Integrating the environment, the economy, and community health: a
community
health center's initiative to link health benefits to smart growth. Am J
Public Health 2004;94(4):525-7.
- Fisher EB, Strunk RC, Sussman LK, Sykes RK, Walker MS.
Community organization to reduce the need for acute care for asthma among
African American children in low-income neighborhoods: the Neighborhood Asthma
Coalition. Pediatrics 2004;114(1):116-23.
- White MC, Berger-Frank SA, Middleton DC, Falk H.
Addressing community concerns about asthma and air toxics. Environ Health
Perspect 2002;110 Suppl 4:561-4.
- Glad JA, Kotchian SB, Barron GM.
Developing a local comprehensive environment and health tracking system: using
what we know to improve health and the environment. J Environ Health
2004;66(10):9-14, 28.
- Brown CM, Anderson HA, Etzel RA.
Asthma. The
states' challenge. Public Health Rep 1997;112(3):198-205.
- U.S. Department of Health and Human Services. Healthy People 2010: understanding and improving health. 2nd ed. Washington (DC): U.S. Government Printing Office; 2000.
- Bacharier LB, Strunk RC, Mauger D, White D, Lemanske RF Jr, Sorkness CA.
Classifying asthma severity in children: mismatch between symptoms, medication
use, and lung function. Am J Respir Crit Care Med 2004;170(4):426-32.
- Morris RD, Naumova EN, Goldring J, Hersch M, Munasinghe RL, Anderson H.
Childhood asthma surveillance using computerized billing records: a pilot
study. Public Health Rep 1997;112(6):506-12.
- Ungar WJ, Chapman KR, Santos MT.
Assessment of a medication-based asthma index for population research. Am
J Respir Crit Care Med 2002;165(2):190-4.
- Roberts EM, English PB, Wong M, Wolff C, Valdez S, Van den Eeden SK, et
al. Progress in pediatric asthma surveillance II: geospatial patterns of
asthma in Alameda County, California. Prev Chronic Dis [serial online] 2006
Jul.
- Centers for Disease Control and Prevention. Environmental public health
indicators project [Internet]. Atlanta (GA): Centers for Disease Control and
Prevention;2005. Available from: URL: http://www.cdc.gov/nceh/indicators/.
- Flores G, Abreu M, Chaisson CE, Sun D.
Keeping children out of hospitals: parents' and physicians' perspectives on
how pediatric hospitalizations for ambulatory care-sensitive conditions can be
avoided. Pediatrics 2003;112(5):1021-30.
- Parker JD, Schoendorf KC.
Variation in hospital discharges for ambulatory care-sensitive conditions
among children. Pediatrics 2000;106(4 Suppl):942-8.
- California Department of Health Services. California County Asthma
Hospitalization Chart Book. Oakland (CA): California Department of Health Services;
2000. Available from: URL: http://www.dhs.ca.gov/ehib/EHIB2/PDF/Hosp%20Chart%20Book%202000.pdf.
- Oyana TJ, Rogerson P, Lwebuga-Mukasa JS.
Geographic clustering of adult asthma hospitalization and residential exposure
to pollution at a United States–Canada border crossing. Am J Public Health
2004;94(7):1250-7.
- U.S. Department of Health and Human Services. National Asthma Education
and Prevention Program expert panel report 2: Guidelines for the diagnosis and
management of asthma. Bethesda (MD): U.S. Department of Health and Human
Services; 1997. Available from: URL: http://www.nhlbi.nih.gov/guidelines/asthma/asthgdln.htm.
- Iron KS, Manuel DG, Williams J.
Using a linked data set to determine the factors associated with utilization
and costs of family physician services in Ontario: effects of self-reported
chronic conditions. Chronic Dis Can 2003;24(4):124-32.
- Park RM.
Medical insurance claims and surveillance for occupational disease: analysis
of respiratory, cardiac, and cancer outcomes in auto industry tool grinding
operations. J Occup Environ Med 2001;43(4):335-46.
- Liese B, Mundt KA, Dell LD, Nagy L, Demure B.
Medical insurance claims associated with international business travel.
Occup Environ Med 1997;54(7):499-503.
- Milton DK, Solomon GM, Rosiello RA, Herrick RF.
Risk and incidence of asthma attributable to occupational exposure among HMO
members. Am J Ind Med 1998;33(1):1-10.
- Buescher PA, Jones-Vessey K.
Using Medicaid data to estimate state- and county-level prevalence of asthma among low-income children.
Matern Child Health J 1999;3(4):211-6.
- Neutra RR. Computer geographic analysis: a commentary on its use and misuse in public health.
In: Lawson AB, Biggeri A, Böhning D, editors. Disease mapping and risk
assessment for public health. Chichester (UK): John Wiley & Sons, Ltd; 1999. p. 311-19.
- Davis RL, Marcuse E, Black S, Shinefield H, Givens B, Schwalbe J, et al.
MMR2 immunization at 4 to 5 years and 10 to 12 years of age: a comparison of
adverse clinical events after immunization in the Vaccine Safety Datalink
project. The Vaccine Safety Datalink Team. Pediatrics 1997;100(5):767-71.
- Schoen EJ, Colby CJ, Ray GT.
Newborn circumcision decreases incidence and costs of urinary tract infections
during the first year of life. Pediatrics 2000;105(4 Pt 1):789-93.
-
National Asthma Education and Prevention Program expert panel report:
guidelines for the diagnosis and management of asthma — update on selected
topics 2002. Bethesda (MD): U.S. Department of Health and Human Services;
2002. Available from: URL: http://www.nhlbi.nih.gov/guidelines/asthma/index.htm.
- Krieger N.
Overcoming the absence of socioeconomic data in medical records: validation
and application of a census-based methodology. Am J Public Health
1992;82(5):703-10.
- Centers for Medicaid and Medicaid Services.
2003 Medicaid managed care enrollment report: summary statistics as of June 30,
2003 [Internet]. Baltimore (MD): Centers for Medicaid and Medicaid Services;
2004 [cited 2004 Dec 31]. Available from: URL: http://www.cms.hhs.gov/MedicaidDataSourcesGenInfo/ Downloads/mmcer03.pdf
- Roberts EM.
Does your child have asthma? Parent reports and medication use for pediatric
asthma. Arch Pediatr Adolesc Med 2003;157(5):449-55.
- Teutsch S, Churchill R. Principles and practice of public health surveillance. Oxford (UK): Oxford University Press; 1994.
Back to top
|
|
