 |
|
|
|
|
|
|
| ||||||||||
|
|
|
|
|
|
|
||||
| ||||||||||
|
|
|
|
|
Persons using assistive technology might not be able to fully access information in this file. For assistance, please send e-mail to: mmwrq@cdc.gov. Type 508 Accommodation and the title of the report in the subject line of e-mail. REACH 2010 Surveillance for Health Status in Minority Communities --- United States, 2001--2002Youlian Liao, M.D. Corresponding author: Youlian Liao, M.D., Epidemiologist, CDC/NCCDPHP/DACH, 1600 Clifton Rd., NE, MS K-30, Atlanta, GA 30333; Telephone: 770-488-5299; Fax: 770-488-5974; E-mail: ycl1@cdc.gov. AbstractProblem/Condition: The U.S. population continues to diversify, and certain racial/ethnic minorities are growing at a substantially more rapid pace than the majority population. Limited large-scale population-based surveys and surveillance systems are designed to monitor the health status of minority populations. The Racial and Ethnic Approaches to Community Health (REACH) 2010 Risk Factor Survey is conducted annually in minority communities in the United States. The survey focuses on four minority populations (blacks, Hispanics, Asians/Pacific Islanders [A/PIs], and American Indians). Reporting Period Covered: 2001--2002. Description of System: Telephone (n = 18 communities) and face-to-face (n = 3 communities) interviews were conducted in 21 communities located in 14 states (Alabama, California, Georgia, Illinois, Louisiana, Massachusetts, Michigan, New York, North Carolina, Oklahoma, South Carolina, Tennessee, Texas, and Washington). An average of 1,000 minority residents aged >18 years in each community was sampled. Interviews were administered in English, Spanish, Vietnamese, Khmer, or Mandarin Chinese. The median response rate for household screenings was 74.0% for households that were reached and 72.0% for family members interviewed. The self-reported data from the community were compared with data derived from the Behavioral Risk Factor Surveillance System (BRFSS) for the metropolitan/micropolitan statistical area (MMSA) or the state where the community was located and compared with national estimates from BRFSS. Results: Reported education level and household income were markedly lower in minority communities than the general population living in the comparison MMSA or state. More minorities reported being in fair or poor health, but they did not see a doctor because of the cost. Substantial variations were observed in the prevalence of health-risk factors and selected chronic conditions among minority populations and in communities within the same racial/ethnic minority. The median prevalence of obesity among A/PI men and women was 2.9% and 3.6%, respectively, whereas 39.2% and 37.5% of American Indian men and women were obese, respectively. Cigarette smoking was common in American Indian communities, with a median of 42.2% for men and 36.7% for women. Compared with the national level, fewer minority adults reported eating >5 fruits and vegetables daily and met recommendations for moderate or vigorous leisure-time physical activity. American Indian communities had a high prevalence of self-reported cardiovascular disease, hypertension, high blood cholesterol, and diabetes. A high prevalence of hypertension and diabetes was also observed in black communities (32.0% and 10.9%, respectively, for men and 40.4% and 14.3%, respectively, for women). Compared with the general U.S. population, a substantially lower percentage of Hispanics and A/PIs had reported receiving preventive services (e.g., cholesterol screenings; glycosylated hemoglobin tests and foot examinations for patients with diabetes; mammograms and Papanicolaou smear tests; and vaccination for influenza and pneumonia among adults aged >65 years). Interpretation: Data from the REACH 2010 Risk Factor Survey demonstrate that residents in the minority communities bear greater risks for disease compared with the general population living in the same MMSA or state. Substantial variations in the prevalence of risk factors, chronic conditions, and use of preventive services among different minority populations and in communities within the same racial/ethnic population provide opportunities for public health interventions. These variations also indicate that different racial/ethnic populations and different communities should have different priorities in eliminating health disparities. Public Health Actions: The continuous surveillance of health status in minority communities is necessary so that culturally sensitive prevention strategies can be tailored to these communities and program interventions evaluated. IntroductionPersons who are racial/ethnic minorities account for increasing proportions of the U.S. population. In the 2000 Census, one of every four U.S. residents reported themselves as a racial or ethnic minority (1). By 2010, one of every three persons in the United States will be a racial/ethnic minority. By 2050, the proportion will probably continue to increase to one in two persons (2). Minorities have poorer health than majority populations. Achieving a healthy nation is impossible without healthy minority populations and without eliminating racial/ethnic health disparities. Individual health is closely linked to the health of the community and environment in which persons live, work, and play (3). The underlying premise of Healthy People 2010 (3) is that the health of a person is inseparable from the health of the larger community and that the health of every community in every state/territory determines the overall health status of the nation. Therefore, the vision for Healthy People 2010 is Healthy People in Healthy Communities (3). Multiple population-based surveys have been conducted in the states and nation (e.g., the National Health Interview Survey [NHIS], the National Health and Nutrition Examination Survey [NHANES], and the Behavioral Risk Factor Surveillance System [BRFSS]). These surveys were designed to collect data in nation- or statewide probability samples to obtain national or state-level estimates. They were not designed to monitor the health status of persons at the community level or to target minority communities. As a result, surveillance data for racial/ethnic minorities is often lacking. In 2001, to monitor the health of racial/ethnic minority populations, CDC began to conduct annual Risk Factor Surveys in minority communities. These surveys were part of the project, Racial and Ethnic Approaches to Community Health (REACH) 2010. REACH 2010, launched in 1999, supports community coalitions in designing, implementing, and evaluating community-driven strategies to eliminate health disparities in six priority areas: cardiovascular diseases, diabetes, human immunodeficiency virus (HIV) infection and acquired immunodeficiency syndrome (AIDS), infant mortality, breast and cervical cancer screening and management, and child and adult immunization. The racial/ethnic groups targeted by REACH 2010 are blacks, Hispanics, Asians/Pacific Islanders (A/PIs), and American Indians/Alaska Natives. This intervention project now includes 42 minority communities across the United States. As a part of surveillance and project evaluation, CDC contracted with the National Organization for Research at the University of Chicago (NORC) to conduct annual REACH 2010 Risk Factor Surveys in communities targeting cardiovascular diseases, diabetes, and breast and cervical cancer. Data from the first survey year (June 2001--August 2002) in 21 communities are included in this report. Although the Alaska Native community was one of the REACH 2010 intervention communities, they did not participate in the Risk Factor Survey for the period covered and therefore were excluded from this report. MethodsSurvey CommunitiesTarget Geography The 21 communities were located in 14 states (Alabama, California, Georgia, Illinois, Louisiana, Massachusetts, Michigan, New York, North Carolina, Oklahoma, South Carolina, Tennessee, Texas, and Washington). Five communities had multiple ethnic populations. The survey information was collected from 14 black populations composed of 10,953 persons; seven Hispanic populations, 4,257 persons; four A/PI populations, 4,204 persons; and two American Indian populations, 1,791 persons (Table 1). The survey target areas and populations were consistent with the REACH 2010 intervention program. The areas included specific counties, census tracts, zip codes, neighborhood areas, or tribal areas. The geographic boundaries for the survey were defined by NORC in consultation with the community coalition. Sampling Design Sample designs were customized for each of the 21 communities, based on geography, racial/ethnic density, and expected telephone coverage. In 18 communities (85.7%) where telephone coverage was >80.0%, interviews were conducted by telephone. Face-to-face interviews were conducted in the other three communities (14.3%) (Lowell, Massachusetts; Lower Rio Grande Valley, South Texas; and Jackson and Swain Counties, North Carolina), where the telephone coverage was either low or inconclusive or where cooperation by telephone was expected to be difficult. Among the communities interviewed by telephone, three types of sampling frames were used: 1) random-digit--dialing (RDD), six communities; 2) dual frame (RDD and listed telephone numbers), 11 communities; and 3) listed telephone numbers only, targeting certain ethnic surnames, one community. In the communities where interviews were conducted in person, an area probability sample was drawn in two communities, and a list sample from an emergency services list of addresses was drawn in one community. A sample from eligible households was drawn for the survey, and in each community, an average of 1,000 minority residents aged >18 years was interviewed. A total of 21,800 adults completed the survey. The median response rate for household screening was 74.0% (range: 60.0%--99.0%) for the households that were reached and 72.0% (range: 64.0%--93.0%) for the family members that were interviewed among the eligible members. Questionnaires Uniform screening and interview questionnaires were used for all communities and were administered in English,
Spanish, Vietnamese, Khmer, or Mandarin Chinese. The percentage of interviews conducted in each language was 74.1%, English; 13.0%, Spanish; 8.9%, Vietnamese; 3.6%, Khmer; and 0.4%, Mandarin Chinese. The household screening interview
was conducted to ascertain the geographic eligibility of each sampled household and the racial/ethnic eligibility of each
household member aged >18 years. All eligible women aged 40--64 years and a maximum of two other adults in each household were selected for the household member interview. The questionnaire included questions regarding respondents' health
status; health-care access; self-reported height and weight; vegetable and fruit intake; leisure-time physical activity; cigarette smoking; awareness of hypertension, cholesterol, and cardiovascular disease; diabetes and diabetes care; and receipt of preventive services (e.g., mammography, Papanicolaou [Pap] smear test, and influenza and pneumococcal vaccination). The questions
were identical to those used in BRFSS.
Data from 21 communities were compared with those from BRFSS. BRFSS is a cross-sectional telephone survey
operated monthly by state health departments with assistance from CDC
(4). The survey uses a multistage design based on
RDD methods to gather a representative sample from each state's noninstitutionalized civilian residents aged
>18 years. Typically, BRFSS reports state- and nationwide estimates. However, since 2000, BRFSS has had sufficient samples to produce city- or area-level estimates for selected metropolitan/micropolitan statistical areas (MMSA) with populations
>1 million and with >300 survey respondents. For 16 communities, data from each community were compared with those from BRFSS in
MMSA where the community was located (Table 1). For the remaining five communities that could not be matched to
specific MMSA, state-level BRFSS data were used. Data for the minority populations were also compared with the national estimates for all states/territories and the District of Columbia with data available in BRFSS.
The prevalence of risk factors, chronic conditions, and access to and use of preventive services was examined by community, racial/ethnic population, and sex. Because sample sizes were limited, data for men and women were combined in the analyses for the following variables: glycosylated hemoglobin (HbA1C) tests and foot and eye examinations among persons with diabetes and vaccinations among adults (aged >65 years). In the calculation of prevalence, persons who replied "don't know" or who refused to answer the questions were excluded from the denominator. In this report, estimates for any specific subpopulation that had <30 respondents were considered unstable and are not presented. The racial/ethnic- and sex-specific median in communities and the median in all states/territories from BRFSS were calculated. For all states/territories and the District of Columbia, where data were available, the medians were used to represent the national estimate. To increase the sample size of respondents in MMSA, data from the 2000 and 2001 survey years were combined. When the questions were not asked in both the 2000 and 2001 BRFSS, estimates were based on data from 1 year (i.e., 2000: fruit and vegetable consumption, and mammogram and Pap smear tests; and 2001: physical activity, high blood pressure, and blood cholesterol screening). State comparison data were from the 2001 BRFSS. If questions from the topics (e.g., barrier to obtaining health care, fruit and vegetable consumption, and mammogram and Pap smear tests) were not asked during 2001, data from 2000 were used. Data were weighted to represent the communities surveyed. Survey Data Analysis (SUDAAN)
(5) was used in the analyses to account for the complex sampling design and to calculate the 95% confidence intervals for both the REACH 2010 data and BRFSS. No formal statistical tests were performed. By using MMSA or the state BRFSS as the standard, a
percentage estimated for a community can be described as being higher than the standard, if the percentage in MMSA or the state
BRFSS is lower than the lower limit of the confidence interval of the percentage in the community. Conversely, the
percentage estimated for the community can be described as being lower than the standard, if the percentage in MMSA or the state BRFSS is higher than the upper limit of the confidence interval. Blank spaces in the tables indicate that data are not available for the specific populations.
Education Among men, the median percentage of respondents who reported having less than a high school education ranged from 19.1% in A/PI communities to 50.3% in Hispanic communities (Table 2). Among women, the median percentage ranged from 19.3% in black communities to 46.4% in Hispanic communities. With limited exceptions (e.g., blacks from Los Angeles County), a substantially higher percentage of minority men and women in the surveyed communities reported having less than a high school education compared with BRFSS respondents from the same MMSA or state (Table 2). Among the minority populations, Hispanics reported the lowest education level. Within racial/ethnic populations, levels of education were typically similar among men and women, except among A/PI women who had disproportionately lower levels of education compared with A/PI men (Table 2). Household Income The median percentage of men who reported having annual household incomes of <$25,000 ranged from 44.0% in American Indian communities to 62.8% in Hispanic communities (Table 3). The median percentage of women who reported having annual household incomes of <$25,000 ranged from 51.6% in American Indian communities to 70.9% in Hispanic communities. Low income was substantially more prevalent among minority communities than the comparison communities in MMSA or the state 2001 BRFSS. Hispanics had the highest percentages of persons with incomes of <$25,000, more than twice the national level (Table 3). Cost as a Barrier To Obtaining Health Care Among men, the median percentage of adults who reported that they had needed to see a doctor during the previous
12 months but had not because of the cost, ranged from 11.1% in American Indian communities to 22.7% in
Hispanic communities (Table 4). Among women, the median percentage ranged from 13.3% in A/PI communities to 29.9%
in Hispanic communities. The national median percentage of the 2000 state BRFSS was 8.1% and 12.0% among men
and women, respectively. MMSA data were not available. The highest percentage of persons reporting a cost barrier to
obtaining health care were Hispanics. The percentages of adults who had not seen a doctor because of the cost were 2--5 times higher in Hispanic communities compared with their corresponding states (Table 4).
Obesity Obesity was defined as body mass index >30 kg/m2, calculated from self-reported height and weight. The median prevalence of obesity among men ranged from 2.9% in A/PI communities to 39.2% in American Indian communities (Table 5). The median among women ranged from 3.6% in A/PI communities to 38.0% in black communities. The prevalence of obesity was substantially higher among both men and women in American Indian communities and among women in black communities compared with that in the comparison MMSA or state 2001 BRFSS (Table 5). Overall, more than one third of American Indian men and women and black women were obese in the surveyed communities, whereas approximately one fifth of adults were obese on the national level. Obesity was rare in A/PI communities (median: 2.9% and 3.6% among men and women, respectively) (Table 5). Cigarette Smoking The median percentage of cigarette smoking (those who had ever smoked >100 cigarettes and those who currently smoke) among men ranged from 28.6% in black communities to 42.2% in American Indian communities (Table 6). The median among women ranged from 3.3% in A/PI communities to 36.7% in American Indian communities. Smoking was widespread in American Indian communities and was also prevalent in certain black communities (e.g., Lawndale, Chicago [54.2%]). Women from Hispanic or A/PI communities were less likely to smoke compared with their male counterparts. A/PI men had a high prevalence of smoking (median: 30.5%) compared with the national median (25.5%) (Table 6). Fruit and Vegetable Intake Consumption of fruits and vegetables was calculated from six questions regarding the intake of fruit juices, fruit, green salad, potatoes, carrots, and other vegetables. A national educational program has advocated eating >5 servings of fruits and vegetables daily (6). The median percentage of men who reported eating >5 fruits and vegetables daily ranged from 11.9% in A/PI communities to 18.2% in black communities (Table 7). The median among women ranged from 18.4% in A/PI communities to 25.5% in black communities. The percentage of blacks who reported eating >5 fruits and vegetables daily ranged from 7.2% to 25.3% among men and 19.2% to 43.1% among women. The medians in black communities (18.2% among men and 25.5% among women, respectively) were comparable to those among 51 states/territories and the District of Columbia in the 2000 BRFSS (18.9% among men and 26.9% among women, respectively). Fewer women in the Hispanic communities and fewer men and women from the A/PI communities met the recommendation than respondents from comparison MMSA or states in the 2000 BRFSS. Overall, over three fourths of minorities were not eating the recommended level of fruits and vegetables daily (Table 7). Leisure-Time Physical Activity Respondents were asked to recall their overall frequency and duration of time spent in moderate activities (e.g.,
brisk walking, bicycling, vacuuming, or gardening) and in vigorous activities (e.g., running, aerobics, or heavy yard work) in a typical week. Current guidelines recommend participating in either moderate physical activity
>30 minutes/day, 5 days/week, or vigorous physical activity
>20 minutes/day, 3 days/week (7,8). The median percentage of men who met physical
activity recommendations ranged from 24.1% in A/PI communities to 42.9% in American Indian communities (Table 8).
The median among women ranged from 17.3% in A/PI communities to 35.9% in American Indian communities. With
the exception of two communities, the percentages of adults who reported participating in recommended activity levels in
the REACH 2010 minority communities were consistently lower than those of comparison MMSA or states in the 2001
BRFSS. At the national level, among 53 states/territories and the District of Columbia, fewer than one half of the adults met the physical activity recommendations (49.6% among men and 42.9% among women, respectively). Even fewer persons
in minority communities met the recommendations (Table 8).
Perceived Health Status Respondents were asked to rate their own general health as either excellent, very good, good, fair, or poor. The median percentage of men who reported fair or poor health ranged from 19.7% in black communities to 30.8% in Hispanic communities (Table 9). The median among women ranged from 23.9% in black communities to 36.2% in Hispanic communities. For the majority of the communities, the percentage of adults who reported fair or poor health was substantially higher among the minority communities compared with that in MMSA or state where the community was located. Among the four racial/ethnic populations, A/PIs and Hispanics had the highest prevalence of self-rated fair or poor health (Table 9). Cardiovascular Diseases Cardiovascular diseases were defined as having been told by a doctor that the respondent had any of the following conditions: heart attack or myocardial infarction, angina or coronary heart disease, or stroke. No comparable data were available from BRFSS at the MMSA level. Questions regarding cardiovascular disease were asked in 19 states and the District of Columbia in the 2001 BRFSS. The combined data from these states and the District of Columbia were used as the national estimate. The median prevalence of cardiovascular disease among men ranged from 7.6% among Hispanic and A/PI communities to 16.7% in American Indian communities (Table 10). The median among women ranged from 5.0% in Hispanic communities to 13.1% in American Indian communities. The prevalence of cardiovascular diseases among American Indian men and women (16.7% and 13.1%, respectively) was substantially higher than the median of 19 states and the District of Columbia (9.1% and 6.9%, respectively). Hispanics and A/PIs had lower prevalence than the median of the 19 states and the District of Columbia. Typically, blacks had a similar prevalence of cardiovascular diseases as those in the comparison states or the median of 19 states and the District of Columbia (Table 10). Hypertension The median prevalence of self-reported high blood pressure among men ranged from 14.9% in A/PI communities to 38.2% in American Indian communities (Table 11). The median among women ranged from 16.6% in A/PI communities to 40.4% in black communities. Prevalence of high blood pressure was substantially higher among black and American Indian communities than in the corresponding MMSA or states in the 2001 BRFSS. High blood pressure was less prevalent in A/PI communities (median: 14.9% among men and 16.6% among women) (Table 11). Percentages of respondents who reported having high blood pressure and were taking antihypertensive medication are presented (Table 12). The median percentage among men ranged from 53.4% in Hispanic communities to 69.6% in black communities. The median among women ranged from 41.6% in Hispanic communities to 77.0% in black communities. The prevalence among Hispanics, especially among women, was substantially lower than those in the corresponding MMSA and states in the 2001 BRFSS. American Indians also had a lower percentage of respondents taking antihypertensive medications compared with the state BRFSS data. The medians among men and women in black communities (69.6% and 77.0%, respectively) were comparable to the national medians among men and women (66.9% and 76.7%, respectively) in 53 states/territories and the District of Columbia in 2001 (Table 12). High Blood Cholesterol The percentages of respondents who reported ever having their blood cholesterol checked and having been told by a health professional that they had high blood cholesterol are presented in this report (Table 13). The median percentage among men ranged from 30.3% in black communities to 38.1% in American Indian communities. The median among women ranged from 23.7% in A/PI communities to 34.9% in black communities. In the majority of the communities, American Indians and black women had a substantially higher prevalence of high blood cholesterol than that in the comparison MMSA or states in the 2001 BRFSS. The median prevalences of high blood cholesterol among black men (30.3%), Hispanic men (33.3%) and women (29.9%), and A/PI men (31.2%) were comparable to those among men and women in 53 states/territories and the District of Columbia in 2001 (31.2% and 29.7%, respectively). A/PI women had a lower prevalence of high blood cholesterol (median: 23.7%) (Table 13). Diabetes The median percentages of men who reported ever having been told by a doctor that they have diabetes ranged from 5.3% in Hispanic and A/PI communities to 16.2% in American Indian communities (Table 14). The median prevalence of diabetes (excluding gestational diabetes) among women ranged from 4.7% in A/PI communities to 19.5% in American
Indian communities. The prevalence of diabetes in black and American Indian communities was typically substantially higher than those in the comparison MMSA and states in the 2001 BRFSS. The median prevalence of diabetes in Hispanic (5.3%
among men and 5.4% among women) and A/PI communities (5.3% among men and 4.7% among women) was lower than
the national medians among 53 states/territories and the District of Columbia in 2001 (6.6% among men and 6.5%
among women) (Table 14).
Blood Cholesterol Checked The median percentages of men who reported ever having their blood cholesterol checked ranged from 39.1% in Hispanic communities to 73.4% in black communities (Table 15). The median among women ranged from 50.1% in Hispanic communities to 79.5% in black communities. The percentages of cholesterol screening were substantially lower in Hispanic communities than those in the comparison MMSA and the states in the 2001 BRFSS. Although A/PIs and American Indians were substantially more likely to be screened than Hispanics, they were still less likely to be screened than the general population. The medians in black communities (73.4% among men and 79.5% among women) were similar to those among 53 states/territories and the District of Columbia in the 2001 BRFSS (75.0% among men and 79.5% among women) (Table 15). Preventive Care Among Persons with Diabetes Respondents who reported having diabetes were asked three additional questions regarding diabetes preventive-care practices during the previous year (i.e., whether they had had 1] an HbA1C test, 2] their feet checked for any sores or irritations, and 3] a dilated eye examination). In the 2001 BRFSS, similar questions were asked in 41 states and the District of Columbia, but comparable data were not available at the MMSA level. Data from the states were used as the comparisons. The analyses were performed among persons with diabetes. HbA1C. The median percentage of adults with diabetes who reported having had an HbA1C test within the previous year ranged from 67.2% in A/PI communities to 80.8% in American Indian communities (Table 16). The median prevalence was lower for A/PIs and higher for blacks and American Indians compared with that among the 41 states and the District of Columbia in the 2001 BRFSS (72.4%). Foot Exam. The median percentage of adults with diabetes who reported having had their feet checked by a health professional within the previous year ranged from 42.1% in A/PI communities to 78.2% in American Indian communities (Table 17). The median prevalence was lower for A/PI and Hispanic communities and higher for American Indian communities compared with that among the respondents from the 2001 BRFSS in 41 states and the District of Columbia (70.9%). The median in black communities (71.3%) was similar to that of the 41 states and the District of Columbia (70.9%). Dilated Eye Exam. The median percentage of adults with diabetes who reported having had a dilated eye exam ranged from 63.4% in American Indian communities to 82.7% in A/PI communities (Table 18). The median prevalence was lower for American Indian communities and higher for A/PI communities compared with that among 41 states and the District of Columbia in the 2001 BRFSS (71.7%). The median percentage among black (72.2%) and Hispanic (71.9%) communities was comparable to the national median (Table 18). Mammography The median percentage of women aged >50 years who reported having had a mammogram during the previous 2 years ranged from 70.2% in Hispanic communities to 85.4% among black communities (Table 19). Median mammography screening rates were lower among Hispanic and A/PI communities compared with the respondents from the 2000 MMSA or the state BRFSS. The median in black communities (85.4%) was higher than that in the 2000 BRFSS from 51 states/territories and the District of Columbia (79.1%) (Table 19). Pap Smear Test The median percentage of women with an intact uterine cervix who reported having had a Pap smear screening during the previous 3 years ranged from 68.1% in A/PI communities to 88.6% in black communities (Table 20). Similar to the percentage for mammography screening, a lower percentage of Hispanic and A/PI women received Pap smear screenings. The median percentages among blacks (88.6%) and American Indians (85.6%) were similar to that of the 2000 BRFSS from 51 states/territories and the District of Columbia (86.8%). Influenza Vaccination The median percentage of adults aged >65 years who reported that they had had an influenza vaccination in the previous year ranged from 53.2% in Hispanic communities to 81.6% in A/PI communities (Table 21). Compared with the respondents from the comparison states in the 2001 BRFSS (data not available at the MMSA level), the majority of black communities had a lower rate of influenza vaccination. The medians among black (54.4%) and Hispanic (53.2%) communities were lower than that among 53 states/territories and the District of Columbia (66.2%). The percentages of adults who had had an influenza vaccination in the previous year in the two American Indian communities were similar to those of the corresponding states. The vaccination rate (range: 77.2%--86.4%) was substantially higher in the A/PI communities. Pneumococcal Vaccination The median percentage of adults aged
>65 years who reported that they had ever had a pneumococcal vaccination
ranged from 37.5% in A/PI communities to 67.3% in American Indian communities (Table 22). The medians among
A/PIs (37.5%), Hispanics (46.0%), and blacks (50.5%) were lower than the median from 53 states/territories and the District of Columbia in the 2001 BRFSS (61.3%). The percentage of vaccination among American Indians was similar to that of comparison
states (Table 22).
In this report, findings from the REACH 2010 Risk Factor Survey reveal that for the majority of health and socioeconomic (SES) indicators, minority communities do not fare as well as the general populations of their metropolitan area, state, or the nation as a whole. SES as measured by education level and household income was substantially lower among minority communities. Minorities also had worse self-rated general health and a higher cost barrier to health care, particularly in Hispanic communities. Variations occurred in the extent of risk factors and disease burden among minority populations. Obesity, high blood pressure, and diabetes were the major health problems in black and American Indian communities. The median prevalence of cigarette smoking and cardiovascular disease was highest in American Indian communities. The percentages of persons who met recommendations for fruit and vegetable intake and physical activity were lowest in A/PI communities. Although gaps in the use of preventive services were typically limited between minorities and general populations in the comparison MMSA or states, underusage was still prevalent for certain services in selected communities. The percentages of persons who reported having had their blood cholesterol checked were lowest in Hispanic and A/PI communities. Pap smear examination was also less frequent in these communities. The lowest influenza vaccination rate was in black and Hispanic communities. Among the four racial/ethnic minority populations, uniform disparities were observed in SES, access to care, and general health status; however, substantial variations existed in different risk factors and disease prevalence. These variations indicate that different priorities are needed to eliminate health disparities in the four racial/ethnic minority populations. Blacks are a substantial minority population in the United States. In the 2000 Census, approximately 12.5% of the U.S. resident population was non-Hispanic black (9). Approximately 20 years after the report of the Secretary's Task Force on African American and Minority Health (10) in 1985, a substantial health gap still exists between blacks and whites. Blacks had the highest age-adjusted death rate in the United States (11). The REACH 2010 survey demonstrates that among the selected survey indicators, obesity, lack of physical activity, hypertension, high blood cholesterol (among women), and diabetes were the major burdens in black communities. Hispanics are a rapidly growing minority population and comprise 12.7% of the U.S. population (9). However, limited data exist regarding the health of Hispanics. As revealed in the REACH 2010 survey, among the four racial/ethnic minority populations, Hispanics had the lowest self-reported education level and family income. In addition, Hispanics had the worst self-rated general health but frequently could not see a doctor because of the cost. Overall, only one half of Hispanics with hypertension reported taking antihypertensive medication, and less than one half ever had their blood cholesterol checked. The rates of receiving a mammogram or an influenza vaccination among Hispanics were also the lowest among the minority populations. Although in 2000 A/PIs comprised only 4% of the U.S. population, during the previous 2 decades, they have become the fastest growing racial/ethnic minority population in the United States. Knowledge regarding A/PI health has been vintage, which reflects the limited size of the population as well as the immigration of multiple A/PI populations to the United States. The majority of the respondents in the four A/PI communities surveyed were Vietnamese or Cambodian. A substantially higher proportion of women from these A/PI populations had less than a high school education and an annual household income of <$25,000 compared with the residents in MMSA or the state where they lived. For example, in the community of Lowell, Massachussets, 62.3% of Cambodian women had less than a high school education. Approximately one half (44.5%) of these women perceived their health as fair or poor. Smoking cigarettes was prevalent among A/PI men but not among women. In Lowell, approximately one half of the Cambodian men smoked cigarettes. Both A/PI men and women were less likely than the other minority populations to have eaten >5 fruits and vegetables daily and to have met physical activity recommendations. The rates of Pap smear examination and pneumococcal vaccination were also the lowest in A/PI communities. American Indians comprise 1% of the total U.S. population but bear a greater burden of health-risk factors and chronic diseases. Data revealed that among the four racial/ethnic minority populations, American Indian communities had the highest prevalence of obesity, cigarette smoking, cardiovascular disease, hypertension, high cholesterol, and diabetes. If this unfavorable risk profile does not change, future mortality related to heart disease, cerebrovascular disease, and diabetes will probably increase. Data from the REACH 2010 Risk Factor Survey in 21 communities demonstrate a substantial heterogeneity in communities within the same racial/ethnic minority population. For example, in black communities, the prevalence of self-reported obesity among women was 27.1% in San Diego, California, whereas it was 44.9% in Lawndale, Chicago. Prevalence of cigarette smoking among black men was 21.7% and 54.2% in these two communities, respectively. These findings reveal differences in the prevalence of risk factors, chronic diseases, and access to and use of preventive services that parallel differences in cultural, demographic, and environmental influences among residents of these communities. The majority of these influences are modifiable, because the differences are limited in biologic predispositions among residents of these communities. Differences in percentages of respondents who received clinical preventive services were also substantial. The rate of mammography screening during the previous 2 years among women aged >50 years was only 58.5% in the Hispanic community in the Lower Rio Grande Valley, South Texas, whereas the rate was 89.7% among the Hispanic community in Lawrence, Masschusetts. Similarly, the rate of pneumococcal vaccination among adults was 18.8% in the Cambodian community in Lowell, Massachusetts, whereas the rate was 45.0% in the Vietnamese community in Santa Clara County, California. The salient variations and intrapopulation differences indicate that opportunities exist for improvement. The aggregation of risk factors and chronic diseases in the 21 communities demonstrates the importance of multifaceted and multisectorial strategies in making effective changes. In addition, aggregation also underscores the importance of primary prevention that emphasizes lifestyle modification, including changes in diet, physical activity levels, weight control, and smoking cessation. Multiple approaches to promoting these lifestyle modifications include educational programs, policies, and environmental interventions, accompanied by identifying and removing barriers to health-care access and improving the quality of health care. A combination of mutually reinforcing populationwide approaches is needed, coupled with targeting patients or other persons at high risk. Limited mean differences and changes in population average levels and distributions of risk characteristics are associated with substantial change in the population burden of disease (12). Therefore, communitywide intervention is potentially an efficient and effective preventive strategy. The diversity of REACH 2010 communities implies that no one methodology or strategy would be considered right and a suitable fit for all communities. The development and implementation of culturally and locally appropriate programs for health promotion in racial/ethnic minority communities are essential. Lower SES plays a key role in these health disparities. However, efforts to reduce health disparities should not be delayed until the disparity in SES is removed. During the previous 40 years, substantial declines in heart disease and stroke mortality for whites and blacks have occurred (10). These positive trends were accompanied by positive changes in cardiovascular risk factors among persons with lower SES (13). Data from three community-based intervention programs (Stanford Five-City Project, Pawtucket Heart Health Program, and Minnesota Heart Health Program) revealed that men and women with lower education were as likely to reduce their risk factor levels as men and women with higher education (13). The declines in cardiovascular diseases also indicate that racial/ethnic minority populations and populations with low SES can adopt and maintain healthy lifestyles when they have access to appropriate health promotion and disease prevention programs. These declines counter the argument that racial/ethnic minority populations and populations with low SES are "hard to reach" and that, if reached, are "resistant to change" (13). Preventive health care is another area requiring greater attention. Nationwide, substantial progress has been made regarding receipt of clinical preventive services (e.g., mammography screening for breast cancer and adult vaccinations for influenza and pneumonia) (14). However, data from the REACH 2010 survey demonstrate that progress was not uniformly achieved among persons of different racial/ethnic backgrounds. In Hispanic communities, screening rates for blood cholesterol, mammography, and Pap smear were substantially lower than the national rates. In addition, older Hispanics were least likely to receive influenza and pneumococcal vaccination. In A/PI communities, rates for pneumococcal vaccination coverage and rates for blood cholesterol and Pap smear screening were low. A/PIs had a lower percentage of persons with diagnosed diabetes receiving an HbA1C test and foot examination during the previous year. In contrast to these findings, the survey also indicated that black and American Indian communities have paralleled the national progress in multiple preventive services. In 2001, American Indians in the two survey communities had reached or were approaching national levels for blood cholesterol, mammography, and Pap smear screening, and for adult immunization coverage. For the majority of the black communities, the rates for mammography and Pap smear screening had also reached comparable levels. Among blacks and American Indians, the proportion of persons with diabetes who had had an HbA1C test and foot examination had surpassed or equalled national levels. Only information regarding selected preventive services were collected in the REACH 2010 survey. It does not represent all of the primary and secondary preventive measures. Although blacks and American Indians are receiving certain preventive services at rates comparable to the general U.S. population, their health outcomes remain worse. For example, for blacks in the United States, the diabetes-related amputation rate and breast cancer mortality were the highest in the nation (11,15). Accounting for these disparities will require close examination of other points of health-care delivery where problems might be occurring (e.g., access to specialized care and follow-up of patients after screenings) (16). The findings in this report are subject to certain limitations. Each minority population in this survey is not a homogeneous population. Substantial ethnic, cultural, and social diversities exist within the same racial/ethnic minority population. For example, Hispanics comprise multiple diverse subpopulations (e.g., Mexicans, Puerto Ricans, Cubans, and Dominicans) who share a common language. Each subpopulation has distinct racial, ethnic, and cultural characteristics. In this survey, A/PIs were primarily Vietnamese and Cambodian. Among blacks, the origin of certain populations was primarily from West Africa, and certain populations were from Haiti or other Caribbean regions. This survey only sampled two American Indian populations and four A/PI populations. The data from this survey might not represent minorities from other communities or a specific minority in the United States. Because estimates are based on self-reported data, the prevalence of certain chronic conditions and use of preventive services might be under- or overestimated. The accuracy of selected prevalence estimates (e.g., cardiovascular disease, hypertension, diabetes, and high cholesterol) is primarily related to access to health care. Underestimation of prevalence is more likely to occur for populations who lack access to health care because of language barriers. Certain questions (e.g., physical activity and fruit and vegetable intake) are subject to variations in perception by different racial/ethnic populations. For one population, the perception of what is the norm might be different from what is recommended. This variation might influence the accuracy of the prevalence estimate among certain populations. Racial/ethnic minorities were also sampled in BRFSS (either at the MMSA- or state-level). As a result, the observed differences between minority communities and data from BRFSS are probably underestimated. Except for three communities where face-to-face interviews were conducted, data were collected through telephone interviews in the majority of the communities. In these communities, persons without telephones and those who used only cell phones were not included in the survey. Despite these limitations, the REACH 2010 survey has multiple strengths. Unlike previous national- or state-based
surveys, it is the largest community-based survey that focuses on multiple minority populations in the United States. In nine of the 14 black communities, the sample size from each community was larger than the total number of black respondents in
the corresponding state of the 2001 BRFSS. Of the seven Hispanic communities, only one state BRFSS sampled more
Hispanics than the corresponding REACH 2010 community. The sample sizes in any A/PI or American Indian communities were
larger than the number of the same racial minority from the state BRFSS. The survey was conducted from a single center and had
a series of quality-control procedures, including interviewer training, certification, standardization, and interview
monitoring. The majority of the questions used in the survey were identical to those used in the 2001 BRFSS; therefore, data from the two surveys can be compared.
The REACH 2010 Risk Factor Survey is now conducted annually and has been extended to 27 communities. The
follow-up surveys will serve as an evaluation of the intervention programs within the demonstration communities. Baseline data from the REACH 2010 survey in this report indicate that continuing disparities exist in the burden of risk factor and
illness experienced by persons in black, Hispanic, A/PI, and American Indian
communities. Nationwide, additional efforts
are required to eliminate the health disparities between minorities and other populations. Additional salient goals
include identifying and understanding communities with a high prevalence of risk factors and disease and designing
effective interventions at the individual and societal levels that will benefit these communities. The quantitative data from this survey provide important information for assessing, prioritizing, and planning intervention efforts. These results underscore the need to tailor prevention strategies to the needs of the specific community to eliminate health disparities. In addition, communities are encouraged to link with nationwide campaigns that address public health concerns (e.g., obesity and diabetes) among all racial/ethnic populations and all communities.
Racial and Ethnic Approaches to Community Health (REACH) 2010 Risk Factor
Survey Centers for Disease Control and Prevention, National Center for Chronic Disease Prevention and Health Promotion, Division of Adult and Community Health --- Levator Brown; Cynthia D. Crocker; Wayne H. Giles, M.D.; Virginia B. Harris, M.P.H.; NKenge Jack, M.P.H.; Annie Latimer, M.S.A.; Youlian Liao, M.D.; Sara L. McNary, M.S.; Ali H. Mokdad, Ph.D.; Catherine A. Okoro, M.S.; Michael Sells, M.S.; Sakeena Smith, M.P.H.; and Pattie Tucker, Dr.PH. National Organization for Research at the University of Chicago --- Tiffani A. Balok; Angela A. DeBello, M.A.; Jessica E. Graber, Ph.D.; Carmelita Grady, Ph.D.; Rachel M. Harter, Ph.D.; Cynthia A. Howes, M.S.W., M.S.; Michele T. Koppelman, M.A.; Heather M. Morrison, M.A.; Whitney E. Murphy, M.S.; Colm A. O'Muircheartaigh, Ph.D.; and Edward T. Sipulski. Boston, Massachusetts --- Boston REACH 2010 Breast and Cervical Cancer Coalition. Charlotte, North Carolina --- Charlotte REACH 2010 Coalition: Carolinas Community Health Institute; Mecklenburg County Health Department; Mecklenburg County Fighting Back Program; Healthy Families/Healthy Communities Organization; Substance Abuse Prevention Services, Inc.; McCrorey Family YMCA; Carolinas Medical Center, Dept. of Family Medicine; Carolinas Medical Center, Biddle Point Health Center; Presbyterian Health Care Parish Nurse Program; the Sanger Clinic, Inc.; and Mecklenburg Council on Adolescent Pregnancy. Los Angeles County California --- Community Health Councils, Inc., African Americans Building a Legacy of Health: Lark Galloway-Gilliam, M.P.A.; Joyce Jones Guinyard, D.C.; LaVonna Blair Lewis, Ph.D.; David Sloane, Ph.D.; Allison Diamante, M.D.; Antronette Yancey, M.D.; and Lori Nascimento, M.P.H. Fulton County, Georgia --- Fulton County Department of Health and Wellness: Dennis E. Daniels, Dr.PH.; Larry Johnson, M.P.H.; and Adewale Troutmon, M.D. Nashville, Tennessee --- Disparities in Health Coalition of Nashville: Michelle B Marrs, Ed.M.; Celia Larson, Ph.D.; Nasar Ahmed, Ph.D.; Linda H. McClellan, M.P.H.; and David Schlundt, Ph.D. Charleston and Georgetown Counties, South Carolina --- Charleston and Georgetown Diabetes Coalition: Carolyn M. Jenkins, Dr.PH.; Gayenell S. Magwood; Barbara A. Carlson; Charles L. Hossler, Ph.D.; Sharon E. Cash; Beverly Highland; Anna B. Johnson; Florene Linnen; Virginia L. Thomas; Betty P. Rouse; and Philip L. Martin. Partner Organizations: Alpha Kappa Alpha Sorority; Carolina Medical Review; Charleston County Library; Communicare; Diabetes Prevention and Control Program, South Carolina; Diabetes Initiative of South Carolina; Franklin C. Fetter Family Health Center; Georgetown County Diabetes CORE Group; Georgetown County Library; Harmony Gardening; Medical University of South Carolina (MUSC) and MUSC Medical Center; South Carolina Department of Health and Environmental Control; Sea Island Medical Center; Saint James Santee Family Health Center; Tri-County Black Nurses Association; Tri-County Project Care; Trident Department of Health and Environmental Control (DHEC) Health District; and Waccamaw DHEC Health District. Orleans Parish, Louisiana --- REACH 2010 at the Heart of New Orleans Coalition institutional partners; Bolaji Fapohunda, Ph.D.; Cheryl Taylor, Ph.D.; Marsha Broussard, M.P.H.; Karen DiSalvo, M.D.; Keith C. Ferdinand, M.D.; Jeanette Magnus, M.D.; Shavon Arline, M.P.H.; Cynthia Bienemy, Ph.D.; June Marshal; Heather Frederick, M.P.H.; Teresita Alcantra, M.D; 40 area churches; REACH volunteers; Lorraine Cole, Ph.D.; and Billye Avery, Black Women's Health Imperative. Alabama --- Alabama REACH 2010 Breast and Cervical Caner Control Coalition: University of Alabama, Birmingham; University of Kentucky; American Cancer Society; Alabama Cooperative Extension System; Alabama Department of Public Health; Alabama Quality Assurance Foundation; Beatrice & Darius Cancer Care Center; Cancer Information Service; House of Hope; Mineral District Medical Society; National Black Church Family Council; Health Ministries Association; SISTAs Can Survive Coalition; Tuskegee Area Health Education Center, Tuskegee University; and National Center for Bioethics. San Diego, California --- California Black Health Network Sweet Heart Project: Denise Adams-Simms, M.P.H.; and Debra M. Brooks, M.S.W. Southwest Chicago, Illinois --- Access Community Health Network: Padmanabhan Mukundan, M.D. Lawndale, Chicago, Illinois --- Lawndale Health Promotion Project, REACH 2010 Coalition: American Heart Association; Chalmers Elementary School; Joseph E. Gary Elementary School; Westside Baptist Ministers Conference; Our Lady of Tepeyac Parish and School; Family Focus Lawndale; Lawndale Christian Health Center; Dr. Jorge Prieto Family Health Center; Sinai Health Systems; Saint Anthony Hospital; Programa Center for Information and Education Latino Optimum (C.I.E.L.O.); University of Chicago, Diabetes Education Center; University of Illinois, School of Public Health; and University of Illinois Extension. Detroit, Michigan --- REACH Detroit Partnership: Community Health and Social Services Center, Inc.; University of Michigan School of Social Work; University of Michigan School of Public Health; Detroit Health Department; Henry Ford Health System; Saint John Detroit Riverview Hospital; Butzel Family Center; Friends of Parkside; Latino Family Services; Warren/Conner Development Coalition; Church of the Messiah; and Southeast Michigan Diabetes Outreach Network. Michigan Department of Community Health: Gwendolyn Gaddy-Dansby, M.D.; J. Ricardo Guzman, M.S.W., M.P.H.; Michele Heisler, M.D.; Sherman James, Ph.D.; Edith Kieffer, Ph.D.; Gloria Palmisano, M.A.; Michael Spencer, Ph. D.; Brandy Sinco, M.S.; and Kimberlydawn Wisdom, M.D. Bronx, New York City --- the Institute for Urban Family Health, Bronx Health REACH Coalition: Coalition representing 40 churches; American Diabetes Association; HealthForce; Highbridge Community Life Center; the Institute for Community and Collaborative Health; Math, Art, Culture After-School Program; Mount Hope Housing Co.; National Saint Barnabas Community Center of Excellence in Women's Health; Neighborhood Self Help by Older Persons Project, Inc. (SHOPP), Partners in Health; Saint Barnabas Medical Center; Saint Edmund Episcopal Church; Women's Housing and Economic Development Corp.; Center for Health and Public Service Research of New York University; Neil S. Calman, M.D.; Charmaine R. Ruddock, M.S.; Maxine L. Golub, M.P.H.; John C. Billings, J.D.; and Sue A. Kaplan, J.D. Lawrence, Massachusetts --- REACH 2010 Latino Health: Migna Alecon; Luz Arroyo; Marianna Canovitch; G. Dean Cleghorn, Ed.D.; Gilda Duran; Markus Fischer; Vilma Lora; Jean Lussier; Nancy Masys; Zulma Montanez; Claire Paradiso; Blair Roberts, M.D.; Miguel Sanabria; Liz Sweeney; and Martha Velez. Lower Rio Grande Valley, South Texas --- REACH Promotora Community Coalition Project: Kimberly Kratz, M.S.W., M.P.H.; and Rebecca Garza, M.Ed. Partner Organizations: University of Texas Pan American-Border Health Office; University of Arizona, College of Public Health; Su Clinica Familiar; Brownsville Community Health Center; and Nuestra Clinica del Valle. Seattle and King County, Washington --- Seattle and King County REACH 2010 Diabetes Program. Santa Clara County, California --- Vietnamese REACH for Health Initiative: Asian Americans for Community Involvement; American Cancer Society; Blue Cross of California; Catholic Charities Youth Empowerment for Success (Y.E.S.); Catholic Charities of San Jose, John XXIII Multi-Service Center; Community Health Partnership; Immigrant Resettlement and Cultural Center; Kaiser Permanente; Santa Clara County Public Health Department; Santa Clara County Ambulatory and Community Health Services; Southeast Asian Community Center; Vietnamese Physician Association of Northern California; Vietnamese Voluntary Foundation, Inc.; Vietnamese Community Health Promotion Project; Mary Cheryl B. Nacionales, M.P.H.; Tuyet Ha Iaconis; Giao Pham, M.D.; Miguel Garibay; Angie Pratt, M.A.; Lourie Campos, M.P.A.; Nam Pham; Teresa Dao, M.D.; Thien-Nhien Luong, M.P.H; Ngoc Bui-Tong, M.H.A.; Megan Bui;, Chung Vu, M.D.;, MyLinh Pham;, Tuan Nguyen; Hung Pham, M.D.; Thoa Nguyen; Ching Wong; Jeremiah Mock, Ph.D.; Ky Quoc Lai, M.D.; Hy Lam; Tung T. Nguyen, M.D.; and Stephen J. McPhee, M.D. Lowell, Massachusetts --- Cambodian Community Health 2010: Dorcas C. Grigg-Saito, M.S.; Sidney Liang; Susan Koch-Weser; Robin Toof, M.A.; Munty Pot, M.Ed.; Niem Nay-Kret; Andrea Laskey; and Sheila Och. Los Angeles and Orange County, California --- REACH 2010-Promoting Access to Health for Pacific Islander and Southeast Asian Women (PATH for Women); Special Service for Groups; Families in Good Health, Saint Mary Medical Center; Guam Communications Network; Samoan National Nurses Association; Tongan Community Service Center; Orange County Asian and Pacific Islander Community Alliance; Pacific Asian Language Services for Health (PALS); University of California, Los Angeles, School of Public Health and Asian American Studies Center, and California State University; Fullerton Department of Kinesiology and Health Science; Jacqueline H. Tran, Sora Park Tanjasiri, Dr.PH.; Mary Anne Foo, M.P.H., Susan W. Lee; and Tu-Uyen Ngoc Nguyen, Ph.D. Oklahoma --- Native American REACH 2010 Coalition: Janis E. Campbell, Ph.D. Jackson and Swain Counties, North Carolina --- Eastern Band of Cherokee Indians REACH 2010 Coalition: Cherokee Central Schools, tribal worksites, churches, civic groups, and health-care providers. Table 1 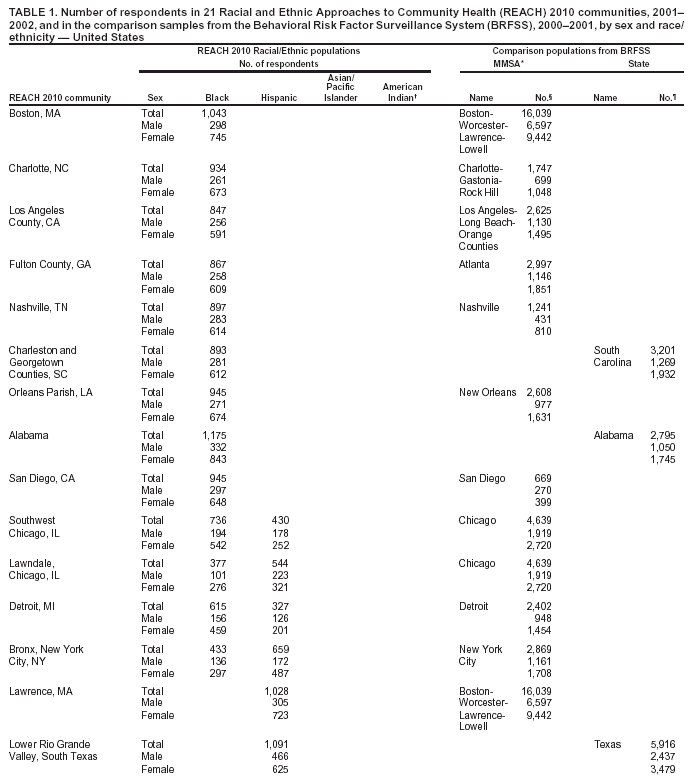 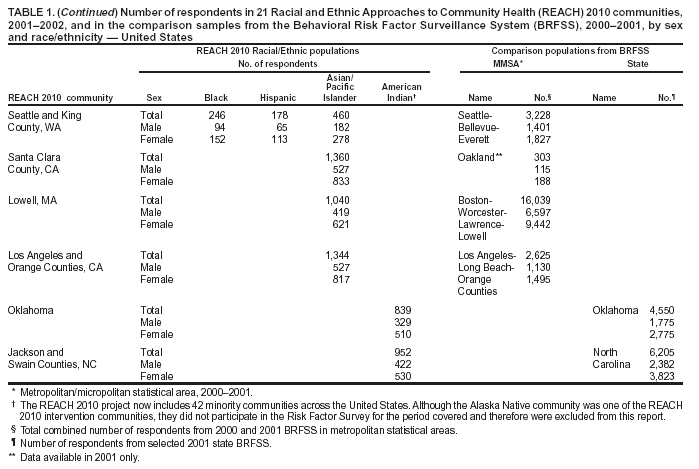 Return to top. Table 2 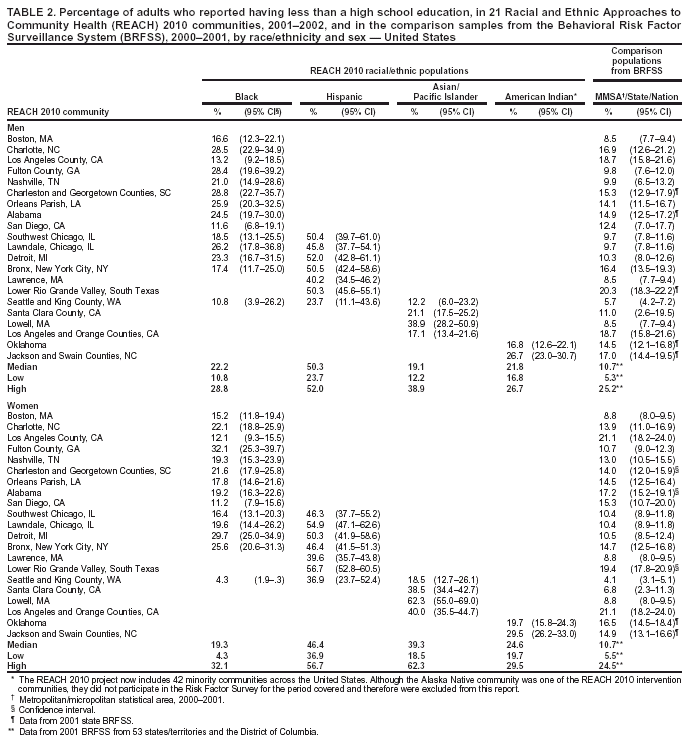 Return to top. Table 3 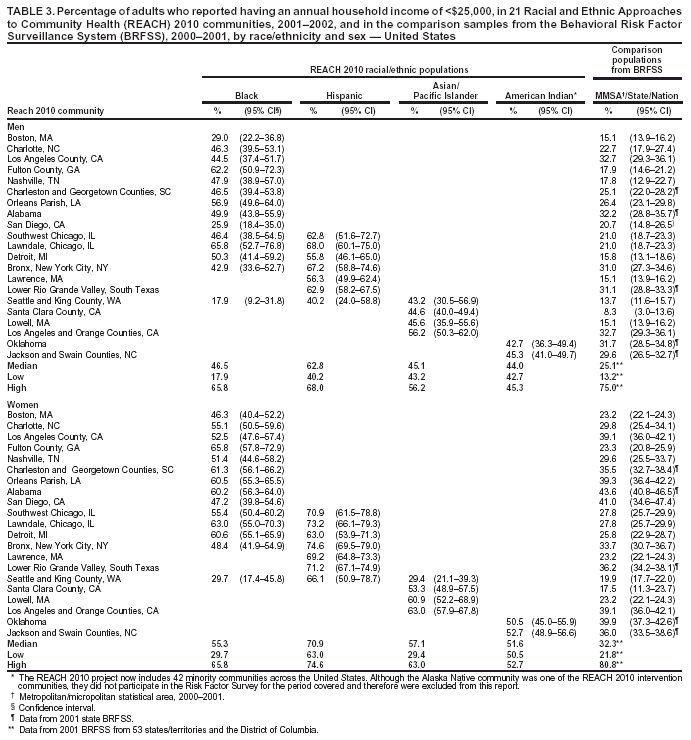 Return to top. Table 4 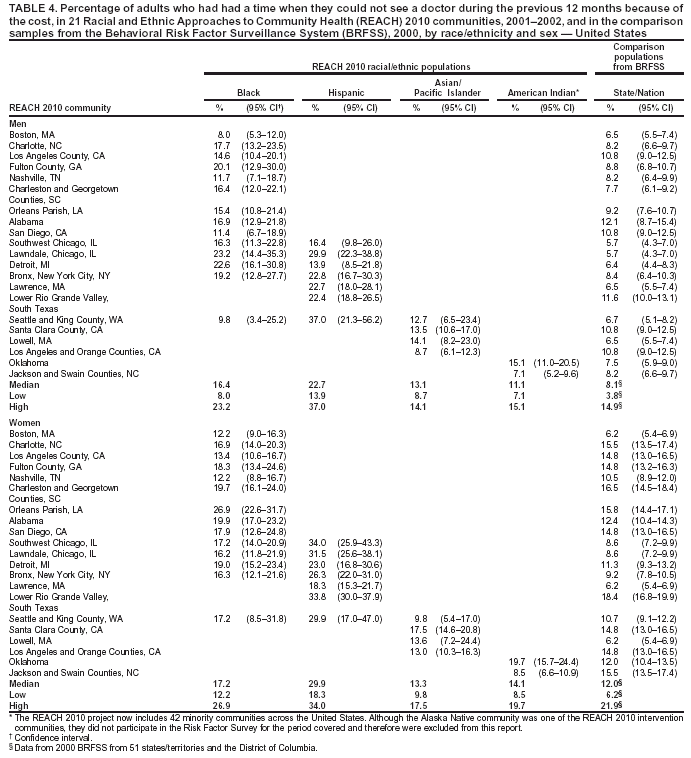 Return to top. Table 5 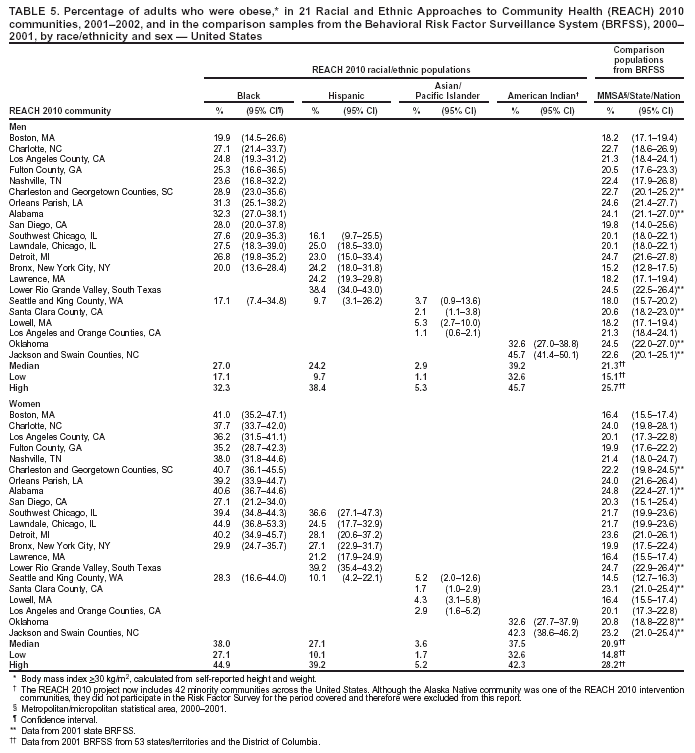 Return to top. Table 6 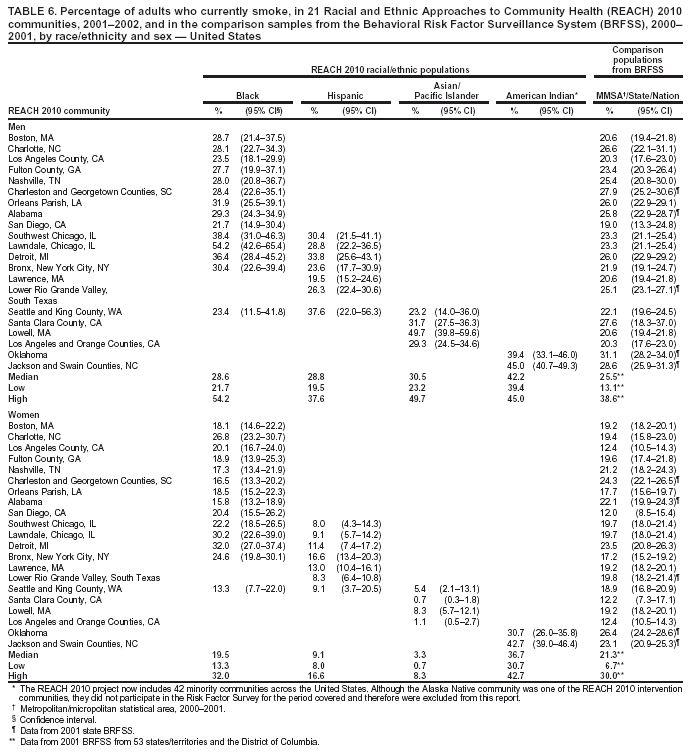 Return to top. Table 7 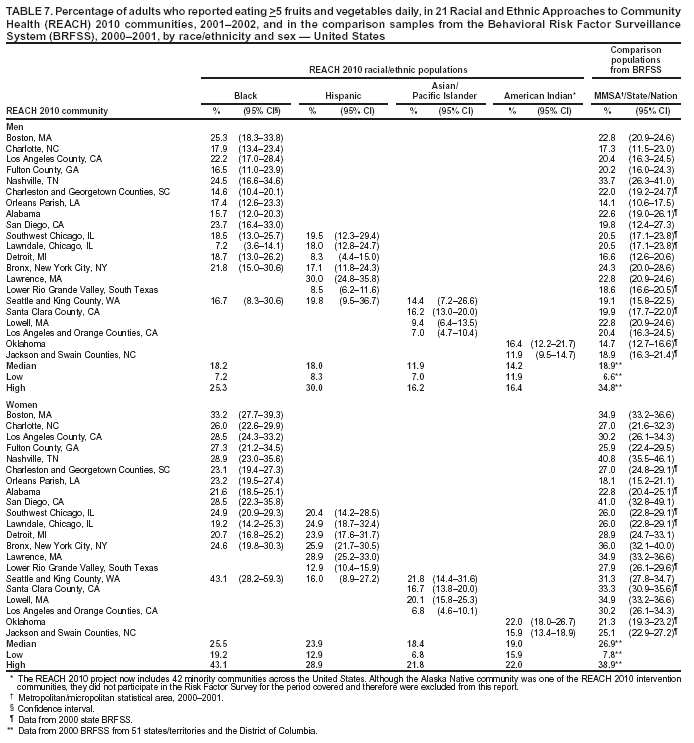 Return to top. Table 8 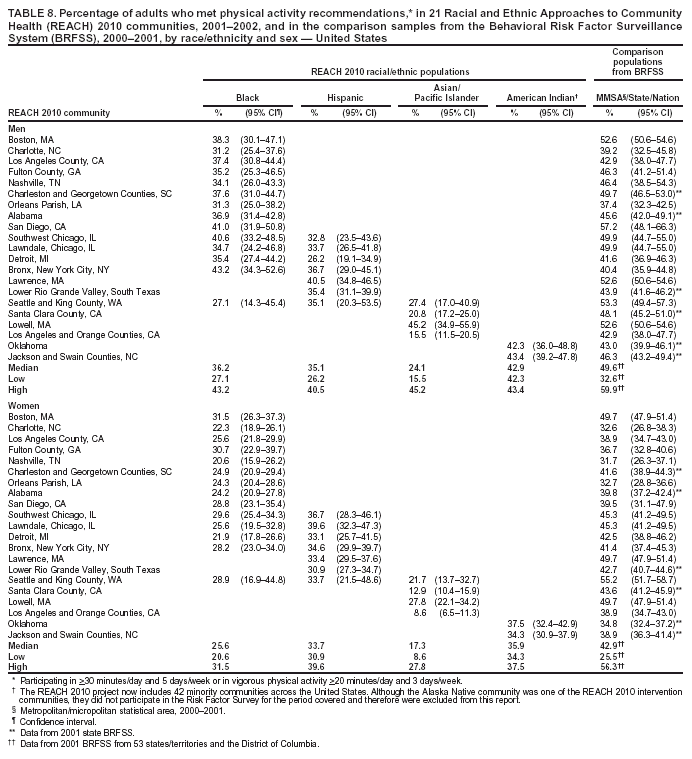 Return to top. Table 9 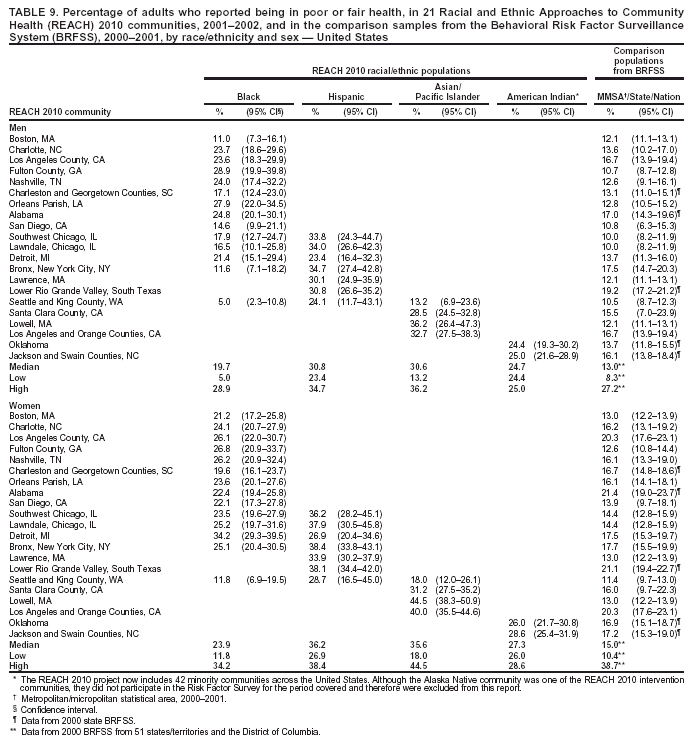 Return to top. Table 10 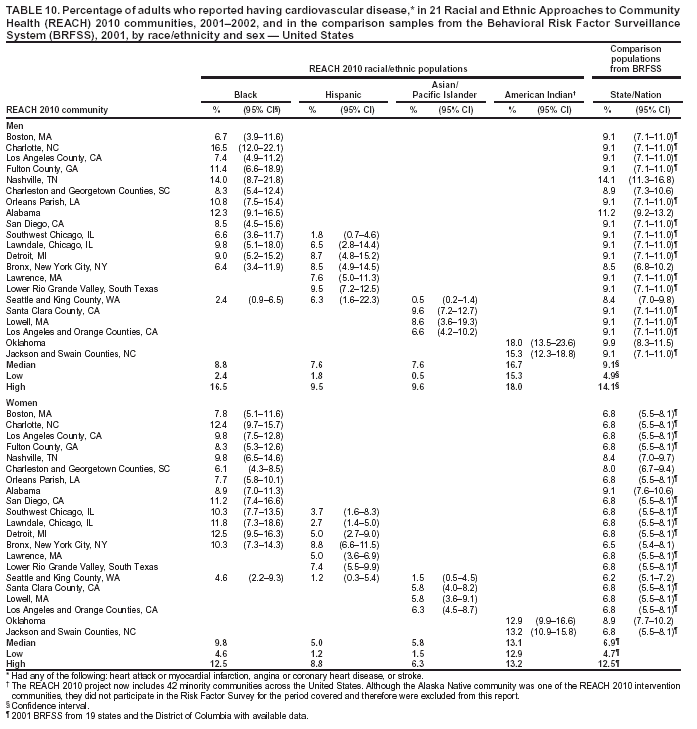 Return to top. Table 11 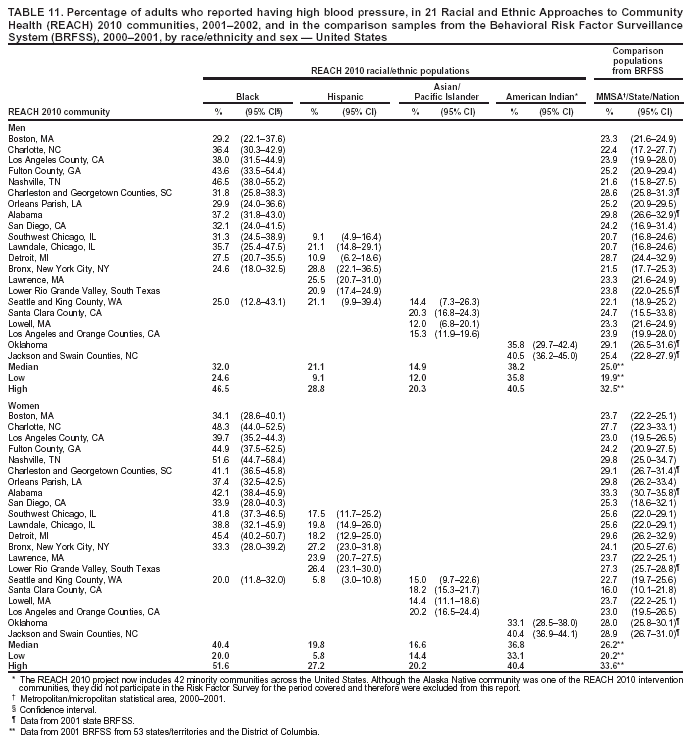 Return to top. Table 12 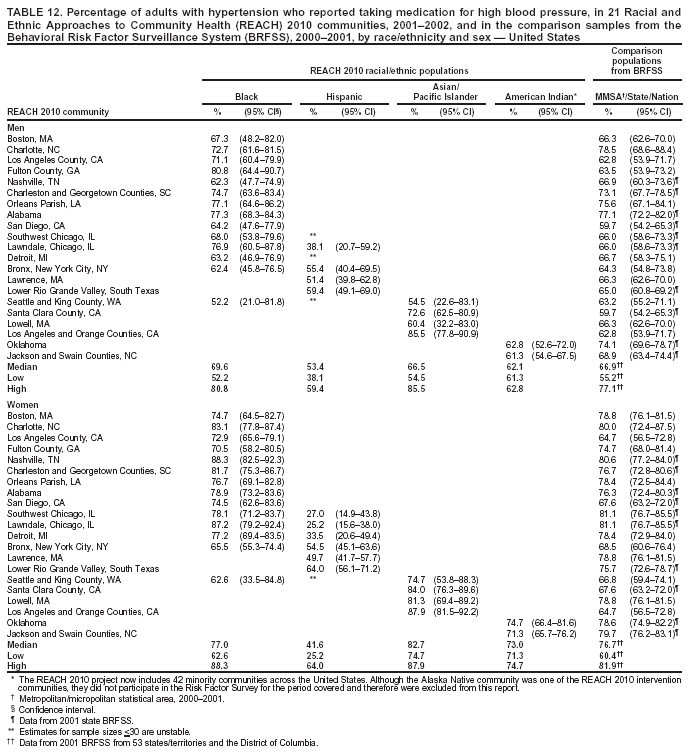 Return to top. Table 13 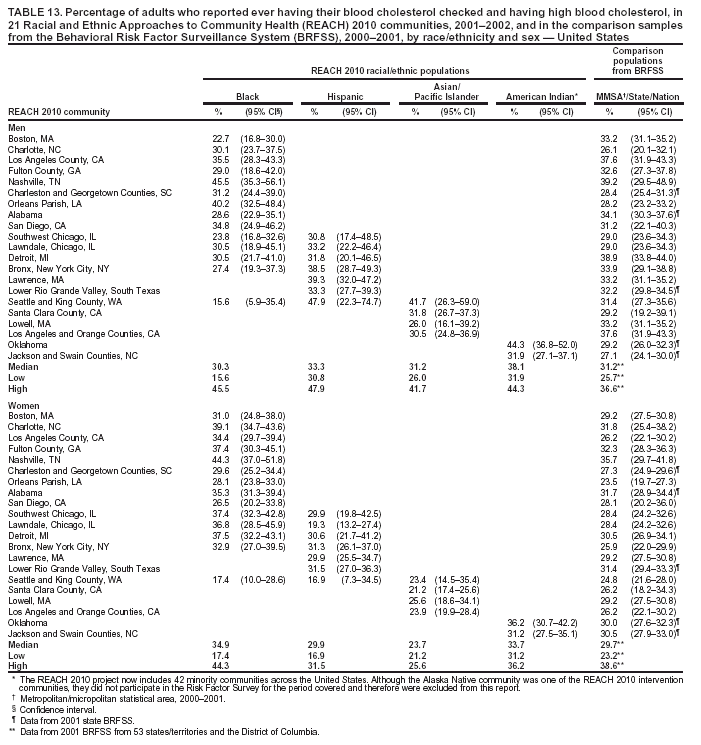 Return to top. Table 14 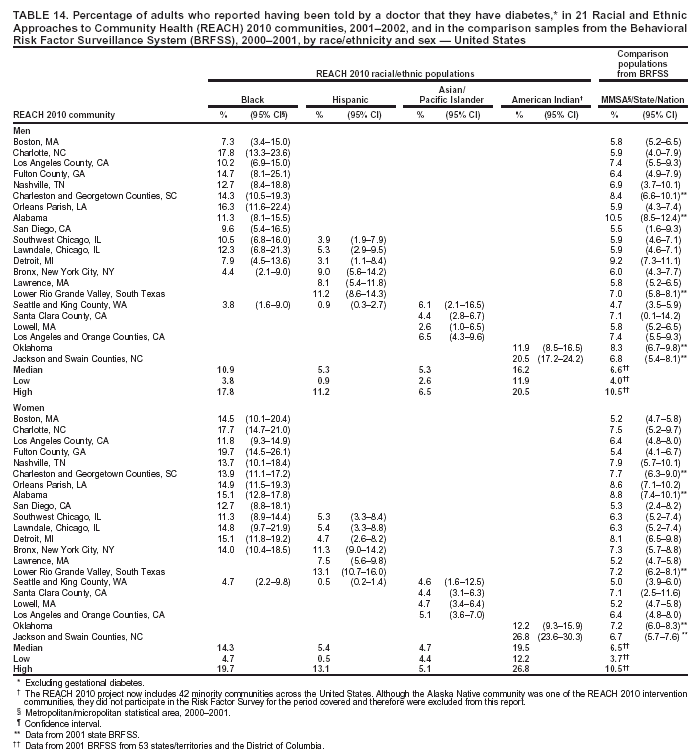 Return to top. Table 15 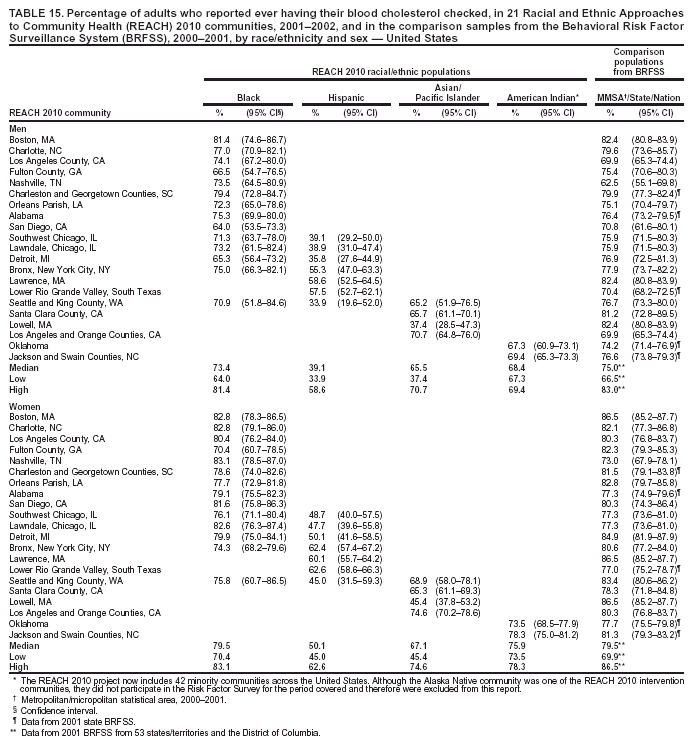 Return to top. Table 16 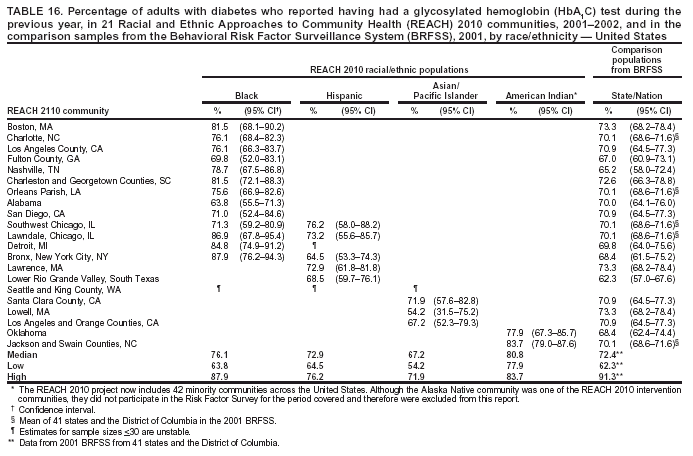 Return to top. Table 17 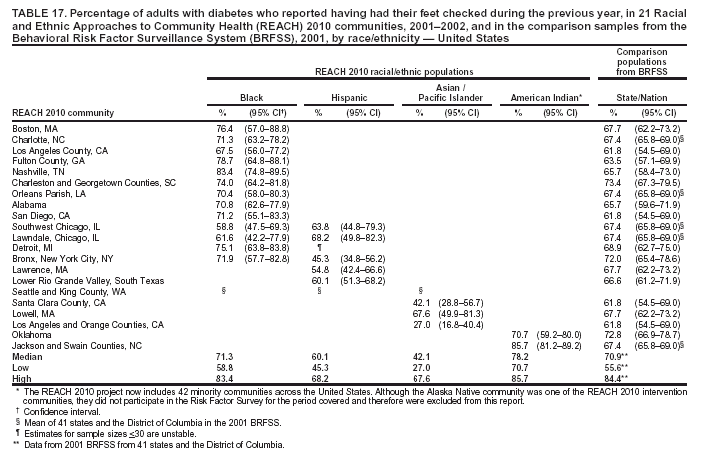 Return to top. Table 18 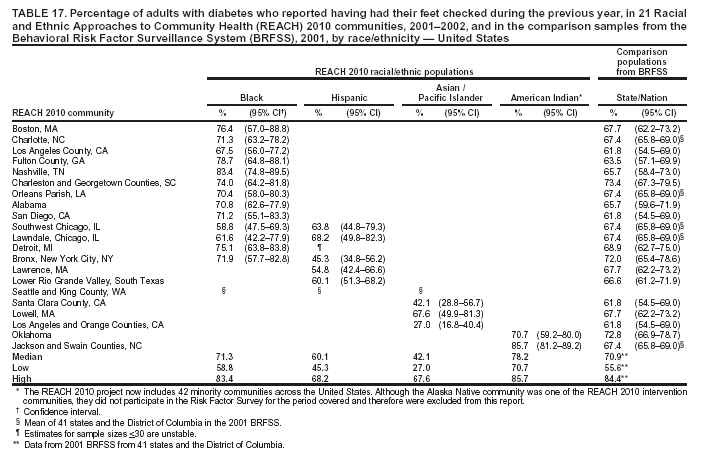 Return to top. Table 19 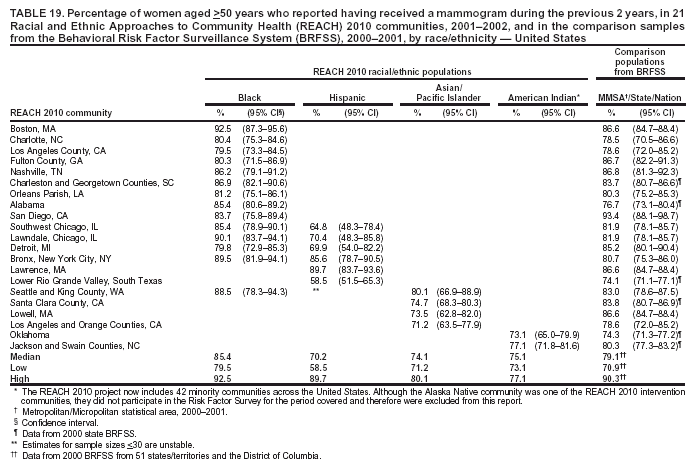 Return to top. Table 20 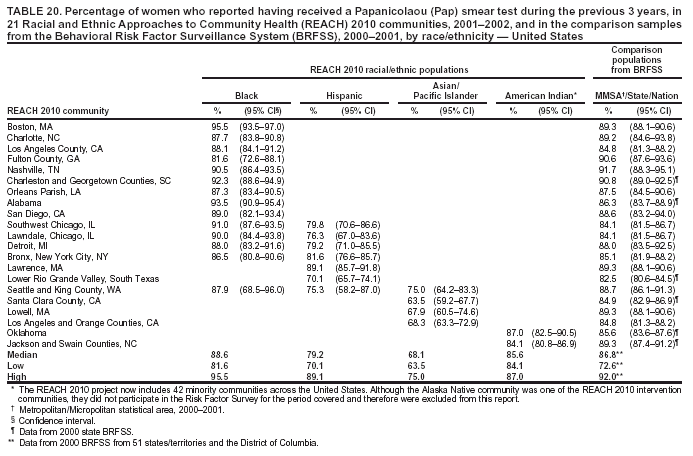 Return to top. Table 21 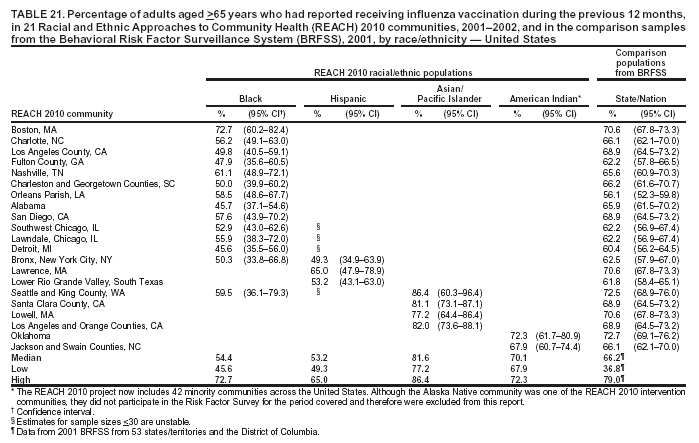 Return to top. Table 22 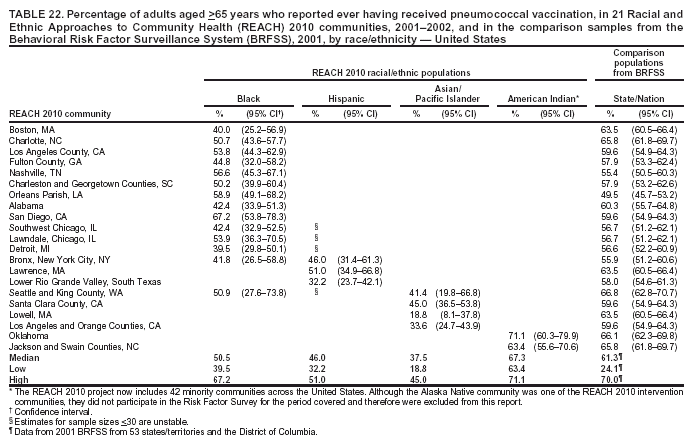 Return to top.
Disclaimer All MMWR HTML versions of articles are electronic conversions from ASCII text into HTML. This conversion may have resulted in character translation or format errors in the HTML version. Users should not rely on this HTML document, but are referred to the electronic PDF version and/or the original MMWR paper copy for the official text, figures, and tables. An original paper copy of this issue can be obtained from the Superintendent of Documents, U.S. Government Printing Office (GPO), Washington, DC 20402-9371; telephone: (202) 512-1800. Contact GPO for current prices. **Questions or messages regarding errors in formatting should be addressed to mmwrq@cdc.gov.Page converted: 8/18/2004 |
|||||||||
This page last reviewed 8/18/2004
|