 |
|
|
|
|
|
|
| ||||||||||
|
|
|
|
|
|
|
||||
| ||||||||||
|
|
|
|
|
Persons using assistive technology might not be able to fully access information in this file. For assistance, please send e-mail to: mmwrq@cdc.gov. Type 508 Accommodation and the title of the report in the subject line of e-mail. Role of Data Aggregation in Biosurveillance Detection Strategies with Applications from ESSENCEHoward S. Burkom,1 Y. Elbert,2 A. Feldman,1 J. Lin1
Corresponding author: Howard S. Burkom, 11100 Johns Hopkins Road, Mailstop 8-224, Laurel, MD 20723. Telephone: 443-778-4361; Fax: 443-778-5950; E-mail: Howard.Burkom@jhuapl.edu. AbstractIntroduction: Syndromic surveillance systems are used to monitor daily electronic data streams for anomalous counts of features of varying specificity. The monitored quantities might be counts of clinical diagnoses, sales of over-the-counter influenza remedies, school absenteeism among a given age group, and so forth. Basic data-aggregation decisions for these systems include determining which records to count and how to group them in space and time. Objectives: This paper discusses the application of spatial and temporal data-aggregation strategies for multiple data streams to alerting algorithms appropriate to the surveillance region and public health threat of interest. Such a strategy was applied and evaluated for a complex, authentic, multisource, multiregion environment, including >2 years of data records from a system-evaluation exercise for the Defense Advanced Research Project Agency (DARPA). Methods: Multivariate and multiple univariate statistical process control methods were adapted and applied to the DARPA data collection. Comparative parametric analyses based on temporal aggregation were used to optimize the performance of these algorithms for timely detection of a set of outbreaks identified in the data by a team of epidemiologists. Results: The sensitivity and timeliness of the most promising detection methods were tested at empirically calculated thresholds corresponding to multiple practical false-alert rates. Even at the strictest false-alert rate, all but one of the outbreaks were detected by the best method, and the best methods achieved a 1-day median time before alert over the set of test outbreaks. Conclusions: These results indicate that a biosurveillance system can provide a substantial alerting-timeliness advantage over traditional public health monitoring for certain outbreaks. Comparative analyses of individual algorithm results indicate further achievable improvement in sensitivity and specificity. IntroductionA working definition of syndromic surveillance is the monitoring of available data sources for outbreaks of unspecified disease or of specified disease before identifying symptoms are confirmed. Its goal is to complement existing sentinel surveillance by identifying outbreaks with false-alert rates acceptable to the public health infrastructure. After data sources are chosen, multiple data-aggregation decisions follow. Foremost among these decisions are which data records to monitor, how data will be aggregated in space and time, and how other covariates (e.g., age and sex) will be managed. In data aggregation, a thematic tradeoff exists between expanding the space or time window to increase structure for background modeling and masking a potential outbreak signal with the additional counts. This paper explores data aggregation by space, time, and data category; discusses the relevance of data aggregation to the effectiveness of alerting algorithms; describes approaches selected for use by the Electronic Surveillance System for the Early Notification of Community-Based Epidemics (ESSENCE) (1); and discusses these approaches' performance in a detection evaluation exercise conducted in 2003 by the Bio-Event Advanced Leading Indicator Recognition Technology (Bio-ALIRT) program of the Defense Advanced Research Project Agency (DARPA) (2). BackgroundSliding Buffer ConceptA temporal-aggregation concept underlying certain surveillance algorithms (3,4), including those used by ESSENCE, is the separation of recent data into three segments that slide forward in time (Figure 1). These segments include 1) a baseline period to estimate expected data behavior; 2) the recent test period, typically 1--7 days, of potentially anomalous data; and 3) a guard band between them to avoid contamination of the baseline by an outbreak signal. Whether the quantities of interest are simple means and standard deviations, regression coefficients, spatial distributions, or distributions of covariate strata (e.g., age groups), these temporal subdivisions are used to determine whether the test-period data violate the null hypothesis of expected behavior inferred from the baseline. Data Aggregation and Purely Temporal SurveillancePurely temporal surveillance monitors data time series for outbreak-induced anomalies without using spatial information. Categorical- and spatial-aggregation decisions determine both the time series to be monitored and the regression-based or process-control--based approaches to be implemented for monitoring. Historic data analysis is used to choose the baseline lengths, and the expected data effects of outbreaks are used to determine the length of the test period and guard band. These aggregation decisions (e.g., to stratify among neighboring regions or data subtypes) might result in the monitoring of multiple time series. Multivariate algorithms using the data-covariance matrix can exploit the correlation among these time series but might be sensitive to changes in data relationships (e.g., changes caused by informatics or organizational changes) that are irrelevant to monitoring for disease. Data Aggregation and Scan StatisticsSpatial-aggregation decisions for purely temporal methods can be driven by jurisdictional or logistical considerations, but such decisions can decrease the early warning advantage of syndromic surveillance (e.g., when early cases are scattered among the chosen regions). Use of scan statistics (5,6), notably in SaTScan™ software (7), has become popular because it avoids preselection bias and can choose the most important among possible outbreak locations and extents without oversensitivity caused by multiple testing. Use of scan statistics guides spatial aggregation and can direct limited public health resources to localities of anomalous case distributions. Temporal aggregation becomes a concern in ESSENCE adaptations of scan statistics when the underlying assumption of uniform spatial incidence fails. In such cases, historic data are used to obtain expected spatial distributions; temporal baseline and test-period decisions are then necessary. For example, the New York City Department of Health and Mental Hygiene successfully used a 28-day baseline and 7-day guard band and test periods in West Nile virus surveillance (3). An enhanced scan-statistics implementation in ESSENCE enables treatment of other aggregation problems (e.g., the distance measure for generating candidate clusters). The distance matrix is usually formed by using the Euclidean distance between centroids of component subregions. Although this distance measure might be appropriate for monitoring threats caused by atmospheric risk factors (e.g., an aerosolized release of a biologic agent), driving distance might be a more suitable measure for monitoring an increase in communicable endemic disease. Test-bed implementations have demonstrated that direct, heuristic modifications to the distance matrix can avoid undesirable clustering. An ESSENCE enhancement also permits use of multiple data sources to search for anomalous clusters (8). The different data sources need not have the same spatial partitioning, and their baseline and test intervals might differ. A stratified scan-statistics approach is used to avoid the signal masking caused by mismatched scales or variances in the respective data sources. A performance measure, described and tested with various signal distributions (8), demonstrates that the stratified approach retains power to detect signals in both single and multiple data sources. ObjectivesESSENCE's biosurveillance systems attempt to fuse information from multiple data sources that vary in their medical specificity, spatial organization, scale, and time-series behavior. True denominator data specifying the number of persons at risk are rarely available. These systems are increasingly used at multiple jurisdictional levels; therefore, the system alerts should be appropriate to the purview of the user. Specific objectives are to 1) present aggregation and detection strategies that were applied to the city-level DARPA evaluation exercise (see Methods), 2) present the ESSENCE results from this exercise, and 3) draw conclusions about potential system capability and identify areas for enhancement. MethodsFor temporal-detection algorithms, statistical process control (SPC) and multiple statistical process control (MPSC) algorithms are applied to raw or normalized time-series data. Data Normalization StrategiesNormalization is required if the raw time-series data exhibit systematic features (e.g., day-of-week effects). These features are most often seen in counts of large syndrome-group diagnoses collected from well-represented regions; an approximate quantitative rule for these features is a median of >5 counts per day. When such data features occur, SPC algorithms are applied to the residuals of linear or Poisson regression. Current ESSENCE systems apply goodness-of-fit statistics to automate the choice of whether to use regression residuals; regression-predictor variables include time, day-of-week indicators, and other data-dependent quantities. Aggregation and Fusion ConcernsMonitoring multiple series might be necessary for three reasons: 1) multiple, disparate data sources might be available; 2) time series for a data source might be divided among political regions or treatment facilities; 3) the need to monitor for multiple outbreak types might require stratification of available data by syndrome or product group. These circumstances are increasingly intertwined in ESSENCE systems as the surveillance areas and number of available data sources increase. Two combined monitoring approaches are taken. In the multiple univariate approach, detection algorithms are applied separately to each time series, and alerting depends on how the separate results are combined. The combination method must retain sensitivity while avoiding excessive alerts caused by multiple testing. In the multivariate approach, MSPC algorithms are applied to the set of time series to produce a single statistic. These algorithms usually depend on a recent estimate of the covariance matrix of the input streams, and the challenge is to avoid alerts caused by changes to data interrelationships that are irrelevant to potential outbreaks. Multiple Univariate StrategiesUnivariate SPC methods used by recent ESSENCE systems include 1) an exponential weighted moving average (EWMA) algorithm (9), with baseline and guard band optimized for timely alerting of an epicurve-like signal, and 2) the nonhistoric cumulative sum (CUSUM) algorithms from the Early Aberration Reporting System (EARS) (10) used by many local health departments. Alerting based on the maximum value of the chosen univariate method over input data streams leads to excessive alerting as the number of these streams increases. Using Edgington's consensus method (11) for multiple experiments reduces this problem. Bayes Belief Networks (BBNs) (12), a more versatile means for combining algorithm outputs, were used in the DARPA evaluation exercise to calculate a composite p-value for alerting. BBNs provide a compact encoding of the joint probability distribution of algorithm outputs along with other synoptic evidence. This approach uses a directed graphical structure to represent knowledge of conditional independences among variables to simplify the representation of the overall joint probability distribution. Because variables (nodes in the graph) usually depend on a limited number of other variables, estimates of probabilities are needed only for the local (connected) relationships. The overall probability distribution is then determined from all local distributions. Thus, the BBN approach permits environmental evidence and heuristic rules to be included in alerting decisions. Multivariate MethodsThe use of MSPC methods for surveillance against cyber attacks by adopting Hotelling's T2 is described elsewhere (13). Certain published discussions (14,15) state that multivariate EWMA (16) and CUSUM (17) methods are preferable to Hotelling's T2 for detecting changes in the multivariate mean because they have shorter average run lengths before the process is declared out of control. For the application of finding outbreak signals in outpatient-visit data, all of these methods were determined to be oversensitive because they generated alerts from irrelevant changes in the covariance matrix estimate. To illustrate, the T2 statistic can be written
where X = multivariate data from the test interval; μ = vector mean estimated from the baseline interval; and S = estimate of covariance matrix calculated from the baseline interval. Certain nuisance alerts caused by relative data dropoffs were eliminated by implementation of a one-sided test in which the test statistic was replaced with 0 whenever the sum of current z-scores over the data streams was negative. These z-scores were calculated by using the current baseline mean and standard deviation in each stream. This procedure naturally reduced the number of alerts in all MSPC methods, and the resulting T2 statistic performed well in the Bio-ALIRT evaluation. Additional work is needed to improve the specificity of certain methods (16,17) for biosurveillance applications. Bio-ALIRT 2003 Detection System EvaluationThe DARPA evaluation exercise was a comprehensive comparison of the effectiveness of detection methodologies used by participating contractor teams in a large, complex, authentic data environment. The exercise is discussed elsewhere in detail (2), and its main features are summarized here. The task for the contractor teams was to find authentic outbreaks when given daily records from three data sources: military clinic visits, physician office visits by civilians, and military prescriptions. Only records of visits or prescriptions that could be classified with a respiratory or gastrointestinal (GI) diagnosis were included in the sample; for simplicity, respiratory and GI data were analyzed separately for outbreaks. The principal covariates included in the records were patient age, sex, residential zip code, and specific International Classification of Diseases, Ninth Revision (ICD-9) codes (or, for prescriptions, Specific Therapeutic Class [GC3] codes and National Drug Codes [NDC]), along with the respiratory/GI classification. Data sets from five cities were processed separately. The outbreak detection group (ODG), a committee of epidemiologists and physicians, chose these data sets and identified sample outbreaks for training purposes. Fourteen months of training data from all five cities were supplied to Bio-ALIRT detection teams for learning the data features and for choosing and calibrating optimal detection methods. The resulting methods were to be applied without further modification to the next 9 months of data. ODG then examined the 9-month test period of these data sets independently and, for each outbreak identified, specified a start date, nominal date when traditional public health monitoring would have recognized the outbreak, peak date, and end date. The ODG findings of eight respiratory outbreaks and seven GI outbreaks in the test period were treated as the standard for the exercise, against which the algorithm outputs of each detection team were scored. The positive and negative aspects of applying human medical professional judgment to authentic, noisy data for performance-evaluation purposes have been discussed elsewhere (2). Sample plots of the training data for each data source are presented (Figure 2). These time series of patient encounters indicated substantial respiratory syndrome data counts, distinct day-of-week effects, and seasonal trends. ODG directed the detection teams to look for city-scale outbreaks of any duration. Faint outbreaks in the training set were detected, not completely synchronized among the data streams, which could be found only with multivariate methods. Performance Assessment ToolsThe methodology used to measure the performance of the detection algorithms in this exercise is described elsewhere in computational detail (2). The two measures used were algorithm sensitivity (i.e., the number of outbreaks detected) and timeliness (i.e., the number of days between the outbreak start and subsequent alert). However, instead of being assessed at fixed algorithm thresholds at uncontrolled specificity, both measures were calculated for fixed false-alert rates seen as practical for public health surveillance. False-alert rates of 1 per 2 weeks, 1 per 4 weeks, and 1 per 6 weeks were chosen for this purpose. Series of trials were conducted on the training data sets to choose algorithms that were effective at these false-alert rates with parameters that were approximately optimal for the surveillance context of this exercise. Data Conditioning Using Provider-Count RegressionIn terms of the performance measures adopted, a particularly effective data-conditioning procedure was a linear regression of the daily syndrome counts in which the count of providers reporting each day was used as a predictor. The daily reporting provider counts were calculated according to the data type (i.e., the count of clinics for the military outpatient data, of pharmacies for the military prescription data, and of individual physicians for the civilian office-visit data). Residuals from this regression were used as input to the alerting algorithms. Substitution of the count data with these residuals probably improved algorithm performance because the daily provider counts can reflect both known data features (e.g., holiday and weekend dropoffs) and unknown ones (e.g., special military events and severe weather effects). Thus, the regression can remove such features, which are irrelevant for public health purposes, from the algorithm inputs (Figure 3). In effect, the algorithms operate on the difference of the observed counts from the expected counts given the number of reporting providers. In comparison plots of actual count data and regression residuals, the day-of-week effect is strongly attenuated in the residual plot (Figure 4). Baseline lengths of 1--10 weeks were tested on the training data, and a 5-week baseline gave the best detection performance on a chosen set of outbreak signals. ResultsTwo algorithmic methods gave robust performance in detection testing on the evaluation training data sets, using a candidate set of outbreak events and the false-alert criteria described previously. The first method was to precondition all three data streams by using provider count regression and then to apply Hotelling's T2 algorithm. The second method was a multiple univariate EWMA algorithm similar to the EARS C2 method (10), with the baseline length chosen by empirical testing (Figure 3). Because these methods differed in the limited number of outbreaks not detected at the chosen false-alert rates, their outputs were combined by applying a BBN based on the joint probability distribution of the outputs calculated from the training period data. These two methods and the BBN composite were applied to the exercise-test data sets for comparison with ODG outbreak findings. Performance results are summarized separately for the respiratory and GI outbreaks (Table). For GI outbreaks at the specificity level of one false alert per 4 weeks, the median detection time was 1 day after the start date chosen by ODG epidemiologists, whereas their median unaided recognition date was 2 weeks after the start date. For the two individual algorithms, the median detection time increased to 5 days for the most constrained false-alert rate, whereas the BBN improved timeliness by 2 days. The BBN also detected an additional outbreak at the lowest specificity. Corresponding results for the respiratory outbreaks indicated that the multiple univariate method was superior in both sensitivity and timeliness at the higher specificity levels. ConclusionsJudicious data-aggregation strategies have important functions in improving detection performance of biosurveillance systems. Choosing the appropriate scope for monitored time series, stratifying and filtering patient-encounter data, and tuning algorithms effectively can improve these systems' sensitivity for early outbreak detection. The DARPA evaluation exercise provided a useful test bed for quantifying these improvements by using authentic data streams from five geographic regions. The focus on city-level outbreaks in this exercise led to an emphasis on temporal alerting methods. Both multiple univariate and multivariate approaches yielded good detection sensitivity and timeliness, and both presented challenges that indicate a need for further improvement. As ESSENCE surveillance systems become more complex, enhancement of these approaches will be important for managing the multiple-testing problem while preserving sensitivity. For the multiple univariate problem, the BBN approach appears versatile for combining separate algorithm-output streams. BBNs are also robust in that they can handle missing data in a mathematically consistent way, an important feature in syndromic surveillance, where data dropouts are common. Another advantage of BBNs is the capability to combine other evidence (e.g., sensor or environmental data) with the algorithm outputs for a fused assessment of the probability of an outbreak. Multivariate methods might have the best potential for finding faint signals distributed over multiple data sources, but adaptations are needed for specificity in the biosurveillance context. The DARPA exercise results should be understood in perspective. Using authentic clinical data from five cities, the epidemiologist team specified start dates and unaided public health recognition dates for 15 disease outbreaks. The best algorithms generated alerts within days of the start date, whereas the median gap between the start dates and recognition dates was 2 weeks. The focus on city-level outbreaks and the restriction of outbreaks to respiratory or gastrointestinal symptoms probably boosted the algorithm performance. For the more difficult challenge of a multisource, multilevel system to detect outbreaks of unconstrained symptomatology, a comprehensive evaluation with authentic data would be extremely complex. Finally, if detection algorithms can truly give advance warning of ≥1 week for certain outbreaks, the matter of how to respond to these early warnings is critical for public health decision-makers. Acknowledgments This research is sponsored by DARPA and managed under Naval Sea Systems Command (NAVSEA) contract N00024-03-D-6606. The views and conclusions contained in this document are those of the authors and should not be interpreted as necessarily representing the official policies, either expressed or implied, of DARPA, NAVSEA, or the U.S. Government. The authors wish to acknowledge the technical contributions of Anshu Saksena, Johns Hopkins University Applied Physics Laboratory. References
Figure 1 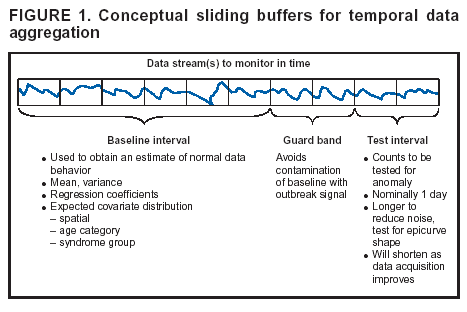 Return to top. Figure 2 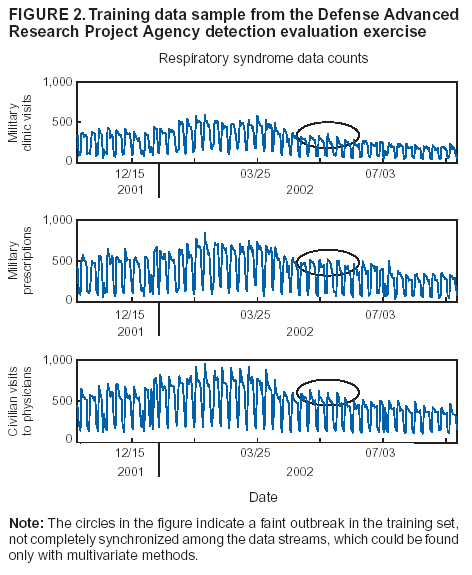 Return to top. Figure 3 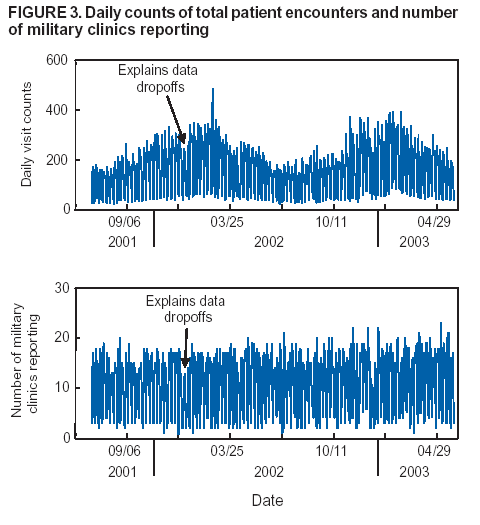 Return to top. Figure 4 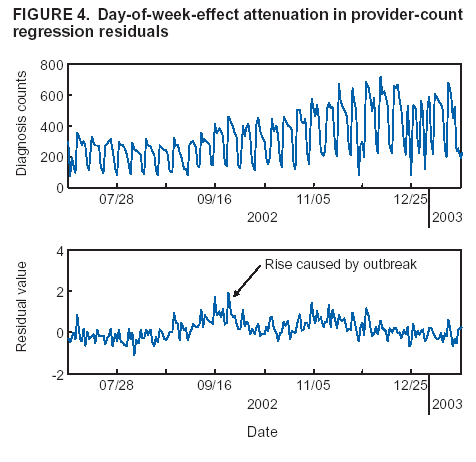 Return to top. Table 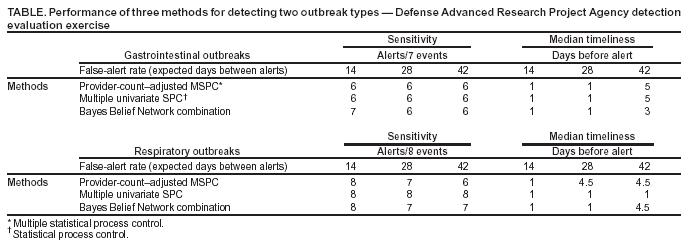 Return to top.
Disclaimer All MMWR HTML versions of articles are electronic conversions from ASCII text into HTML. This conversion may have resulted in character translation or format errors in the HTML version. Users should not rely on this HTML document, but are referred to the electronic PDF version and/or the original MMWR paper copy for the official text, figures, and tables. An original paper copy of this issue can be obtained from the Superintendent of Documents, U.S. Government Printing Office (GPO), Washington, DC 20402-9371; telephone: (202) 512-1800. Contact GPO for current prices. **Questions or messages regarding errors in formatting should be addressed to mmwrq@cdc.gov.Page converted: 9/14/2004 |
|||||||||
This page last reviewed 9/14/2004
|