Skip directly to search Skip directly to A to Z list Skip directly to site content
CDC Home

Persons using assistive technology might not be able to fully access information in this file. For assistance, please send e-mail to: mmwrq@cdc.gov. Type 508 Accommodation and the title of the report in the subject line of e-mail.

Update: Influenza Activity --- United States, 2009--10 Season

During the 2009--10 influenza season, the second wave of influenza activity from 2009 pandemic influenza A (H1N1) occurred in the United States; few seasonal influenza viruses were detected. Influenza activity* peaked in late-October and was associated with higher pediatric mortality and higher rates of hospitalizations in children and young adults than in previous seasons. The proportion of visits to health-care providers for influenza-like illness (ILI), as reported in the U.S. Outpatient Influenza-like Illness Surveillance Network (ILINet), was among the highest since ILI surveillance began in 1997 in its current form. This report summarizes influenza activity in the United States during the 2009--10 influenza season (August 30, 2009--June 12, 2010).

U.S. Viral Surveillance

Since April 2009, the beginning of the 2009 H1N1 pandemic, through June 12, 2010, approximately 740,000 influenza specimens were tested for influenza, and the number of laboratory-confirmed positives was approximately four times the average of the previous four seasons. Two peaks in percentage of specimens testing positive for influenza occurred: 43.1% in June during the initial pandemic wave, and 38.2% in October during the second wave. During August 30, 2009--June 12, 2010, the 2009--10 influenza season, World Health Organization (WHO) and National Respiratory and Enteric Virus Surveillance System (NREVSS) collaborating laboratories in the United States tested 468,218 specimens for influenza viruses; 91,152 (19.5%) were positive (Figure 1). The proportion of specimens testing positive for influenza during the 2009--10 season exceeded 20% during the week ending August 30, 2009, peaked at 38.2% during the week ending October 24, and declined to less than 10% during the week ending December 12. Of the 91,152 positive specimens from 2009--10 season, 90,758 (99.6%) were influenza A viruses and 394 (0.4%) were influenza B viruses. Among the influenza A viruses, 67,022 (73.8%) were subtyped; 66,916 (99.8%) were 2009 pandemic H1N1, 72 (0.1%) were influenza A (H3N2), and 34 (0.1%) were seasonal influenza A (H1N1) viruses.

Antigenic Characterization

Since September 1, 2009, CDC has antigenically characterized two seasonal influenza A (H1N1), 14 influenza A (H3N2), 43 influenza B, and 1,904 of the 2009 pandemic H1N1 viruses. Of those 2009 pandemic H1N1 viruses tested, 1,895 (99.5%) were related to the A/California/07/2009 (H1N1) reference virus selected by WHO as the monovalent 2009 pandemic H1N1 vaccine virus used during the 2009--10 season, and as a component in the 2010--11 Northern Hemisphere seasonal influenza vaccine.

Both seasonal influenza A (H1N1) viruses tested were related to A/Brisbane/59/2007, the influenza A (H1N1) component of the 2009--10 Northern Hemisphere influenza vaccine. The 14 influenza A (H3N2) viruses tested showed reduced titers with antisera produced against A/Brisbane/10/2007, the 2009--10 Northern Hemisphere influenza A (H3N2) vaccine component, and were antigenically related to A/Perth/16/2009, the WHO recommended influenza A (H3N2) component of the 2010 Southern Hemisphere and 2010--11 Northern Hemisphere vaccine formulations. Of the 43 influenza B viruses from the United States tested, 38 (88.4%) belonged to the B/Victoria lineage and were related to B/Brisbane/60/2008, the influenza B vaccine component for the 2009--10 and 2010--11 Northern Hemisphere influenza vaccine. Five (11.6%) viruses tested belonged to the B/Yamagata lineage.

U.S. Novel Influenza Cases

Early identification and investigation of novel influenza A cases is critical to evaluate possible human-to-human transmission. CDC conducts surveillance for human infections with novel influenza A viruses year-round and carries out extensive epidemiologic investigations on each case. During the 2009--10 season, in addition to the pandemic strain virus infections, three cases of human infection with novel influenza A viruses were identified and then characterized at CDC. These three cases, identified in Kansas, Iowa, and Minnesota, were isolated cases of human infections with contemporary North American swine-lineage influenza A (H3N2) viruses currently circulating in swine herds. No additional human cases were linked to these three patients. Although the Minnesota patient reported visiting a live animal market in the days preceding illness onset (May 8, 2010), only the Kansas patient specifically reported contact with pigs in the week preceding symptom onset (July 28, 2009). The Iowa patient had onset of symptoms in September 2009. The Kansas and Iowa patients did not require hospitalization; the Minnesota patient was hospitalized, and recovered fully.

Resistance to Antiviral Medications

In the United States, two classes of antiviral drugs are approved by the Food and Drug Administration for use in treating or preventing influenza virus infections: neuraminidase inhibitors (oseltamivir and zanamivir) and adamantanes (amantadine and rimantidine). During the 2009--10 influenza season, testing of the 2009 pandemic H1N1 viruses found that 1.1% of 4,811 tested viruses were resistant to oseltamivir. All of the oseltamivir-resistant 2009 pandemic H1N1 viruses shared a single genetic mutation conferring oseltamivir resistance.

Since September 1, 2009, one seasonal influenza A (H1N1) virus was tested and found to be resistant to oseltamivir. No oseltamivir resistance was identified among the 19 influenza A (H3N2) or the 36 influenza B viruses tested. All tested viruses retained their sensitivity to zanamivir. Adamantane resistance continued to be high among influenza A (H3N2) viruses, with 100% of the 18 influenza A (H3N2) viruses tested resistant to the adamantanes. Adamantane resistance among seasonal influenza A (H1N1) viruses was not detected in the single virus tested. However, among 2009 pandemic H1N1 viruses tested, 1,895 (99.8%) of 1,899 were resistant to adamantanes.

U.S. Outpatient Illness Surveillance

During the initial wave of 2009 pandemic H1N1 activity, the percentage of outpatient visits for ILI was at or exceeded national baseline levels§ for only 1 week (the week ending May 1, 2009), but was elevated compared with spring and summer weeks in previous years. ILI activity next exceeded baseline beginning the week ending August 23, 2009, and continued to be elevated above baseline through January 2, 2010, for a total of 19 consecutive weeks. ILI activity peaked at 7.6% during the week ending October 24, 2009 (Figure 2). During the previous three influenza seasons, the peak percentage of patient visits for ILI ranged from 3.5% to 6.0% and occurred during mid- to late February (CDC, unpublished data, 2010).

During the 2009--10 season, August 30, 2009, through June 12, 2010, the peak proportion of outpatient visits to healthcare providers for ILI was among the highest seen since the system began in its current form in 1997 and was approximately equal to that seen during the 2003--04 influenza season. During the 2003--04 season, influenza A (H3N2) predominated and affected all age groups, whereas older persons were less affected during the 2009--10 season.

U.S. State-Specific Activity Levels

State and territorial epidemiologists report the geographic distribution of influenza in their state through a weekly influenza activity code. The geographic distribution of influenza activity was most extensive during the weeks ending October 24 and 31, 2009, when 48 states reported widespread influenza activity and all 50 states reported widespread or regional influenza activity. No states reported widespread influenza activity by the week ending January 9, 2010. The peak number of states reporting widespread or regional activity during the previous three seasons has ranged from 25 to 48 states (CDC, unpublished data, 2010).

U.S. Influenza-Associated Hospitalization

Hospitalizations associated with laboratory-confirmed influenza infections have been monitored in the Emerging Infections Program (EIP) since the 2003--04 season. Historically, EIP has included sites in 10 states. In response to the emergence of the 2009 pandemic H1N1 virus, sites in six additional states conducted surveillance and reported influenza-associated hospitalization surveillance data. During September 1, 2009--May 1, 2010, data were collected by EIP and the new sites from a population base of nearly 26 million persons (8.5% of the U.S. population).

During September 1, 2009, through May 1, 2010, cumulative rates of laboratory-confirmed, influenza-associated hospitalization reported by the EIP sites for children aged ≤4 years and 5--17 years were 6.7 and 2.5 per 10,000, respectively. Cumulative rates of laboratory-confirmed influenza-associated hospitalization for adults aged 18--49 years, 50--64 years, and ≥65 years were 2.5, 3.2, and 2.8 per 10,000, respectively. In the new sites, cumulative rates of laboratory-confirmed, influenza-associated hospitalization for children aged ≤4 years and 5--17 years were 10.9 and 3.7 per 10,000, respectively. Rates for adults aged 18--49 years, 50--64 years, and ≥65 years were 1.7, 2.0, and 1.8 per 10,000, respectively. The source of rate differences between the EIP sites and the new sites are currently under investigation.

During the entire 2009 influenza A (H1N1) pandemic period, April 2009 through May 1, 2010, the cumulative rates of hospitalization for the EIP sites were 8.3 per 10,000 for ages ≤4 years, 3.4 for ages 5--17 years, 3.0 for ages 18--49 years, 3.8 for ages 50--64 years, and 3.2 for ages ≥65 years. A dramatic increase in hospitalizations in the younger age groups was indicative of the influenza pandemic's impact on children (Figure 3). During the past three seasons, rates have ranged from 2.6--4.2 per 10,000 for ages ≤4 years, 0.4--0.6 for ages 5--17 years, 0.3--0.7 for ages 18--49 years, 0.4--1.5 for ages 50--64, and 1.4--7.5 for ages ≥65 years.

In April 2009, in response to the emergence of the 2009 pandemic H1N1 virus, the Council of State and Territorial Epidemiologists (CSTE) initiated reporting of influenza-associated hospitalizations and deaths to CDC. On August 30, CDC and CSTE instituted modified case definitions for aggregate reporting of influenza-associated hospitalizations and deaths. This cumulative jurisdiction-level reporting is referred to the Aggregate Hospitalization and Death Reporting Activity (AHDRA) surveillance system.** From August 30, 2009, to April 3, 2010, a total of 41,914 laboratory-confirmed, influenza-associated hospitalizations were reported to CDC. The median number of states reporting hospitalizations per week through AHDRA was 36 (range: 29--38).

U.S. Pneumonia- and Influenza-Related Mortality

During the 2009--10 influenza season, the percentage of deaths attributed to pneumonia and influenza (P&I) exceeded the epidemic threshold†† for 13 consecutive weeks, from October 3 to December 26, 2009, and from January 16 to January 30, 2010 (Figure 4). The percentage of P&I deaths peaked twice, once at 8.1% during the week ending November 21, and again at 8.2% during the week ending January 23, 2010.

From the 2006--07 season through the 2008--09 season, the peak percentage of P&I deaths ranged from 7.7% to 9.1% and the total number of weeks above the epidemic threshold ranged from 3 to 14 (CDC, unpublished data, 2010). During the 2008--09 season, when the 2009 influenza A (H1N1) pandemic began, P&I death rates remained below epidemic threshold. The P&I mortality rate was relatively low because 2009 pandemic H1N1 primarily affected children, rather than adults aged ≥65 years; deaths among persons aged ≥65 years traditionally have accounted for 90% or more of seasonal influenza-related P&I deaths (1).

From August 30, 2009, to April 3, 2010, a total of 2,125 laboratory-confirmed, influenza-associated deaths were reported to CDC through AHDRA. The median number of states reporting influenza-associated deaths per week through AHDRA was 39 (range: 30--40).

U.S. Influenza-Related Pediatric Mortality

Laboratory-confirmed, influenza-related deaths among children have been reported to CDC since the 2004--05 season. From April 2009 through August 29, 2009, the initial pandemic wave, 65 laboratory-confirmed, influenza-associated pediatric deaths were reported to CDC. From August 30, 2009, to June 12, 2010, the 2009--10 influenza season, a total of 279 laboratory-confirmed, influenza-associated pediatric deaths were reported, nearly four times the average reported in the previous five influenza seasons. These deaths were reported from New York City and 43 states. Age-specific information was available for all 279 cases. The mean and median age was 8.8 years and 9.2 years, respectively; 52 (18.6%) were aged <2 years, 30 (10.8%) were aged 2--4 years, 103 (36.9%) were aged 5--11 years, and 94 (33.7%) were aged 12--17 years. Of the 279 deaths, 226 were associated with 2009 pandemic H1N1 virus infections, 51 with influenza A virus infection for which subtyping was not reported, and two with influenza B virus infection.

The total for the entire pandemic period, April 2009, through June 12, 2010, was 344 laboratory-confirmed, influenza-associated pediatric deaths. Among those deaths, 286 (83.1%) were laboratory-confirmed 2009 pandemic H1N1 virus infections, and 54 deaths were associated with influenza A virus infections for which the viruses were not subtyped. These unsubtyped influenza A viruses likely were 2009 pandemic H1N1 viruses, based on the predominance of this virus during the 2009--10 influenza season. These data are provisional and subject to change as more information becomes available.

Reported by

World Health Organization Collaborating Center for Surveillance, Epidemiology, and Control of Influenza. D Mustaquim, MPH, A Bishop, MPH, S Epperson, MPH, K Kniss, MPH, L Blanton, MPH, R Dhara, MPH, L Brammer, MPH, L Gubareva, MD, T Wallis, MS, X Xu, MD, J Bresee, MD, A Klimov, PhD, N Cox, PhD, L Finelli, DrPH, Influenza Div, National Center for Immunization and Respiratory Diseases, CDC.

Editorial Note

April 2009 marked the beginning of the 2009 influenza A (H1N1) pandemic. The reported rates of pediatric hospitalization and mortality were the highest recorded using current surveillance systems; however, rates of hospitalization and death were lower among older persons compared to rates typically seen during influenza A (H3N2) predominant seasons (1). Substantial levels of transmission and detection of 2009 pandemic H1N1 virus continued from the spring into summer in contrast with the usual limited and sporadic occurrence of influenza viruses during summer months. Outpatient visits for ILI continued to persist at elevated levels through the summer, although the levels reported did not exceed baseline levels, with the exception of 1 week in April, until late summer and early fall 2009.

Estimating the disease burden from influenza is challenging in part because of the nonspecific clinical symptoms of influenza and because many of those ill with an influenza infection do not seek medical care and only a small proportion of those seeking medical care are tested for influenza. An additional complication during the recent pandemic was that routinely available point-of-care tests were less sensitive for the pandemic strain than for seasonal influenza viruses, which might have reduced laboratory confirmation of influenza illnesses further (2). A recent model developed by CDC used data on influenza-associated hospitalizations collected through EIP to estimate that approximately 43--89 million persons became ill with 2009 pandemic H1N1 during April 2009 and April 2010 (3).

In the United States, 2009 pandemic H1N1 was the dominant circulating strain for the entire season. Few seasonal influenza viruses were reported to CDC, with most being influenza A (H3N2) or influenza B. Seasonal influenza A (H1N1) virtually disappeared over the course of the season, with only one confirmed case reported since late December 2009. Although 2009 pandemic H1N1 was the dominant circulating strain, influenza A (H3N2) and influenza B are still circulating worldwide.

Testing for seasonal influenza and monitoring for novel influenza virus infections should continue year-round, as should specimen submission to CDC for further antigenic analysis, vaccine strain selection, and antiviral resistance monitoring. The detection of three novel influenza cases of swine-lineage H3N2 infection since July 2009 further emphasizes the importance of continuing to monitor for novel influenza strains.

Although 2010 summer influenza activity remains low, sporadic cases of influenza have been detected in the United States this summer, including influenza A (H3N2), influenza B, and 2009 pandemic H1N1 viruses. Health-care providers should remain vigilant and consider influenza as a potential cause of summer respiratory illnesses. Public health laboratories should send to CDC virus samples that they cannot subtype using standard methods and isolates that otherwise are unusual as soon as possible after identification.

During 2009--10, a separate monovalent 2009 pandemic influenza A (H1N1) vaccine prepared from the WHO recommended A/California/7/2009 virus was used. For the 2010--11 season, the seasonal influenza A (H1N1) component of the trivalent vaccine will be replaced by the 2009 pandemic influenza A (H1N1) virus (A/California/7/2009). The Advisory Committee on Immunization Practices (ACIP) voted in February 2010 to expand the influenza vaccine recommendations to include universal vaccination of all persons aged ≥6 months. To support this recommendation, influenza vaccine is being produced in greater amounts for the 2010--11 season than in previous seasons.

As a supplement to influenza vaccination, antiviral drugs are an important adjunct to reduce the impact of influenza. Based on the low level of oseltamivir resistance observed in influenza B, seasonal influenza A (H3N2), and 2009 pandemic H1N1 viruses, in addition to the persistence of high levels of resistance to the adamantanes in influenza A (H3N2) and 2009 pandemic H1N1 viruses, neuraminidase inhibitors are the drugs of choice for treatment of influenza in children and adults in the United States at this time. Use of amantadine or rimantidine is not recommended. Additional information regarding influenza viruses, influenza surveillance, influenza vaccine, and influenza diagnosis and antiviral treatment is available at http://www.cdc.gov/flu.

Acknowledgments

This report is based, in part, on data contributed by participating state and territorial health departments and state public health laboratories, World Health Organization (WHO) collaborating laboratories, National Respiratory and Enteric Virus Surveillance System collaborating laboratories, the U.S. Outpatient ILI Surveillance Network, the Emerging Infections Program, the Aggregate Hospitalization and Death Reporting Activity, the Influenza Associated Pediatric Mortality Surveillance System, the 122 Cities Mortality Reporting System, and WHO's FluNet.

References

  1. Thompson WW, Shay DK, Weintraub E, et al. Mortality associated with influenza and respiratory syncytial virus in the United States. JAMA 2003;289:179--86.
  2. CDC. Performance of rapid influenza diagnostic tests during two school outbreaks of 2009 pandemic influenza A (H1N1) virus infection---Connecticut, 2009. MMWR 2009;58:1029--32.
  3. CDC. Updated CDC estimates of 2009 H1N1 influenza cases, hospitalizations, and deaths in the United States, April 2009--April 10, 2010. Atlanta, GA: US Department of Health and Human Services, CDC; 2010. Available at http://www.cdc.gov/h1n1flu/estimates_2009_h1n1.htm. Accessed July 23, 2010.

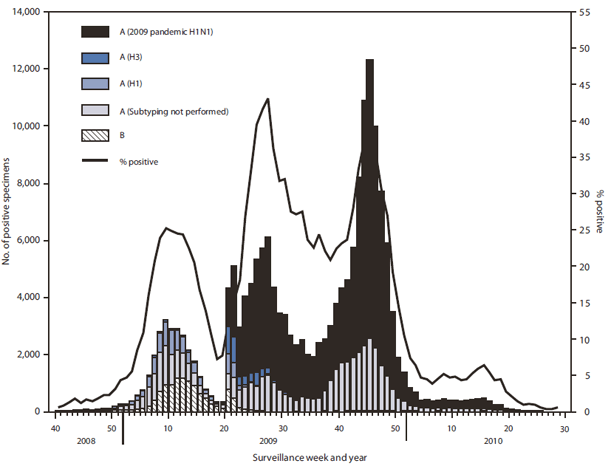
* The CDC influenza surveillance system collects five categories of information from eight data sources: 1) viral surveillance (World Health Organization collaborating laboratories, the National Respiratory and Enteric Virus Surveillance System, and novel influenza A virus case reporting); 2) outpatient illness surveillance (U.S. Outpatient Influenza-like Illness Surveillance Network); 3) mortality (122 Cities Mortality Reporting System and influenza-associated pediatric mortality reports); 4) hospitalizations (Emerging Infections Program); and 5) summary of geographic spread of influenza (state and territorial epidemiologist reports).
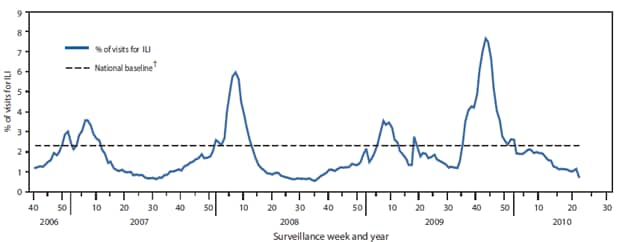
Defined as a temperature of ≥100.0°F (≥37.8°C), oral or equivalent, and cough and/or sore throat, in the absence of a known cause other than influenza.

§ The national and regional baselines are the mean percentage of visits for ILI during noninfluenza weeks for the previous three seasons plus two standard deviations. A noninfluenza week is a week during which <10% of specimens tested positive for influenza. National and regional percentages of patient visits for ILI are weighted on the bases of state population. Use of the national baseline for regional data is not appropriate.

Levels of activity are 1) no activity; 2) sporadic: isolated laboratory-confirmed influenza cases or a laboratory-confirmed outbreak in one institution, with no increase in activity; 3) local: increased ILI, or at least two institutional outbreaks (ILI or laboratory-confirmed influenza) in one region with recent laboratory evidence of influenza in that region; virus activity no greater than sporadic in other regions; 4) regional: increased ILI activity or institutional outbreaks (ILI or laboratory-confirmed influenza) in at least two but less than half of the regions in the state with recent laboratory evidence of influenza in those regions; and 5) widespread: increased ILI activity or institutional outbreaks (ILI or laboratory-confirmed influenza) in at least half the regions in the state with recent laboratory evidence of influenza in the state.

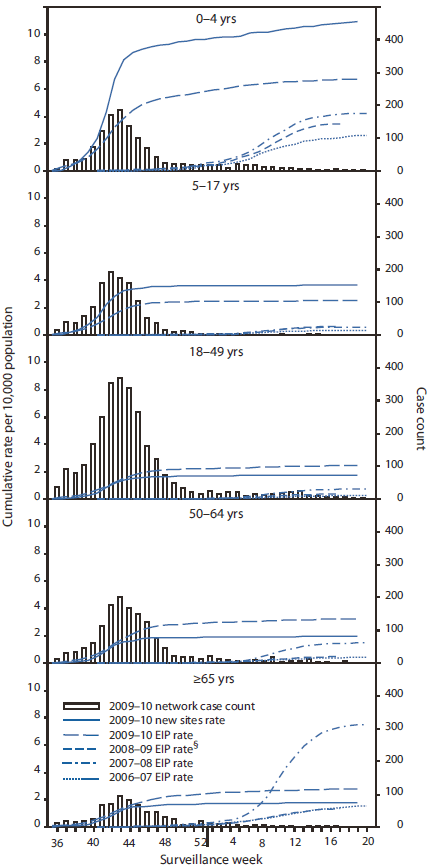
** States report weekly to the CDC either 1) laboratory-confirmed influenza hospitalizations and deaths or 2) pneumonia and influenza syndrome-based cases of hospitalization and death resulting from all types or subtypes of influenza. Although only the laboratory-confirmed cases are included in this report, CDC continues to analyze data both from laboratory-confirmed and syndromic hospitalizations and deaths. Additional information is available at http://www.cdc.gov/h1n1flu/reportingqa.htm#reportingofflu.

†† The epidemic threshold is 1.645 standard deviations above the seasonal baseline.t


What is already known on this topic?

During the 2009--10 influenza season, 2009 pandemic influenza A (H1N1) viruses predominated and few viruses from other influenza types were identified in the United States.

What is added by this report?

Influenza activity since April 2009 has been associated with an increase in laboratory virologic testing, much higher pediatric mortality, and higher rates of hospitalizations in children and young adults when compared with previous seasons.

What are the implications for public health practice?

Testing for seasonal influenza strains should continue, as should specimen submission to CDC for further antigenic analysis, vaccine strain selection, and antiviral resistance monitoring.


FIGURE 1. Number* and percentage of respiratory specimens testing positive for influenza, by type, weekly national summary --- World Health Organization and National Respiratory and Enteric Virus Surveillance System, August 30, 2008 -- June 12, 2010§

The figure shows the number and percentage of respiratory specimens testing positive for influenza, by type, weekly national summary during August 30, 2008 - June 12, 2010. During August 30, 2009-June 12, 2010, World Health Organization (WHO) and National Respiratory and Enteric Virus Surveillance System (NREVSS) collaborating laboratories in the United States tested 468,218 specimens for influenza viruses; 91,152
(19.5%) were positive.

* N = 90,298

Influenza A (unable to be subtyped) not shown; n = 1,036.

§ As of June 19, 2010.

Alternate Text: The figure above shows the number and percentage of respiratory specimens testing positive for influenza, by type, weekly national summary during August 30, 2008 - June 12, 2010. During August 30, 2009-June 12, 2010, World Health Organization (WHO) and National Respiratory and Enteric Virus Surveillance System (NREVSS) collaborating laboratories in the United States tested 468,218 specimens for influenza viruses; 91,152 (19.5%) were positive.


FIGURE 2. Percentage of outpatient visits for influenza-like illness (ILI), by week and year --- U.S. Outpatient Influenza-Like Illness Surveillance Network (ILINet), October 1, 2006--June 12, 2010*

The figure shows the percentage of outpatient visits for influenza-like illness (ILI) reported by the U.S. Outpatient Influenza-Like Illness Surveillance Network
(ILINet), weekly national summary during October 1, 2006 - June 12, 2010. During the spring wave of 2009 pandemic H1N1 activity, the percentage of outpatient visits for ILI was at or exceeded national baseline levels for only 1 week (the week ending May 1, 2009) but was elevated compared to previous seasons. The weekly percentage of outpatient visits for ILI reported by ILINet was at or exceeded national baseline levels (2.3%) for 19 consecutive weeks, from August 23, 2009 to January 2, 2010, and peaked at 7.6% during the week ending
October 24, 2009.

* As of June 19, 2010.

National and regional baselines are the mean percentage of visits for ILI during non-influenza weeks for the previous three seasons plus two standard deviations. A non-influenza week is a week during which <10% of specimens tested positive for influenza. National and regional percentages of patient visits for ILI are weighted on the basis of state population. Use of the national baseline for regional data is not appropriate.

Alternate Text: The figure above shows the percentage of outpatient visits for influenza-like illness (ILI) reported by the U.S. Outpatient Influenza-Like Illness Surveillance Network (ILINet), weekly national summary during October 1, 2006 - June 12, 2010. During the spring wave of 2009 pandemic H1N1 activity, the percentage of outpatient visits for ILI was at or exceeded national baseline levels for only 1 week (the week ending May 1, 2009) but was elevated compared to previous seasons. The weekly percentage of outpatient visits for ILI reported by ILINet was at or exceeded national baseline levels (2.3%) for 19 consecutive weeks, from August 23, 2009 to January 2, 2010, and peaked at 7.6% during the week ending October 24, 2009.


FIGURE 3. Cumulative rate of laboratory-confirmed influenza-associated hospitalizations, by age group and year --- Emerging Infections Program (EIP) and six new sites,* 2006--10 U.S. influenza seasons

The figure shows the cumulative rate of laboratory-confirmed, influenza-associated hospitalizations from the 2006-10 influenza seasons, by age group and year from Emerging Infections Program (EIP) and six new sites. During the 2009 Influenza A (H1N1) pandemic, the cumulative rates of hospitalization for the EIP sites from April 2009 to March 2010 were 8.3 per 10,000 for ages ≤4 years, 3.4 for ages 5-17 years, 3.0 for ages 18-49 years, 3.8 for ages 50-64 years, and 3.2 for ages ≥65 years. A dramatic increase in hospitalizations in the younger age groups was indicative of the influenza pandemic's impact on children.

* In 2009, new sites in six additional states were added to the sites in the 10 states already participating in EIP. These sites report to CDC laboratory-confirmed influenza hospitalizations resulting from all types or subtypes of influenza.

As of June 19, 2010.

§ The 2008--09 EIP rate ended as of April 14, 2009, because of onset of the 2009 H1N1 season.

Alternate Text: The figure above shows the cumulative rate of laboratory-confirmed, influenza-associated hospitalizations from the 2006-10 influenza seasons, by age group and year from Emerging Infections Program (EIP) and six new sites. During the 2009 Influenza A (H1N1) pandemic, the cumulative rates of hospitalization for the EIP sites from April 2009 to March 2010 were 8.3 per 10,000 for ages ≤4 years, 3.4 for ages 5-17 years, 3.0 for ages 18-49 years, 3.8 for ages 50-64 years, and 3.2 for ages ≥65 years. A dramatic increase in hospitalizations in the younger age groups was indicative of the influenza pandemic's impact on children.


FIGURE 4. Percentage of all deaths attributed to pneumonia and influenza (P&I), by week and year --- 122 Cities Mortality Reporting System, United States, 2005--2010

The figure shows the percentage of all deaths attributed to pneumonia and influenza (P&I), by week and year in the United States from 2005-2010, with 122 cities reporting to the Mortality Reporting System. During the 2009-10 influenza season, the percentage of deaths attributed to pneumonia and influenza (P&I) exceeded the epidemic threshold for 13 consecutive weeks, from October 3 to December 26, 2009, and from January 16 to January 30, 2010.

* The epidemic threshold is 1.645 standard deviations above the seasonal baseline.

The seasonal baseline is projected using a robust regression procedure that applies a periodic regression model to the observed percentage of deaths from P&I during the preceding 5 years.

Alternate Text: The figure above shows the percentage of all deaths attributed to pneumonia and influenza (P&I), by week and year in the United States from 2005-2010, with 122 cities reporting to the Mortality Reporting System. During the 2009-10 influenza season, the percentage of deaths attributed to pneumonia and influenza (P&I) exceeded the epidemic threshold for 13 consecutive weeks, from October 3 to December 26, 2009, and from January 16 to January 30, 2010.


Use of trade names and commercial sources is for identification only and does not imply endorsement by the U.S. Department of Health and Human Services.

References to non-CDC sites on the Internet are provided as a service to MMWR readers and do not constitute or imply endorsement of these organizations or their programs by CDC or the U.S. Department of Health and Human Services. CDC is not responsible for the content of pages found at these sites. URL addresses listed in MMWR were current as of the date of publication.


All MMWR HTML versions of articles are electronic conversions from typeset documents. This conversion might result in character translation or format errors in the HTML version. Users are referred to the electronic PDF version (http://www.cdc.gov/mmwr) and/or the original MMWR paper copy for printable versions of official text, figures, and tables. An original paper copy of this issue can be obtained from the Superintendent of Documents, U.S. Government Printing Office (GPO), Washington, DC 20402-9371; telephone: (202) 512-1800. Contact GPO for current prices.

**Questions or messages regarding errors in formatting should be addressed to mmwrq@cdc.gov.

 
USA.gov: The U.S. Government's Official Web PortalDepartment of Health and Human Services
Centers for Disease Control and Prevention   1600 Clifton Road Atlanta, GA 30329-4027, USA
800-CDC-INFO (800-232-4636) TTY: (888) 232-6348 - Contact CDC–INFO
A-Z Index
  1. A
  2. B
  3. C
  4. D
  5. E
  6. F
  7. G
  8. H
  9. I
  10. J
  11. K
  12. L
  13. M
  14. N
  15. O
  16. P
  17. Q
  18. R
  19. S
  20. T
  21. U
  22. V
  23. W
  24. X
  25. Y
  26. Z
  27. #