|
|
|
|
|
|
|
| ||||||||||
|
|
|
|
|
|
|
||||
| ||||||||||
|
|
|
|
|
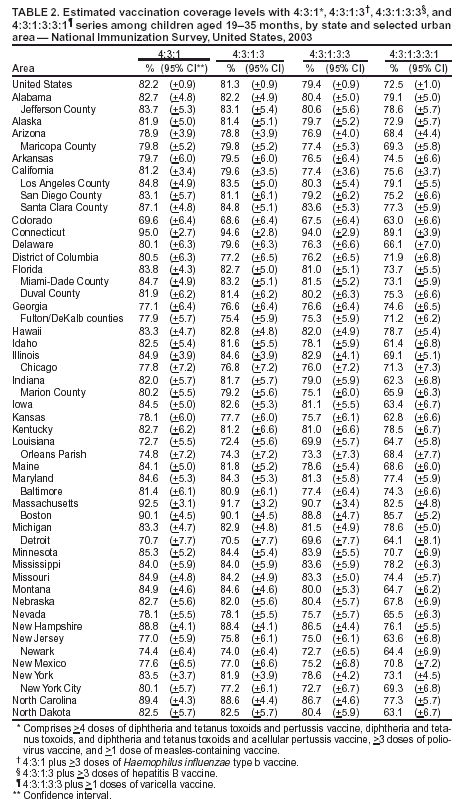
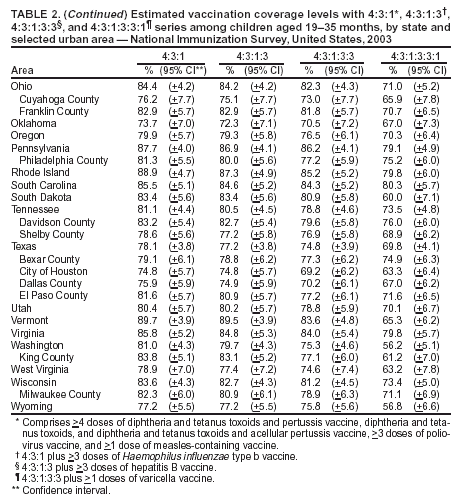
Persons using assistive technology might not be able to fully access information in this file. For assistance, please send e-mail to: mmwrq@cdc.gov. Type 508 Accommodation and the title of the report in the subject line of e-mail. National, State, and Urban Area Vaccination Coverage Among Children Aged 19--35 Months --- United States, 2003Each annual birth cohort in the United States comprises approximately 4 million infants. Maintaining the gains in vaccination coverage achieved during the 1990s among these children poses a continuing challenge for public health practitioners. The National Immunization Survey (NIS) provides estimates of vaccination coverage among children aged 19--35 months for each of the 50 states and 28 selected urban areas*. This report summarizes NIS results for 2003†, which indicated substantial increases nationwide in coverage with >1 dose of varicella vaccine (VAR) and >3 doses of pneumococcal conjugate vaccine (PCV) and the highest coverage ever for all vaccines; however, wide variability in coverage continues among states and urban areas. Continued vigilance is needed to maintain high levels of coverage, and sustained efforts will be required to reduce geographic disparities in coverage. To collect vaccination data for all age-eligible children, NIS uses a quarterly random-digit--dialing sample of telephone numbers for each of the 78 survey areas. NIS methodology, including the weighting of responses to represent the population of children aged 19--35 months, has been described previously (1,2). During 2003, health-care provider vaccination records were obtained for 21,210 children. The overall response rate for eligible households was 62.7%. National vaccination coverage with >1 dose of VAR increased from 80.6% (95% confidence interval [CI] = +0.9%) in 2002 to 84.8% (95% CI = +0.8%) in 2003. Coverage for >3 doses of PCV increased from 40.9% (95% CI = +1.1%) in 2002 to 68.1% (95% CI = +1.0%) in 2003. Coverage for >4 doses of PCV, reported for the first time in 2003, was 36.7% (95% CI = +1.1%). For all other vaccines and series, coverage increased in 2003 compared with 2002 (Table 1). In 2003, substantial differences remained in estimated vaccination coverage among states (Table 2). Estimated coverage with the 4:3:1:3:3 series§ ranged from 94.0% in Connecticut to 67.5% in Colorado. The range in coverage among the 28 urban areas was less than that among the states. Among the 28 urban areas, the highest estimated coverage for the 4:3:1:3:3 series was 88.8% in Boston, Massachusetts, and the lowest was 69.2% in Houston, Texas. Reported by: L Barker, PhD, J Santoli, MD, Immunization Svcs Div; M McCauley, MTSC, Office of the Director, National Immunization Program, CDC. Editorial Note:The findings in this report indicate that among U.S. children aged 19--35 months, estimated coverage with recommended vaccines was greater in 2003 than in 2002 and represented all-time highs. In addition, coverage for the two most recently recommended vaccines, VAR and PCV, increased substantially. The increases in coverage reflect ongoing progress toward achieving the 2010 national health objectives for childhood vaccinations (objectives 14-22 to 14-24) (3). Notably, vaccine coverage for the fourth dose of diphtheria and tetanus toxoids and acellular pertussis (DTaP) vaccine continues to lag behind other vaccines in the 4:3:1:3:3 series, reducing the coverage percentage for the overall series. Continued vigilance is needed to maintain high levels of coverage. Moreover, increasing coverage in areas where coverage is low remains a priority to reduce the risk for infection and ongoing transmission if disease is introduced. The findings in this report are subject to at least three limitations. First, NIS is a telephone survey; although statistical weights adjust for nonresponse and households without telephones, some bias might remain. Second, NIS relies on provider-verified vaccination histories and assumes that coverage among children whose providers did not respond is similar to that among children whose providers responded; incomplete records and reporting could result in underestimates of coverage. Finally, although national estimates are precise, estimates for states and urban areas should be interpreted with caution (4). Shortages in the supplies of several vaccines used for routine childhood vaccination began in late 2000. Most of these shortages (i.e., DTaP; measles, mumps, and rubella [MMR]; VAR; and combined tetanus and diphtheria toxoids [Td]) ended during 2002; however, a shortage of PCV continued until May 2003 (and was followed by a new PCV shortage in 2004). Although children in the 2003 cohort were eligible to receive one or more vaccines during the shortages, the data in this report do not indicate a negative impact of the vaccine shortage on vaccination coverage of DTaP or MMR at a national level. The effect of the shortage on the rate of increase in usage of VAR or PCV is unknown. Additional analyses of NIS data are necessary to define the impact of the vaccine supply shortages. A previous analysis focused on the timeliness of vaccination with the third and fourth doses of DTaP and the first dose of MMR for children included in the 2001 and 2002 NIS (5). Among children vaccinated only at public clinics or who resided outside metropolitan statistical areas or in the Southern United States census region, those eligible to receive the fourth dose of DTaP during the shortage were less likely to receive it than those who were eligible at some time other than the shortage. No adverse impact on coverage during the shortages was determined for the third dose of DTaP or the first dose of MMR. In addition, a supplementary NIS survey module is being conducted during 2004 to assess parental reports of deferral of vaccination during the shortages and receipt of recall messages from providers. Given the most recent PCV shortage, which began early in 2004 and has begun to resolve (6--8), and the likelihood that vaccine shortages will continue to occur (9,10), further analyses will be necessary to develop strategies to manage future vaccine supply shortages. References
* Jefferson County, Alabama; Maricopa County, Arizona; Los Angeles, San Diego, and Santa Clara counties, California; District of Columbia; Miami-Dade and Duval counties, Florida; Fulton/DeKalb counties, Georgia; Chicago, Illinois; Marion County, Indiana; Orleans Parish, Louisiana; Baltimore, Maryland; Boston, Massachusetts; Detroit, Michigan; Newark, New Jersey; New York, New York; Cuyahoga and Franklin counties, Ohio; Philadelphia County, Pennsylvania; Davidson and Shelby counties, Tennessee; Bexar, Dallas, and El Paso counties, and Houston, Texas; King County, Washington; and Milwaukee County, Wisconsin. † For the 2003 reporting period, NIS included children born during February 2000 --June 2002. § Comprises >4 doses of diphtheria and tetanus toxoids and pertussis vaccine, diphtheria and tetanus toxoids, and diphtheria and tetanus toxoids and acellular pertussis (DTP/DT/DTaP) vaccine; >3 doses of poliovirus vaccine; >1 dose of measles-containing vaccine (MCV); >3 doses of Haemophilus influenzae type B vaccine (Hib); and >3 doses of hepatitis B vaccine (hep B).
Disclaimer All MMWR HTML versions of articles are electronic conversions from ASCII text into HTML. This conversion may have resulted in character translation or format errors in the HTML version. Users should not rely on this HTML document, but are referred to the electronic PDF version and/or the original MMWR paper copy for the official text, figures, and tables. An original paper copy of this issue can be obtained from the Superintendent of Documents, U.S. Government Printing Office (GPO), Washington, DC 20402-9371; telephone: (202) 512-1800. Contact GPO for current prices. **Questions or messages regarding errors in formatting should be addressed to mmwrq@cdc.gov.Page converted: 7/28/2004 |
|||||||||
This page last reviewed 7/28/2004
|