|
|
|
|
|
|
|
| ||||||||||
|
|
|
|
|
|
|
||||
| ||||||||||
|
|
|
|
|
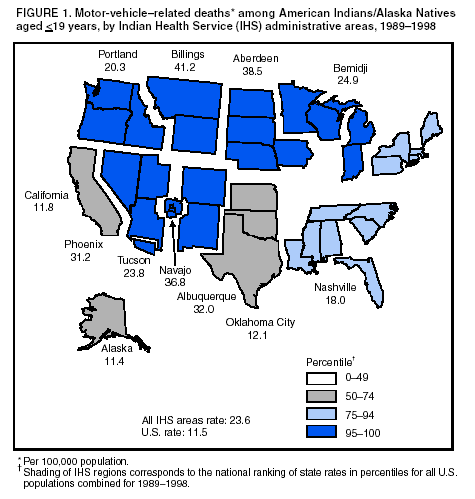
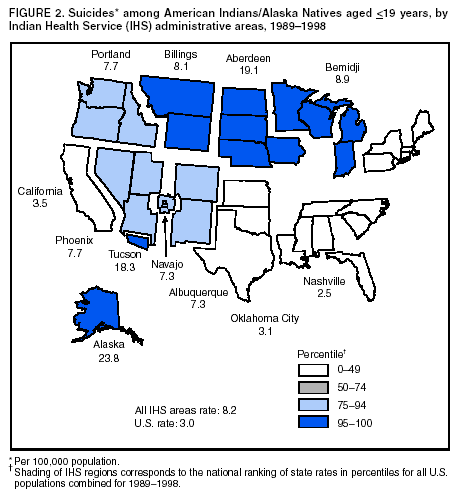
Persons using assistive technology might not be able to fully access information in this file. For assistance, please send e-mail to: mmwrq@cdc.gov. Type 508 Accommodation and the title of the report in the subject line of e-mail. Injury Mortality Among American Indian and Alaska Native Children and Youth --- United States, 1989--1998Injuries account for 75% of all deaths among American Indian and Alaska Native (AI/AN) children and youth (1), and AI/ANs have an overall injury-related death rate that is twice the U.S. rate for all racial/ethnic populations (2). However, rate disparities vary by area and by cause. To help focus prevention efforts, CDC analyzed injury mortality data by Indian Health Service (IHS) administrative area and by race/ethnicity. This report summarizes the results of these analyses, which indicate that although death rates for some causes (e.g. drowning and fire) have shown substantial improvement over time, rates for other causes have increased or remained unchanged (e.g., homicide and suicide, respectively). Prevention strategies should focus on the leading causes of injury-related death in each AI/AN community, such as motor-vehicle crashes, suicides, and violence. Mortality data were obtained from CDC's National Center for Health Statistics (NCHS) for 1989--1998 for black and white children and youth (i.e., those aged <19 years) and from NCHS mortality data that IHS has categorized into the 12 IHS administrative areas* in which AI/AN children and youth reside. Rate calculations were based on deaths attributed to injuries that occurred among children and youth. All rates were age-adjusted by using the 2000 U.S. standard population. AI/AN rates were calculated by using the IHS service population for 1989--1998 on the basis of modified 1990 census data and vital-event data for 1989--1998. Black, white, and overall U.S. death rates were calculated by using CDC's Web-Based Injury Statistics Query and Reporting System (WISQARS) (3). The external cause of each injury death was derived from the International Classification of Diseases, Ninth Revision (ICD-9) E-codes. Causes of death included unintentional motor-vehicle crashes, unintentional pedestrian events, firearm use, suicide, homicide, unintentional drowning, and unintentional fire. The firearm category included all firearm-related deaths, including those from suicide, homicide, and unintentional or undetermined intent. Because of changes in code definitions and coding rules between ICD-9 (1998 data and earlier) and ICD-10 (1999 and later), analyses that combine data across coding schemes are problematic for some causes; for this reason, the study period ended with 1998 mortality data. During 1989--1998, injuries and violence were associated with 3,314 deaths among AI/ANs aged <19 years residing in IHS areas. Motor-vehicle crashes were the leading cause of injury-related death, followed by suicide, homicide, drowning, and fires (Table). Death rates for all causes were higher among AI/AN males than females; however, the difference was smaller for fire-related deaths. During 1989--1998, injury death rates declined for AI/ANs from all motor-vehicle crashes (14%), drownings (34%), and fires (49%), and for pedestrians (56%); rates increased for firearm-related death (13%) and homicide (20%) and remained unchanged for suicide (Table). When method was assessed, increases in the rate of firearm-related homicide accounted for the overall increase in the overall homicide rate. AI/AN motor-vehicle--related death rates by IHS area ranged from 11.4 per 100,000 population in the Alaska area to 41.2 in the Billings area. The Aberdeen and Billings areas had rates more than three times higher than national rates (Figure 1). Eight of the areas had motor-vehicle--related death rates higher than the 95th percentile of all state rates (Figure 1). Rates in the California and Oklahoma areas were similar to national rates. AI/AN suicide rates were highest in the Tucson, Aberdeen, and Alaska areas (Figure 2). These areas had rates that were five to seven times higher than overall U.S. rates. Northern areas such as Aberdeen, Alaska, Bemidji, and Billings all had suicide rates higher than the 95th percentile of all state rates. The lowest suicide rates occurred in the California, Nashville, and Oklahoma areas (Figure 2). Firearms (52%) and hanging (37%) were the leading methods of suicide for AI/AN youth. Despite decreases in injury rates for some causes, AI/AN rates for all injuries combined were two times greater than overall U.S. rates (49.4 versus 24.0, respectively). Compared with blacks and whites, AI/AN children and youth had the highest injury-death rates for motor-vehicle crashes, pedestrian events, and suicide. Rates for these causes among AI/AN children and youth were two to three times greater than rates for whites the same age. Black children and youth had the highest rates for homicide and firearm deaths. AI/AN and black children and youth had similar rates for fire-related deaths and drowning, and both groups had higher rates than white children and youth (Table). Reported by: LJD Wallace, MSEH, R Patel, MPH, A Dellinger PhD, Div of Unintentional Injury Prevention, National Center for Injury Prevention and Control, CDC. Editorial Note:AI/AN children and youth are at greater risk for preventable injury-related death than other children in the United States. Although AI/AN death rates from motor-vehicle crashes, pedestrian events, drowning, and fire decreased during 1989--1999, the overall injury disparity compared with rates for whites persists. AI/AN children and youth have not benefitted to the same degree as white children and youth from interventions in areas such as traffic safety (e.g., increased child-restraint use, safety-belt use, and reductions in alcohol-impaired driving) (4). Primary enforcement of occupant-restraint laws (i.e., stopping a driver solely for a restraint violation) combined with active enforcement and public awareness are the most effective strategies for increasing occupant-restraint use (5). The majority of AI/AN tribes are considered sovereign nations and pass and enforce their own traffic-safety laws. Several tribes have passed occupant-protection laws, but enforcement of these laws often is challenging for the mostly rural tribal police departments (4). AI/ANs have the highest alcohol-related motor-vehicle--death rates of all racial/ethnic groups (6), which places children at risk when riding with impaired drivers and puts youth at risk as drivers and passengers. In states with reservations, an estimated 75% of suicides, 80% of homicides, and 65% of motor-vehicle--related deaths among AI/ANs involve alcohol (7). Young drivers are at risk particularly for dying in a car crash as a result of driver inexperience, nighttime driving, and alcohol use. Several tribes have the authority to restrict driving privileges on the reservations, enforce a lower blood-alcohol concentration (BAC) limit (e.g., 0.02 g/dL BAC for underage drinking), and set curfew ordinances to help reduce deaths from motor-vehicle crashes (4). During 1989--1999, homicide accounted for the largest increase in injury-death rates among AI/ANs. Despite advances in knowledge about how to prevent youth violence (8), more needs to be learned about how to apply these advances to the prevention of youth violence in AI/AN communities. Suicide rates for AI/AN youth did not decline during the study period and were especially high in the Alaska, Aberdeen, and Tucson areas. The AI/AN Community Suicide-Prevention Center and Network in New Mexico has reduced suicides among AI/AN youth with a community-based approach involving school-based youth helpers, mental health referral and assistance, and outreach to families (9). Additional research is needed to determine the risk factors and reasons for the substantially higher suicide rates in the Alaska and Aberdeen areas and for the protective factors in other IHS areas with lower rates. The findings in this report are subject to at least one limitation. Injury-mortality rates probably underestimate the true rates for AI/ANs because of the misclassification of race/ethnicity on state death certificates (10). Misclassification of AI/AN race/ethnicity is estimated to range from 30% (California) to 1% (Navajo Nation) depending on IHS area (10). AI/AN tribes and IHS recognize the importance of preventing injuries and are working to reduce this burden. In 2000, IHS funded 25 tribes for 5 years to build tribal capacity in injury prevention by establishing injury-prevention programs in tribal health departments. The majority of these programs address occupant protection for reducing motor-vehicle--related injuries and other high-priority injuries depending on local need. In Alaska, strategies include float-coat and personal flotation--device promotion and distribution programs to prevent drowning, safe firearm storage with gun-safe programs, and suicide- prevention programs. Substantial improvements also have been made in reducing fire-related deaths among AI/ANs. One promising intervention program is Sleep Safe, a smoke alarm--distribution and education program targeting children and families in AI/AN Headstart Schools. Sleep Safe, which is supported by IHS and the U.S. Fire Administration, has funded programs in 55 Headstart schools and has distributed approximately 11,000 smoke alarms to AI/AN families (H. Cully, Oklahoma Area IHS, personal communication, 2003). Interventions should be tailored to specific local settings and problems. For interventions to be successful, local practices and cultures need to be considered. Such efforts are needed to reduce and eliminate the injury-disparity gap between AI/AN and other U.S. children. References
* Aberdeen, Alaska, Albuquerque, Bemidji, Billings, California, Nashville, Navajo, Oklahoma, Phoenix, Portland, and Tucson.
Figure 1
Disclaimer All MMWR HTML versions of articles are electronic conversions from ASCII text into HTML. This conversion may have resulted in character translation or format errors in the HTML version. Users should not rely on this HTML document, but are referred to the electronic PDF version and/or the original MMWR paper copy for the official text, figures, and tables. An original paper copy of this issue can be obtained from the Superintendent of Documents, U.S. Government Printing Office (GPO), Washington, DC 20402-9371; telephone: (202) 512-1800. Contact GPO for current prices. **Questions or messages regarding errors in formatting should be addressed to mmwrq@cdc.gov.Page converted: 7/31/2003 |
|||||||||
This page last reviewed 7/31/2003
|