|
|
|
|
|
|
|
| ||||||||||
|
|
|
|
|
|
|
||||
| ||||||||||
|
|
|
|
|
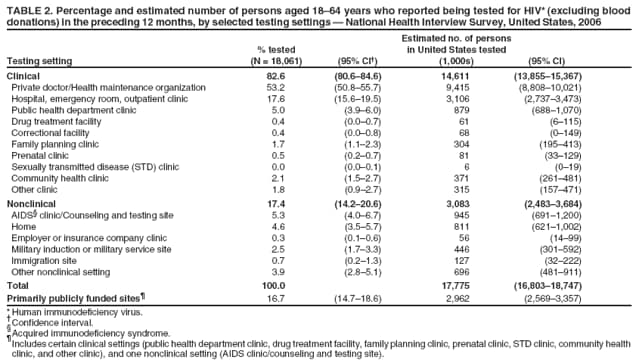
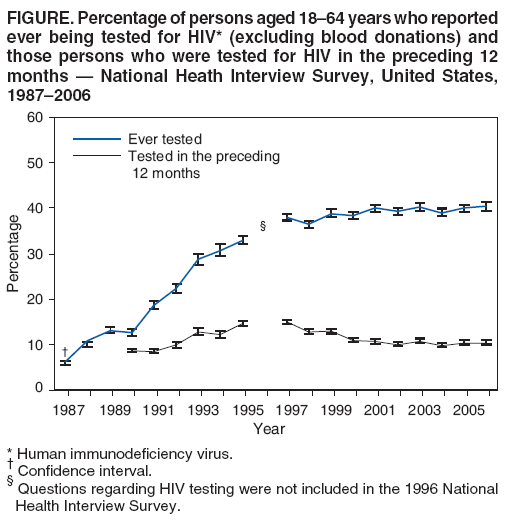
Persons using assistive technology might not be able to fully access information in this file. For assistance, please send e-mail to: mmwrq@cdc.gov. Type 508 Accommodation and the title of the report in the subject line of e-mail. Persons Tested for HIV --- United States, 2006Early diagnosis of human immunodeficiency virus (HIV) infection enables infected persons to obtain medical care that can improve the quality and length of their lives and adopt behaviors to prevent further HIV transmission. However, at the end of 2003, approximately one fourth of the estimated 1 million persons living with HIV remained unaware of their infection (1). Among all persons with HIV infection diagnosed in 2005, 38% received a diagnosis of acquired immunodeficiency syndrome (AIDS) within 1 year of their first positive HIV test (2). To reduce the number of persons with undiagnosed HIV infection, CDC issued recommendations in September 2006 to implement HIV screening as part of routine medical care for all persons aged 13--64 years (3). To establish a baseline for evaluating the effects of these recommendations and other strategies to increase HIV testing, CDC analyzed data from the National Health Interview Survey (NHIS). This report summarizes the results of that analysis, which indicated that testing rates remained nearly flat during 2001--2006. In 2006, 40.4% (an estimated 71.5 million persons) of U.S. adults aged 18--64 years reported ever being tested for HIV infection. In addition, 10.4% (an estimated 17.8 million persons) reported being tested in the preceding 12 months, and 23% of persons who acknowledged having HIV risk factors reported being tested in the preceding 12 months. These findings indicate that many persons in the United States have never been tested for HIV infection. Health-care providers should routinely screen all patients aged 13--64 years for HIV in accordance with CDC recommendations (3). New strategies are warranted to increase HIV testing, particularly among persons who are disproportionately affected by HIV infection. NHIS is an annual, cross-sectional, multistage probability sample household survey that provides prevalence estimates for a broad range of health measures for the civilian, noninstitutionalized U.S. population (4). Estimates are based on in-person interviews with a nationally representative sample of adults aged >18 years. In 2006, the response rate was 70.8% (4). This report presents NHIS data for adults aged 18--64 years living in the 50 states and District of Columbia. Respondents were asked whether they had ever been tested for HIV (excluding tests done for blood donations), and if so, the month and year of their most recent test.* Additional variables analyzed in 2006 included age, sex, race/ethnicity, region of residence, pregnancy status (of women aged 18--49 years) at the time of interview, HIV risk factor status, and type of testing setting. The survey did not elicit specific HIV-risk behaviors, but asked respondents to indicate whether any of a group of risk categories applied to them, without stating which category.† To examine trends in testing, percentages of persons tested were calculated using annual NHIS data for the period 1987--2006. Estimates were weighted for unequal selection probabilities and nonresponse, using statistical software designed to adjust for the complex sampling design. The method used for calculating the percentage of persons tested in this analysis differs from a previous analysis using NHIS data (5). In the previous analysis, respondents with missing data regarding HIV testing status were included in denominators, but lack of data for the numerator assumed they had not been tested. In this analysis, to minimize underestimation, such respondents (4.7% of the sample) were excluded from denominators. Therefore, the results of this analysis cannot be compared directly to the results in the previous report. The percentage of persons ever tested for HIV increased from 6.0% in 1987 to 38.0% in 1997, and then ranged from 36.4% to 38.4% during 1998--2000 (Figure). Since 2001, the percentages have remained stable, at approximately 40%. In 2006, 40.4% of respondents (an estimated 71.5 million persons) reported ever being tested for HIV. The percentage of persons who reported being tested for HIV in the preceding 12 months increased from 6.9% in 1990 to 15.0% in 1997, and then declined to 11.0% in 2000. These percentages remained stable at approximately 10% during 2001--2006 (Figure). In 2006, 10.4% of respondents (an estimated 17.8 million persons) reported being tested in the preceding 12 months. In 2006, greater percentages of persons aged 18--34 years, women, and residents of the South region of the United States reported being tested for HIV during the preceding 12 months than did persons aged 35--64 years, men, and residents of other regions (Table 1). Among racial/ethnic populations, the greatest percentage tested was among non-Hispanic blacks, compared with Hispanics and non-Hispanic whites (21.7% versus 12.6% and 8.0%, respectively). Among women who were pregnant at the time of interview, 60.7% reported being tested for HIV in the preceding 12 months, compared with 12.8% of nonpregnant women. Among respondents who reported having an HIV risk factor, 23.0% reported having been tested for HIV in the preceding 12 months, compared with 10.1% of those who did not report having an HIV risk factor (Table 1). By testing setting, 82.6% (an estimated 14.6 million persons) of those persons who reported being tested for HIV in the preceding 12 months reported being tested in a clinical setting (Table 2); 53.2% (an estimated 9.4 million persons) reported being tested in a private doctor/health maintenance organization setting, and 17.6% (an estimated 3.1 million persons) reported being tested in a hospital, emergency room, or outpatient clinic. In addition, 16.7% of those persons who reported being tested for HIV in the preceding 12 months were tested at sites that are primarily publicly funded.§ Reported by: D Duran, MPH, J Beltrami, MD, R Stein, PhD, A Voetsch, PhD, B Branson, MD, Div of HIV/AIDS Prevention, National Center for HIV/AIDS, Viral Hepatitis, STD, and TB Prevention. Editorial Note:During 2001--2006, HIV testing rates among adults remained nearly flat. The percentage of persons who reported ever being tested for HIV was approximately 40%. The number of persons being tested during each 12-month period also remained stable. These results suggest that, during 2001--2006, some persons were tested repeatedly while the majority of persons remained untested. The proportion of persons who are tested repeatedly is unknown. However, in 2005, 67% of persons tested at sites that are primarily publicly funded reported having had a previous HIV test (CDC, unpublished data, 2005). After several years of steady increases in overall testing associated with targeted strategies, the data in this report suggest that progress in HIV testing stalled in the mid- to late- 1990s and new strategies such as expanded screening in health-care settings appear to be warranted. However, barriers to promoting expanded screening in health-care settings exist, including lack of coverage for HIV screening by some health insurance carriers, laws or regulations requiring pretest counseling and written consent in several states, competing priorities in busy clinical settings, and limited resources for care of persons with an HIV-positive test result. In addition, 77.0% of persons with HIV risk factors were not tested in the preceding 12 months; annual testing of persons with HIV risk factors has been recommended by CDC since 2006 (3). Additional testing strategies also are needed in the community to reach persons without access to health care. Routine prenatal HIV screening has been recommended by CDC since 1995 and by the American College of Obstetricians and Gynecologists since 1999 (6). However, among women who were pregnant at the time of their NHIS interview in 2006, 60.7% reported being tested for HIV infection in the preceding 12 months. That percentage is considerably lower than rates of screening reported for other infectious diseases. During 1998--1999, rates of prenatal screening at eight sentinel surveillance sites were >95% for hepatitis B, rubella, and syphilis (7). One possible reason for the relatively lower rate of HIV testing among pregnant women is that HIV testing, unlike these others infectious diseases, is not currently included by the American Medical Association as one of the defined components of the obstetric panel Common Procedural Terminology (CPT) code, which includes blood count, HBsAg, rubella antibody, syphilis screen, and blood type and group. Although a greater percentage (21.7%) of non-Hispanic blacks reported being tested in the preceding 12 months than non-Hispanic whites or Hispanics, non-Hispanic blacks are disproportionately affected by HIV/AIDS. In 2006, non-Hispanic blacks accounted for 49% of all reported cases of HIV/AIDS (2); in addition, during 1999--2002, the HIV prevalence among non-Hispanic blacks was 2.1%, compared with 0.4% in the overall U.S. population (8). The findings in this report are subject to at least three limitations. First, NHIS data are self-reported and subject to recall bias and potential underreporting of sensitive information such as HIV testing, HIV risk factor status, and use of potentially stigmatized health-care services (e.g., sexually transmitted disease clinics). Second, NHIS excludes active military personnel and those who live outside of households (e.g., persons who are incarcerated, in long-term care institutions, or homeless). Certain persons in these populations might be at greater risk for HIV infection than persons in households. Finally, the NHIS sample does not include persons aged 13--17 years, who are included in CDC's 2006 HIV testing recommendations. The findings help confirm that new strategies are warranted to increase HIV testing, particularly among persons who are disproportionately affected by HIV infection. These include the 2006 recommendations (3) and CDC's Heightened National Response to the HIV/AIDS Crisis in the African American Community initiative, which is pursuing various efforts to increase testing (9). In addition, as part of the President's Domestic HIV Initiative, in 2007, CDC allocated funds to 23 jurisdictions to expand routine HIV testing in clinical settings, primarily among blacks. The goals for this initiative are to test approximately 1 million persons and identify 20,000 HIV-infected persons who were previously unaware of their infection. Other federal agencies are collaborating to increase testing. The Substance Abuse and Mental Health Services Administration has funded 67 grantees in 25 states to increase HIV testing among blacks affected by substance abuse, and the Office of Population Affairs has funded 41 grantees in 34 states to expand HIV testing services in family planning clinics. The analysis in this report will be used by CDC's Assessment of HIV Testing in Clinical Settings project to establish a baseline for HIV testing levels in clinical settings that can help assess the effect of the 2006 recommendations and the 2007 new initiatives to increase testing. The project also will develop an analysis plan to monitor HIV testing in clinical settings since release of the 2006 recommendations and describe successful strategies used to overcome barriers to testing. HIV testing is an integral part of a comprehensive HIV prevention strategy (10), in which all persons have the opportunity to know their infection status and have access to services needed to prevent transmission and disease progression. Acknowledgments This report is based, in part, on contributions by F Belcher, P Topete, J Anderson, R Zuwallack, K Hannah, K Omland, Macro International, Inc., Calverton, Maryland; and L Lin, A Drake, Div of HIV/AIDS Prevention, National Center for HIV/AIDS, Viral Hepatitis, STD, and TB Prevention, CDC. References
* Persons were asked: "Except for tests you may have had as part of blood donations, have you ever been tested for HIV?" and "Not including blood donations, in what month and year was your last test for HIV (the virus that causes AIDS)?" † Persons were asked whether any of the following statements were true for them but not which applied to them: "You have hemophilia and have received clotting factor concentrations." "You are a man who has had sex with other men (even just one time)." "You have taken street drugs by needle (even just one time)." "You have traded sex for money or drugs (even just one time)." "You have tested positive for HIV (the virus that causes AIDS)." or "You have had sex (even just one time) with someone who would answer `yes' to any of these statements." § Includes certain clinical settings (public health department clinic, drug treatment facility, family planning clinic, prenatal clinic, sexually transmitted disease clinic, community health clinic, and other clinic), and one nonclinical setting (AIDS clinic/counseling and testing site).
Table 1
All MMWR HTML versions of articles are electronic conversions from typeset documents. This conversion might result in character translation or format errors in the HTML version. Users are referred to the electronic PDF version (http://www.cdc.gov/mmwr) and/or the original MMWR paper copy for printable versions of official text, figures, and tables. An original paper copy of this issue can be obtained from the Superintendent of Documents, U.S. Government Printing Office (GPO), Washington, DC 20402-9371; telephone: (202) 512-1800. Contact GPO for current prices. **Questions or messages regarding errors in formatting should be addressed to mmwrq@cdc.gov.Date last reviewed: 8/6/2008 |
|||||||||
|