 |
|
|
|
|
|
|
| ||||||||||
|
|
|
|
|
|
|
||||
| ||||||||||
|
|
|
|
|
Persons using assistive technology might not be able to fully access information in this file. For assistance, please send e-mail to: mmwrq@cdc.gov. Type 508 Accommodation and the title of the report in the subject line of e-mail. Influenza and Pneumococcal Vaccination Coverage Levels Among Persons Aged greater than or equal to 65 Years -- United States, 1973-1993Recommendations to provide annual influenza vaccination and one dose of pneumococcal vaccine to all persons aged greater than or equal to 65 years (1,2) are intended to reduce the high morbidity and mortality associated with influenza and pneumococcal disease. One of the national health objectives for the year 2000 is to increase influenza and pneumococcal vaccination levels to greater than or equal to 60% for persons at high risk for influenza and pneumococcal disease, including those aged greater than or equal to 65 years (objective 20.11) (3). This report summarizes 1) estimates of influenza vaccination coverage levels among persons aged greater than or equal to 65 years during 1973-1985 and pneumococcal vaccination coverage levels for 1984-1985 based on data from the United States Immunization Survey (USIS) and 2) influenza and pneumococcal vaccination coverage levels among persons aged greater than or equal to 65 years and for selected population subgroups during 1989-1993 based on data from the National Health Interview Survey (NHIS). The USIS was initiated in 1959 and conducted through 1985 (4) using a weighted random sample of the U.S. civilian households that was representative of the civilian noninstitutionalized population based on the preceding decennial census. During 1973-1985, approximately 37,500-57,000 households were surveyed; participants were asked whether they had been vaccinated against influenza during the previous year. During 1984-1985, participants were asked whether they had ever received pneumococcal vaccine. Persons aged greater than or equal to 15 years who were most knowledgeable about the health status of household members were interviewed regarding the vaccination histories of all members. The NHIS, conducted annually since 1957, is a multistage cluster survey of U.S. civilian households that obtains a representative sample of the civilian noninstitutionalized population (5). Interviews are conducted with all available family members aged greater than or equal to 18 years. Respondents are asked whether they were vaccinated against influenza during the previous year and whether they ever received pneumococcal vaccine. Each year, approximately 8000 respondents aged greater than or equal to 65 years participated in the survey. Responses were analyzed using SUDAAN and weighted to reflect the age, sex, and race/ethnicity of the U.S. noninstitutionalized population. To assist in targeting ongoing vaccination efforts, NHIS data sets also were analyzed by age, sex, race/ethnicity, income, and reported number of physician visits during the previous year. Data are presented for white, black, and Hispanic populations; data for other groups were too small for meaningful analysis. Based on USIS data, during 1973-1985, influenza vaccination levels among persons aged greater than or equal to 65 years ranged from 22% to 30%, except for an increase (to 38%) during the 1976-1977 "swine flu" National Influenza Immunization Program Figure_1. Pneumococcal vaccination levels were 9.8% and 10.7% in 1984 and 1985, respectively. Based on NHIS data, from 1989 through 1993, influenza vaccination coverage levels increased by 19.1%, from 32.9% to 52.0%, and the cumulative pneumococcal vaccination coverage level increased by 13.5% from 14.7% to 28.2%. There was no statistical difference in coverage rates by sex for either vaccine during any year (Table_1, page 513). However, vaccination levels for both vaccines were lower among blacks and Hispanics when compared with whites. In addition, coverage levels were higher among persons at or above the poverty level * and those who had visited a physician during the previous year. Reported by: Adult Vaccine Preventable Disease Br, Epidemiology and Surveillance Div, National Immunization Program; Div of Health Interview Statistics, National Center for Health Statistics, CDC. Editorial NoteEditorial Note: Although the USIS and NHIS employed different methods, both provided national estimates of vaccination rates based on the weighted response of household-based surveys of the noninstitutionalized U.S. population. Analysis of data from these surveys indicate that, during 1973-1993, vaccination coverage levels for influenza and pneumococcal vaccines increased among persons aged greater than or equal to 65 years. These findings suggest a substantial impact on coverage levels as the result of efforts by public- and private-sector health providers and advocates; however, among some groups levels remain low and are substantially less than the national health objective for the year 2000, particularly for pneumococcal vaccination. Increases in influenza vaccination levels may reflect 1) greater acceptance of preventive medical services by practitioners and 2) increased delivery and administration of vaccine by health-care providers and sources other than physicians (e.g., visiting-nurse and home-health agencies). In addition, the initiation of Medicare reimbursement for influenza vaccination in 1993 also may have contributed to increased rates (6). Although pneumococcal vaccine is greater than or equal to 57% effective against invasive pneumococcal disease (7), some physicians have expressed persistent uncertainty regarding the effectiveness of this vaccine against pneumococcal pneumonia (8). In addition, while campaigns for influenza vaccine occur annually before the influenza season, many providers and patients may not be routinely reminded about the need for pneumococcal vaccination among persons aged greater than or equal to 65 years, underscoring the need to educate providers and patients about the benefits of pneumococcal vaccination and current recommendations. The findings in this report are consistent with previous surveys that have documented lower vaccination coverage levels among blacks than whites (9). These variations may reflect differences in factors such as socioeconomic status, access to medical care, and prevalence of specific risks. However, preliminary analysis indicates that differences by race/ethnicity persisted when the data were adjusted for socioeconomic status. Achievement of national health objectives for the year 2000 will require the continued collaboration of public and private organizations to improve awareness and vaccine delivery; changes in clinical practice; delivery mechanisms that limit cost and remove accessibility constraints; and surveillance data, such as those provided by NHIS, to assess the progress of current and future programs. The report of the National Vaccine Advisory Committee regarding adult vaccination (10) has described these strategies, which include improvements in education of health-care providers and the public; major changes in clinical practice; increased financial support by public and private health insurers; improvements in surveillance for vaccine-preventable diseases and vaccine production and delivery; development of new and improved vaccines; research on and improvements in vaccination practices; and collaboration on international programs for adult vaccination. References
* Poverty statistics are based on a definition originated by the Social Security Administration in 1964, subsequently modified by federal interagency committees in 1969 and 1980, and prescribed by the Office of Management and Budget as the standard to be used by federal agencies for statistical purposes. Figure_1 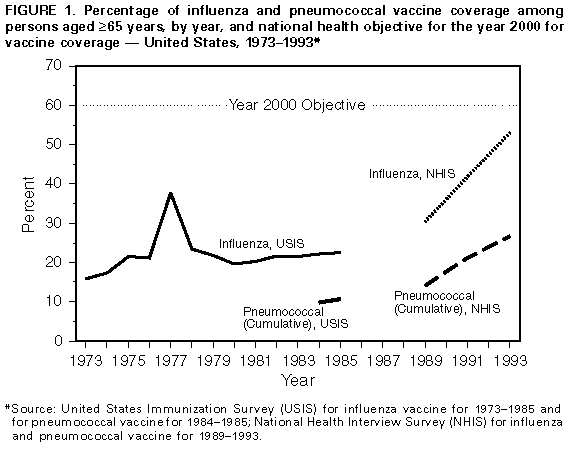 Return to top. Table_1 Note: To print large tables and graphs users may have to change their printer settings to landscape and use a small font size.
TABLE 1. Vaccination coverage levels with influenza and pneumococcal vaccines among persons aged >=65 years,
by selected characteristics -- United States, selected years 1989-1993
=============================================================================================================
                                 1989                        1991                        1993
                          ------------------------     ---------------------      ---------------------------
Vaccine/Characteristics    %        (95% CI * )         %          (95% CI)        %           (95% CI)
-------------------------------------------------------------------------------------------------------------
INFLUENZA
Sex
  Male                     34.4%   (31.5%-37.3%)        41.9%    (39.8%-44.0%)      54.1%     (51.5%-56.7%)
  Female                   31.9%   (29.9%-33.9%)        41.5%    (39.6%-43.4%)      50.4%     (48.3%-52.5%)

Race/Ethnicity +
  White, non-Hispanic      34.5%   (32.6%-36.4%)        43.5%    (41.8%-45.2%)      54.0%     (52.3%-55.7%)
  Black, non-Hispanic      19.6%   (14.7%-24.5%)        27.3%    (23.2%-31.5%)      32.2%     (27.3%-37.2%)
  Hispanic                 27.7%   (19.6%-35.7%)        34.9%    (26.6%-43.1%)      46.8%     (35.0%-58.6%)

Socioeconomic status
  At or above
    poverty level &        34.6%   (32.7%-36.6%)        42.7%    (40.9%-44.5%)      54.0%     (52.1%-55.9%)
  Below poverty level      26.2%   (22.3%-30.1%)        36.1%    (31.9%-40.3%)      40.9%     (35.4%-46.4%)

No. physician visits
 >=1 Physician visit
  during previous year     36.7%   (34.7%-38.6%)        45.4%    (43.7%-47.1%)      55.8%     (54.0%-57.6%)
 0 Physician visits
  during previous year     11.9%   ( 8.9%-14.9%)        17.5%    (14.6%-20.3%)      22.0%     (17.9%-26.1%)

Total                      32.9%   (31.2%-34.7%)        41.7%    (40.1%-43.2%)      52.0%     (50.4%-53.6%)

PNEUMOCOCCAL
Sex
  Male                     14.0%   (12.1%-15.9%)        21.4%    (19.6%-23.1%)      30.3%     (27.7%-32.8%)
  Female                   15.2%   (13.5%-17.0%)        21.0%    (19.4%-22.6%)      26.7%     (24.4%-28.9%)

Race/Ethnicity
  White, non-Hispanic      15.7%   (14.3%-17.2%)        22.2%    (20.8%-23.6%)      30.4%     (28.6%-32.2%)
  Black, non-Hispanic       6.3%   ( 3.5%- 9.1%)        14.1%    (10.8%-17.4%)      14.3%     (10.4%-18.2%)
  Hispanic                 11.1%   ( 6.0%-16.1%)        13.7%    ( 8.6%-18.8%)      11.5%     ( 5.4%-17.6%)

Socioeconomic status
  At or above
    poverty level          15.4%   (13.9%-16.9%)        22.1%    (20.6%-23.5%)      29.7%     (27.8%-31.6%)
  Below poverty level      10.2%   ( 7.1%-13.2%)        16.8%    (12.3%-21.2%)      17.5%     (13.4%-21.7%)

No. physician visits
  >=1 Physician visit
   during previous year    16.6%   (15.0%-18.1%)        23.2%    (21.7%-24.6%)      30.0%     (28.1%-31.9%)
  0 Physician visits
   during previous year     4.3%   ( 2.4%- 6.2%)         8.9%    ( 6.8%-10.9%)      14.4%     (10.8%-18.0%)

Total                      14.7%   (13.4%-16.0%)        21.2%    (19.9%-22.4%)      28.2%     (26.4%-29.9%)
-------------------------------------------------------------------------------------------------------------
* Confidence interval.
+ Data for other racial/ethnic groups were too small for meaningful analysis.
& Poverty statistics are based on a definition originated by the Social Security Administration in 1964,
  subsequently modified by federal interagency committees in 1969 and 1980, and prescribed by the Office of
  Management and Budget as the standard to be used by federal agencies for statistical purposes.

 Source: National Health Interview Survey 1989-1993.
=============================================================================================================
Return to top. Disclaimer All MMWR HTML versions of articles are electronic conversions from ASCII text into HTML. This conversion may have resulted in character translation or format errors in the HTML version. Users should not rely on this HTML document, but are referred to the electronic PDF version and/or the original MMWR paper copy for the official text, figures, and tables. An original paper copy of this issue can be obtained from the Superintendent of Documents, U.S. Government Printing Office (GPO), Washington, DC 20402-9371; telephone: (202) 512-1800. Contact GPO for current prices. **Questions or messages regarding errors in formatting should be addressed to mmwrq@cdc.gov.Page converted: 09/19/98 |
|||||||||
This page last reviewed 5/2/01
|